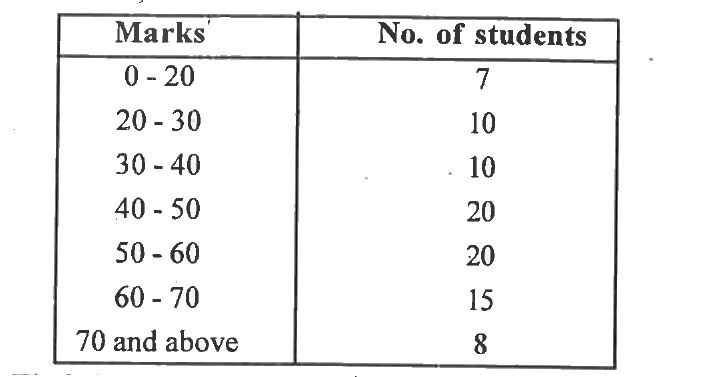
A teacher analyses the performance of two sections of students in a mathematics test of 100 marks given in the following table.

Find the probability that a student obtained less than 20 in the mathematics test. Solution in Kannada
The correct Answer is:790
Step by step video, text & image solution for A teacher analyses the performance of two sections of students in a mathematics test of 100 marks given in the following table. Find the probability that a student obtained less than 20 in the mathematics test. by Maths experts to help you in doubts & scoring excellent marks in Class 9 exams.
Updated on:21/07/2023Topper's Solved these Questions
Similar Questions
Use suitable identities of find the following products
(x+4)(x+10)
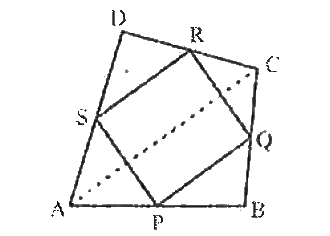
View SolutionABCD is a quadrilateral in which P, Q, R and S are mid- points of the sides AB, BC, CD and DA. AC is a diagonal. Show that :
SR|A|C and SR=12AC

View SolutionDetermine the point of symmetry of a regular hexagon.
View SolutionDtermine the images of the following figure about the given line :
View SolutionMatch the following Column A to Column B

View SolutionMatch the following Column A to Column B

View SolutionMatch the following Column A to Column B

View SolutionFind the area of figure given below.

View SolutionFind the perimeter of the figure given below.

View SolutionFind the area of the figure given below.

View SolutionThe inequation represented by the graph given below is :
View SolutionThe inequation that best describes the graph given below is _________
View SolutionThe inequation that best describes the following graph is _________
View SolutionWhich inequations represent the shaded region in the given figure
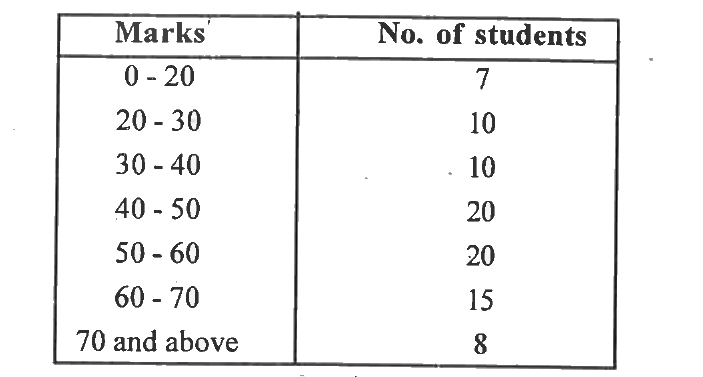
View SolutionA teacher analyses the performance of two sections of students in a mathematics test of 100 marks given in the following table.

Find the probability that a student obtained marks 60 or above.
View Solution

