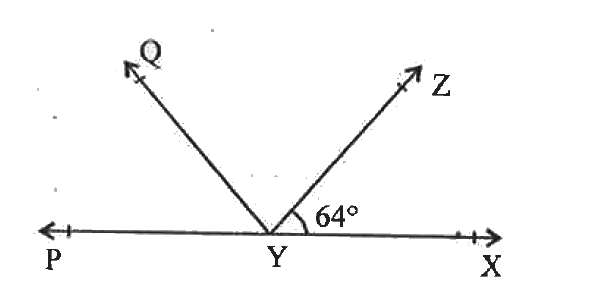
It is given that ⌊XYZ=64∘ and XY is produced to point P. Draw a figure from the given information . If ray YQ bisects ⌊ZYP, find =⌊XYQand reflex⌊QYP.
 Solution in Kannada
The correct Answer is:122∘
Step by step video, text & image solution for It is given that lfloorXYZ = 64^(@) and XY is produced to point P. Draw a figure from the given information . If ray YQ bisects lfloorZYP, " find " =lfloorXYQ and " reflex" lfloorQYP. by Maths experts to help you in doubts & scoring excellent marks in Class 9 exams.
Updated on:21/07/2023Topper's Solved these Questions
- LINES AND ANGLES BOOK - SUBHASH PUBLICATIONCHAPTER - LINES AND ANGLES EXERCISE - EXERCISE 3.2
3 Videos
- LINES AND ANGLES BOOK - SUBHASH PUBLICATIONCHAPTER - LINES AND ANGLES EXERCISE - EXERCISE 3.3
6 Videos
- LINEAR EQUATIONS IN TWO VARIABLESBOOK - SUBHASH PUBLICATIONCHAPTER - LINEAR EQUATIONS IN TWO VARIABLESEXERCISE - EXERCISE 10.4
4 Videos
- NUMBER SYSTEMBOOK - SUBHASH PUBLICATIONCHAPTER - NUMBER SYSTEMEXERCISE - Exercise 1.6
11 Videos
Similar Questions
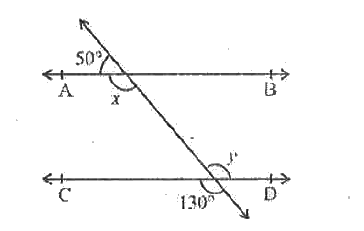
In the Figure find the values of x and y and then show that AB∣∣CD.

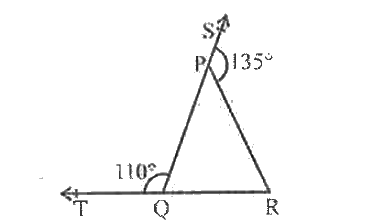
View SolutionIn Fig , sides QP and RQ and RQ of ΔPQR are produced to points S and T respectively . If ⌊SRP=135∘and⌊PQT=110∘, find ⌊PRO.

View SolutionGive geometric representation of y=3 as an equation
in one variable
View SolutionFind
6412
View SolutionIt is given that ∠XYZ=64∘ and XY is produced to point P. Draw a figure from the given information. If ray YQ bisects ∠ZYP, find ∠XYQ and reflex ∠QYP.
View SolutionDetermine the point of symmetry of a regular hexagon.
View SolutionDtermine the images of the following figure about the given line :
View SolutionMatch the following Column A to Column B

View SolutionMatch the following Column A to Column B

View SolutionMatch the following Column A to Column B

View SolutionFind the area of figure given below.

View SolutionFind the perimeter of the figure given below.

View SolutionFind the area of the figure given below.

View SolutionThe inequation represented by the graph given below is :
View SolutionThe inequation that best describes the graph given below is _________
View Solution
