A student noted the number of cars passing through a spot on a road for 100 periods each of 3 minutes and summarised it in the table given below. Find the mode of the data. Solution in Kannada
The correct Answer is:44.7
Step by step video, text & image solution for A student noted the number of cars passing through a spot on a road for 100 periods each of 3 minutes and summarised it in the table given below. Find the mode of the data. by Maths experts to help you in doubts & scoring excellent marks in Class 10 exams.
Updated on:21/07/2023Topper's Solved these Questions
- STATISTICS Book:SUBHASH PUBLICATIONChapter:STATISTICS Exercise:EXERCISE 13.3
Explore 7 Videos
- STATISTICS Book:SUBHASH PUBLICATIONChapter:STATISTICS Exercise:EXERCISE 13.4
Explore 3 Videos
- STATISTICS Book:SUBHASH PUBLICATIONChapter:STATISTICS Exercise:EXERCISE 13.4
Explore 3 Videos
- SOME APPLICATIONS OF TRIGONOMETRY Book:SUBHASH PUBLICATIONChapter:SOME APPLICATIONS OF TRIGONOMETRY Exercise:EXERCISE 9.1
Explore 16 Videos
- SURFACE AREAS AND VOLUMES Book:SUBHASH PUBLICATIONChapter:SURFACE AREAS AND VOLUMES Exercise:EXERCISE 15.5
Explore 4 Videos
Similar Questions
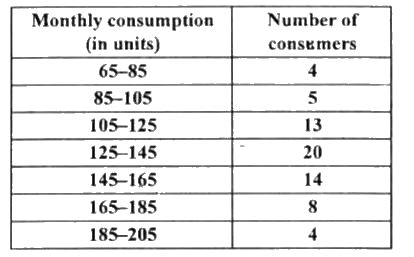
The following frequency distribution gives the monthly consumption of electricity of 68 consumers of a locality. Find the median, mean and mode of the data and compare them.

View SolutionThe following distribution gives the daily income of 50 workers of a factory.

Convert the distribution above to a less than type cumulative frequency distribution, and draw its ogive.
View SolutionThe following distribution gives the daily income of 50 workers of a factory.

Convert the distribution above to a less than type cumulative frequency distribution, and draw its ogive.
View SolutionA circus artist is climbing a 20m long rope, which is tightly stretched and tied from the top of a vertical pole to the ground.Find the height of the pole, if the angle made by the rope with the ground levelis 30∘ ( see Figure)
View SolutionA copper wire, 3mm in diameter , is wound about a cylinder whose length is 12cm, and diameter 10cm, so as to cover the curved surface of the cylinder . Find the length and mass of the wire, assuming the density of copper to be 8.88gpercm3
View SolutionA student noted the number of cars passing through a spot on a road for 100 periods each of 3 minutes and summarised it in the table given below. Find the mode of the data :

View SolutionFollowing table shows a frequency distribution for the speed of cars passing through at a particular spot on a high way.

Draw a histogram and frequency polygon representing the data above.
View Solutionएक विद्यार्थी ने एक सड़क के किसी स्थान से होकर जाती हुई कारों की संख्याएँ नोट की और उन्हें नीचे दी हुई सारणी में व्यक्त किया । सारणी में दिया प्रत्येक प्रेक्षण 3 मिनट के अंतराल में उस स्थान से होकर जाने वाली कारों की संख्याओं से संबंधित है। ऐसे 100 अंतरालों पर प्रेक्षण लिए गए । इन आँकड़ों का बहुलक ज्ञात कीजिए ।

View SolutionA student noted the number of cars passing through a spot on a road for 100 periods , each of 3 minutes , an summarised this in the table given below .
Number of carsFrequency0−10710−201420−301330−401240−502050−601160−701570−808
Find the mode of the data .
View SolutionOne student counted the number of cars moving from one location on the road every three minutes (1 period) to 100 periods and summarized the details in the table below. Find the "plurality" of the above data.
View SolutionThe donations given to an orphanage home by the students of different classes of a secondary school are given below.

Find the mean, median and mode of the data.
View SolutionA student noted the number of cars passing thorugh a spot on a road for 100 periods, each of 3 minutes, and summarised this in the table given below.

Find the mode of the data.
View SolutionThe donations given to an orphanage home by the students of different classes of a secondary school are given below.

Find the mean, median and mode of the data.
View SolutionA student noted the number of cars passing thorugh a spot on a road for 100 periods, each of 3 minutes, and summarised this in the table given below.

Find the mode of the data.
View SolutionA student noted the number of cars passing through a spot on a road for 100 periods each of 3 minutes and summarised it in the table given below. Find the mode of the data :
View Solution

