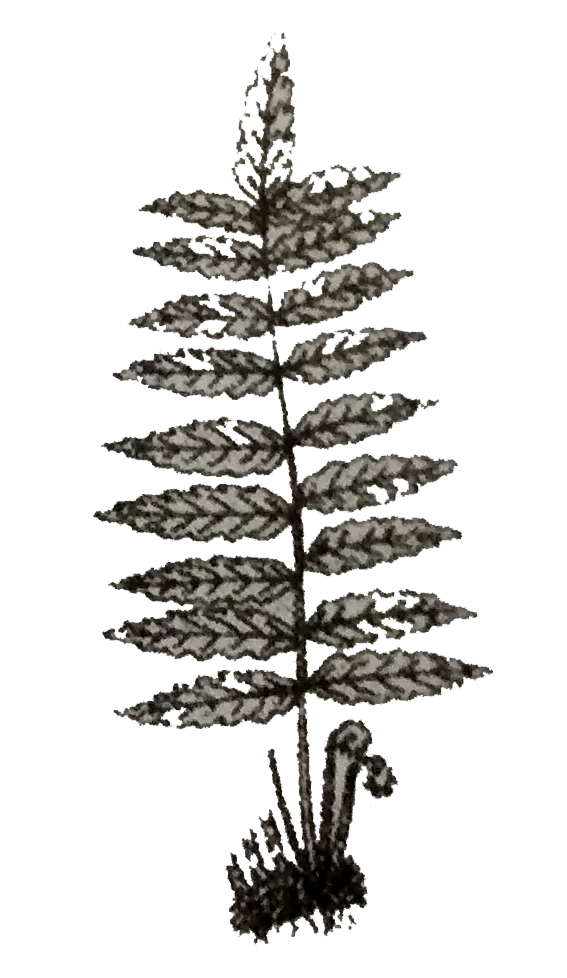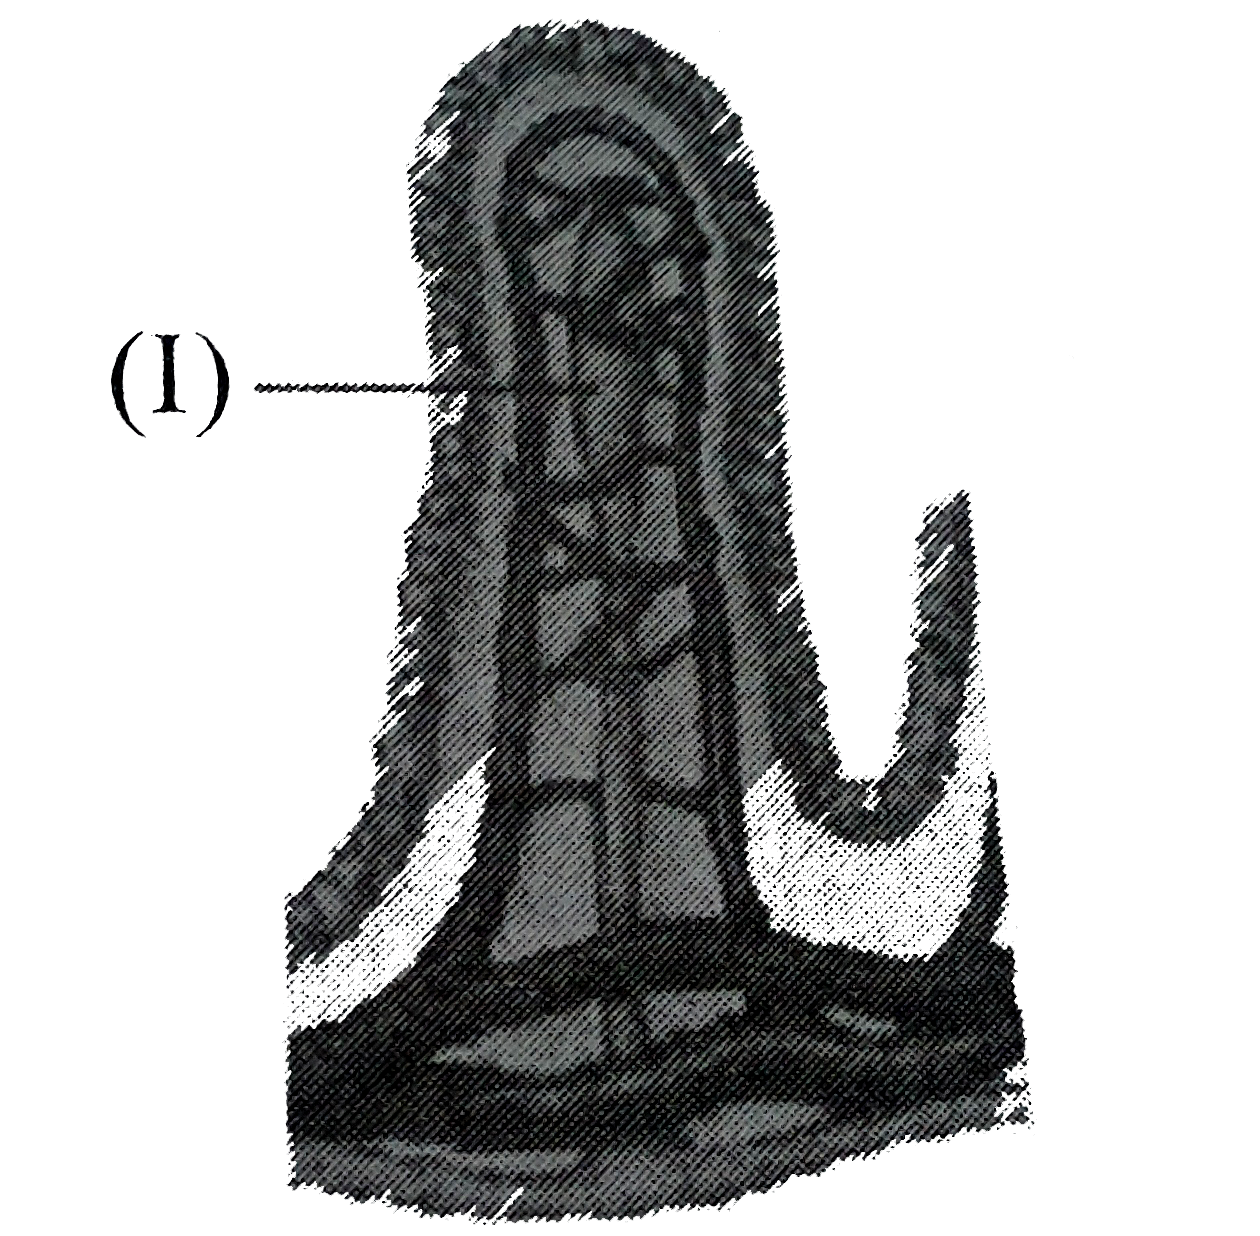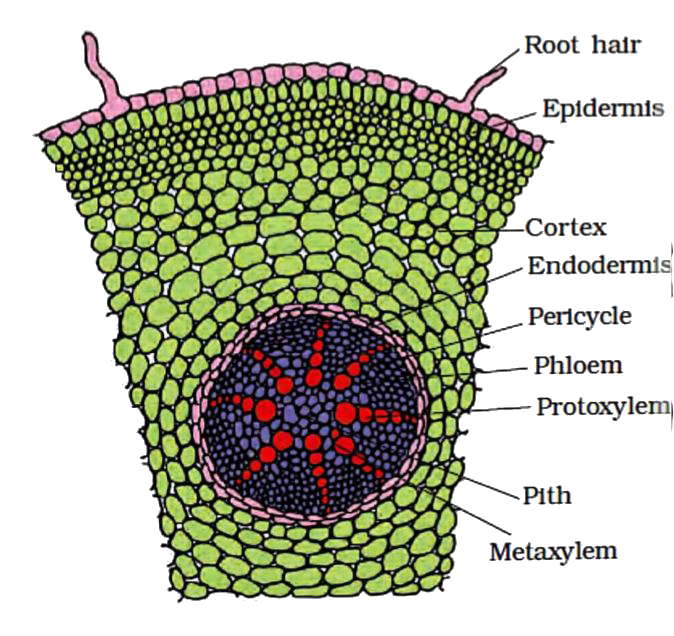
The given figure shows T.S of
A
Dicot root
B
Monocot root
C
Secondary growth in dicot root
D
Secondary growth in monocot root
Video Solution
Text Solution
The correct Answer is:B
|
Answer
Step by step video, text & image solution for The given figure shows T.S of by Biology experts to help you in doubts & scoring excellent marks in Class 12 exams.
Updated on:21/07/2023Topper's Solved these Questions
Similar Questions
Knowledge Check
The given figure shows L.S of the seed of maize. What do A, B, C and D represent?
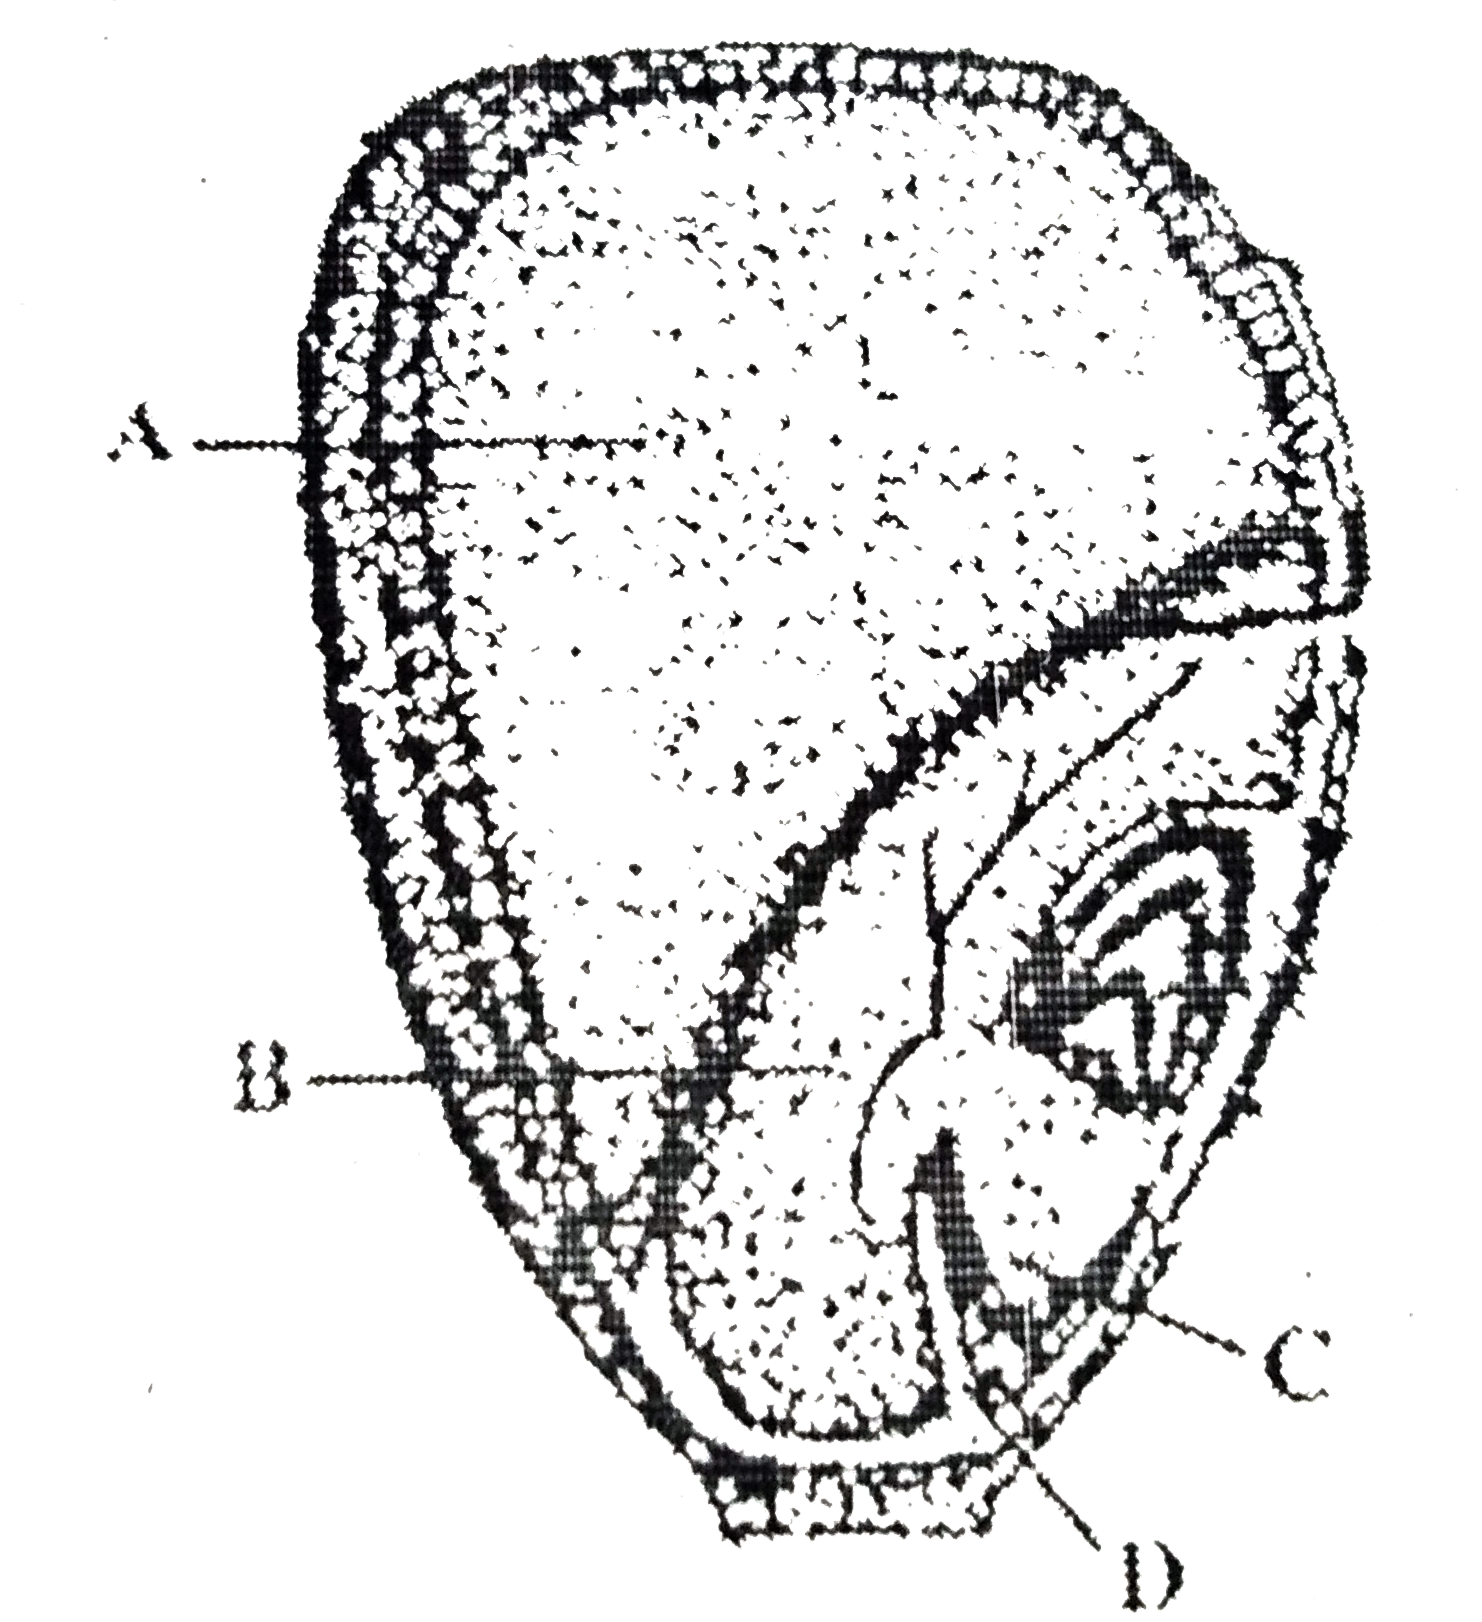 A(a)A: endospermB:scutellumC: plumuleD:coleoptileB(b)A:scutellumB: pericarpC:radicleD:coleoptileC(c)A:endospermB:scutellumC: radicleD-coleorrhizaD(d)A: scutellumB-pericrapC:plumuleD: coleorrhiza
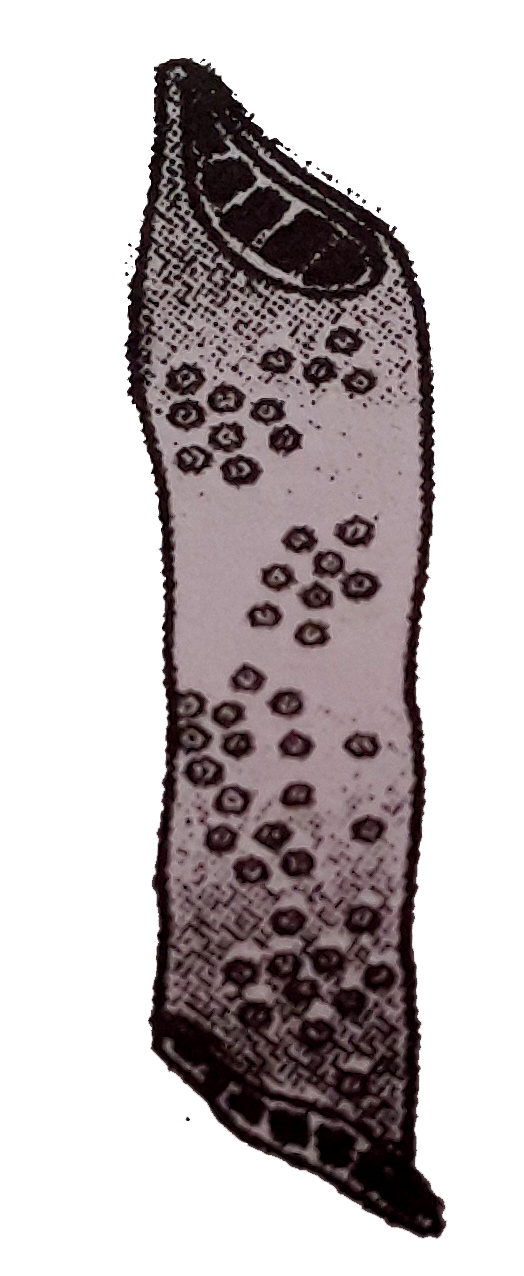
The given figure shows which of the following cells?Acompanion cellBsieve tube elementCXylem vesselDXylem tracheidThe given figure shows a rectifier of alternating current (f=50 c/s), the number of pulses of rectified current obtained in 1s is
 A50B25C100D200
The given figure shows a cube whose edges are equal. Its length, width and height are S units.
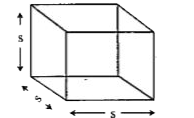
The formula for volume of the cube is given by
View SolutionThe given figure shows the cross-section of a plant.
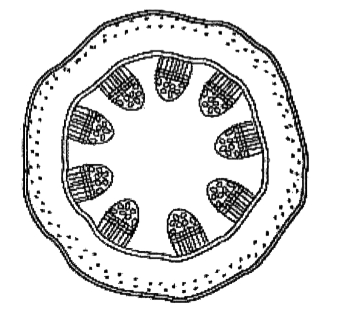
The given cross-section belongs to a
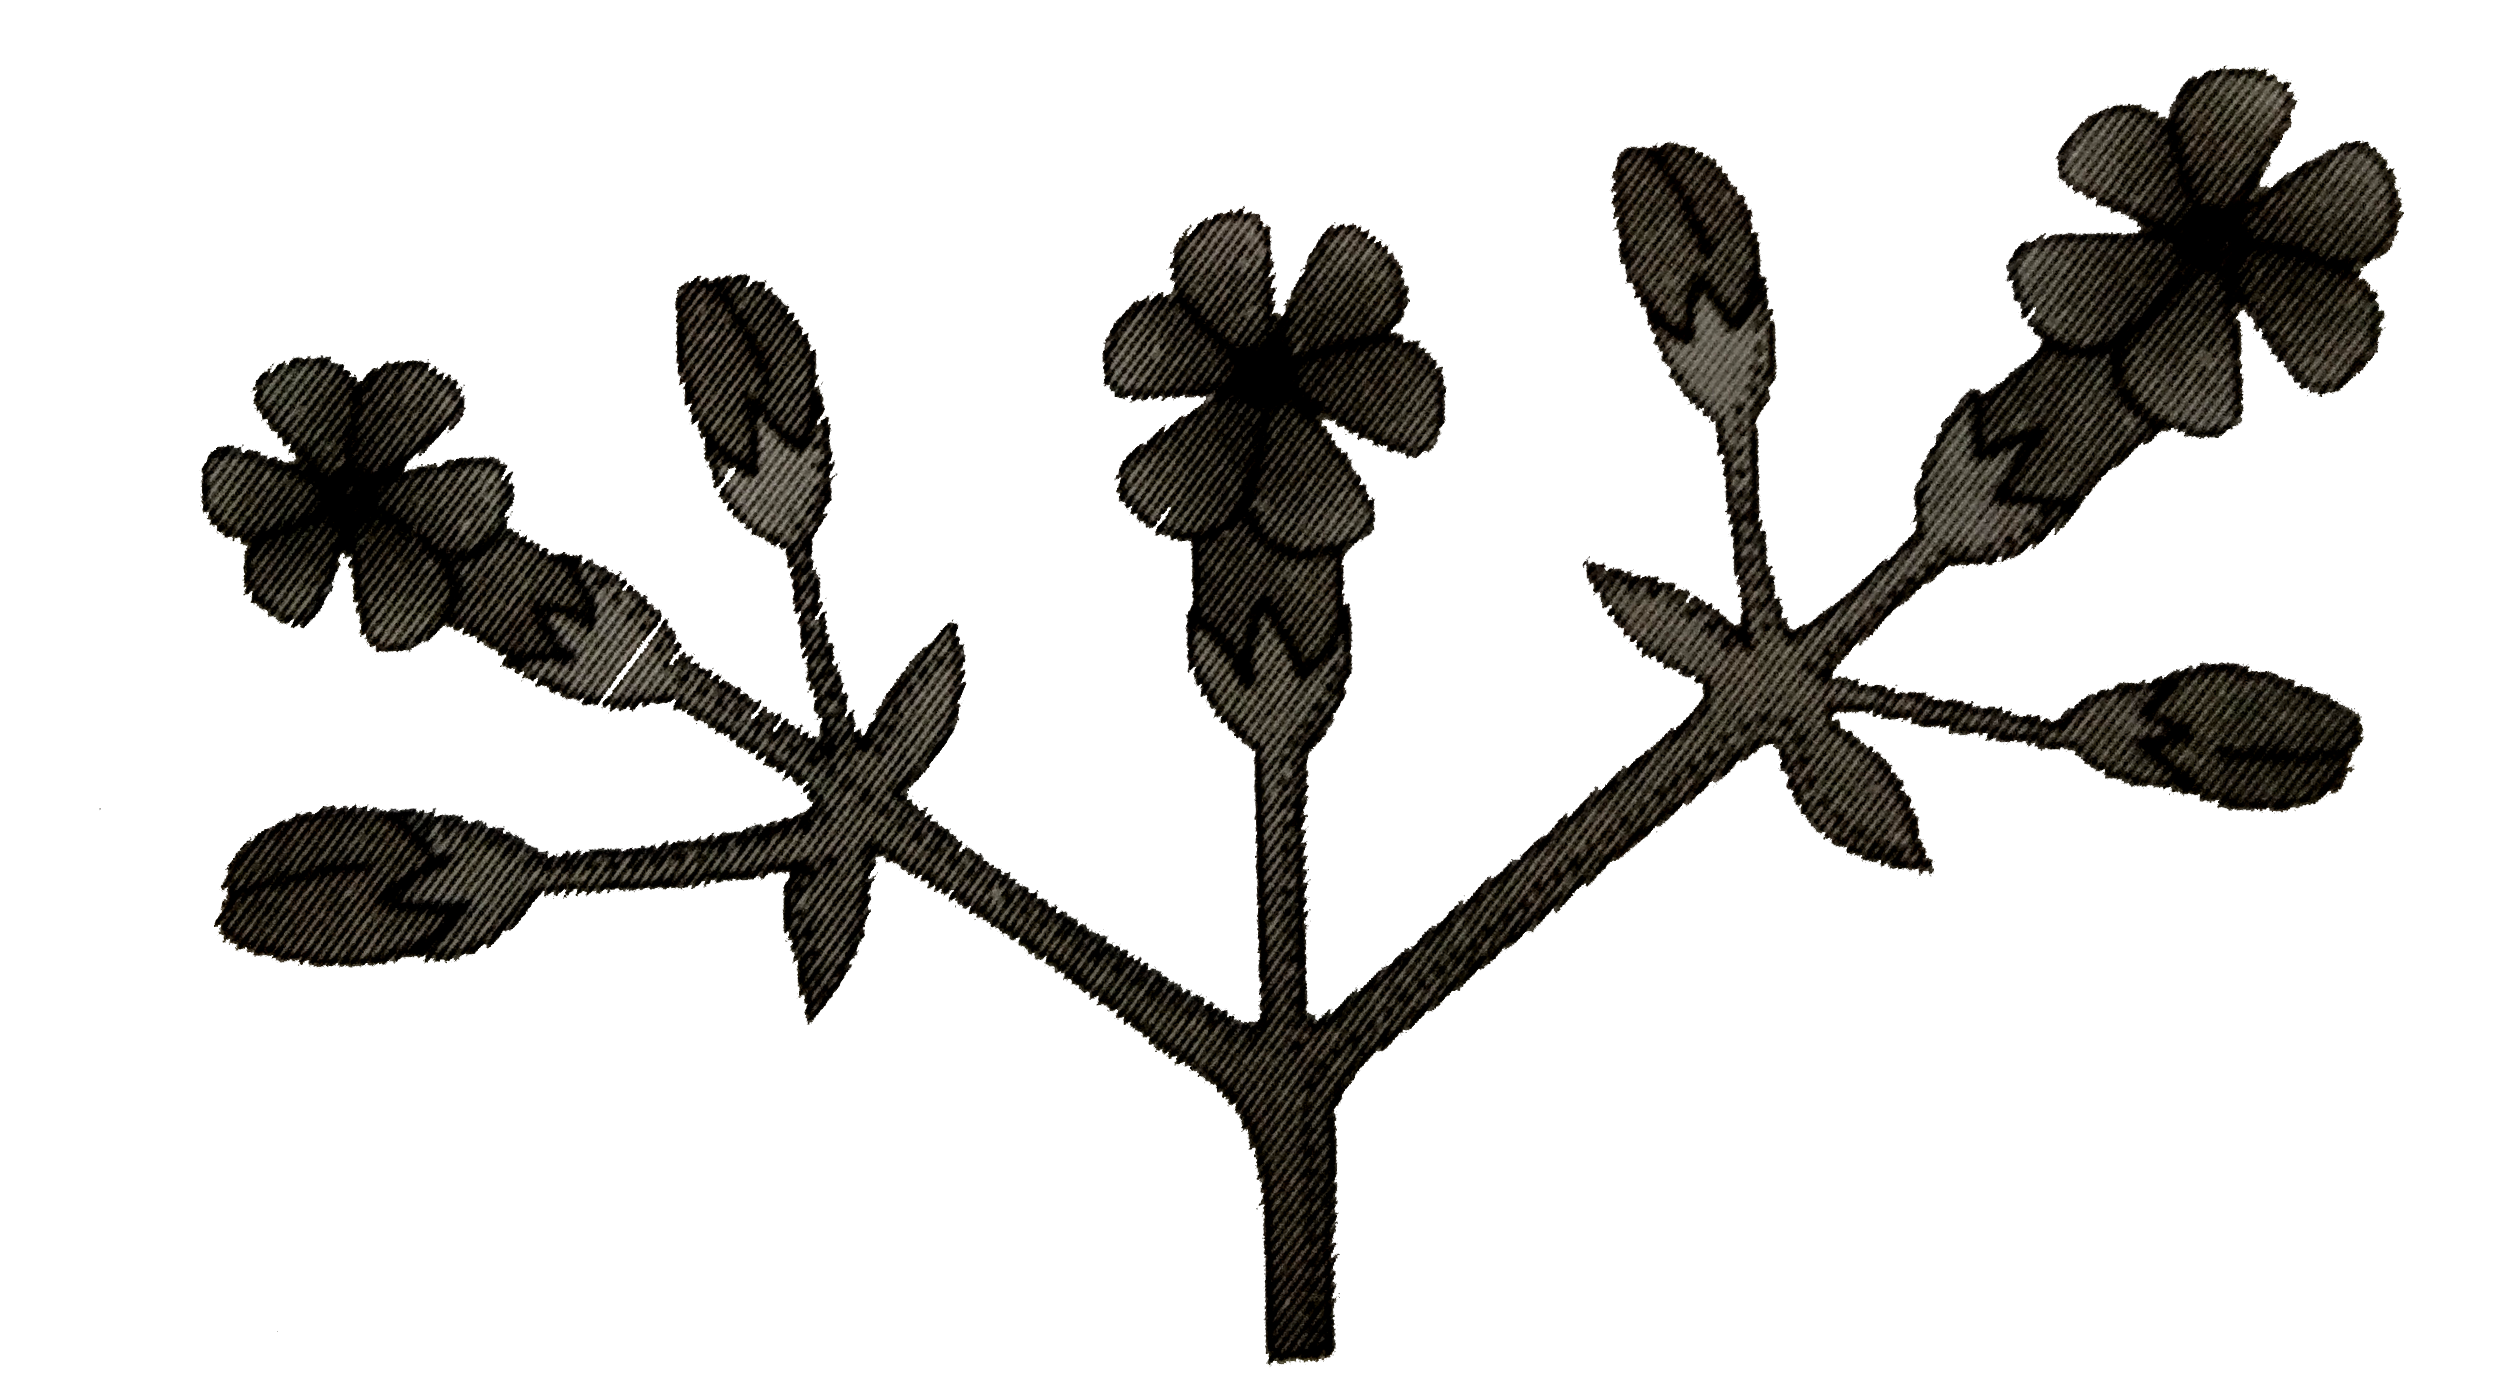
View SolutionWhat type of inflorescence does the given figure show ?
View SolutionThe given figure shows an example of
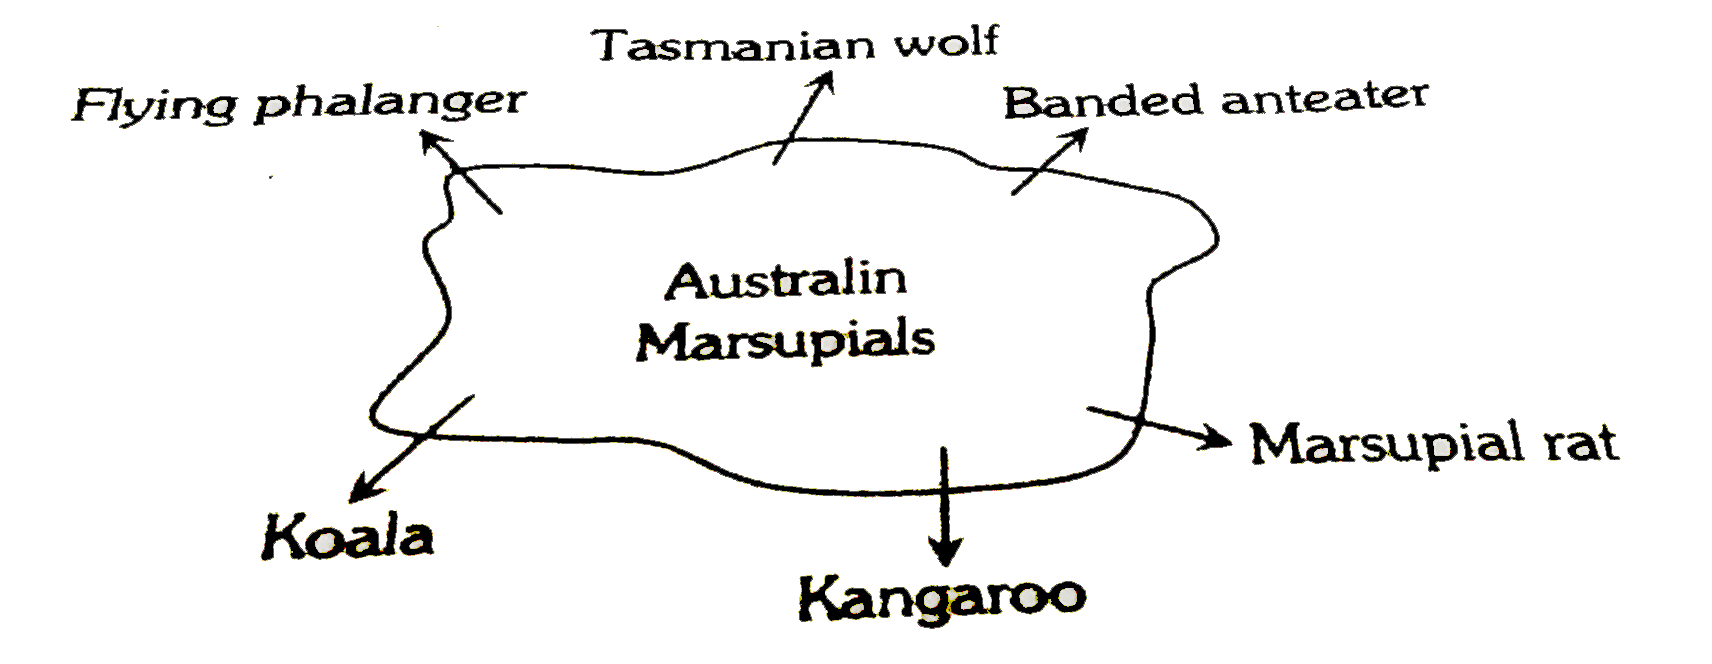
View SolutionThe given figure shows an example of
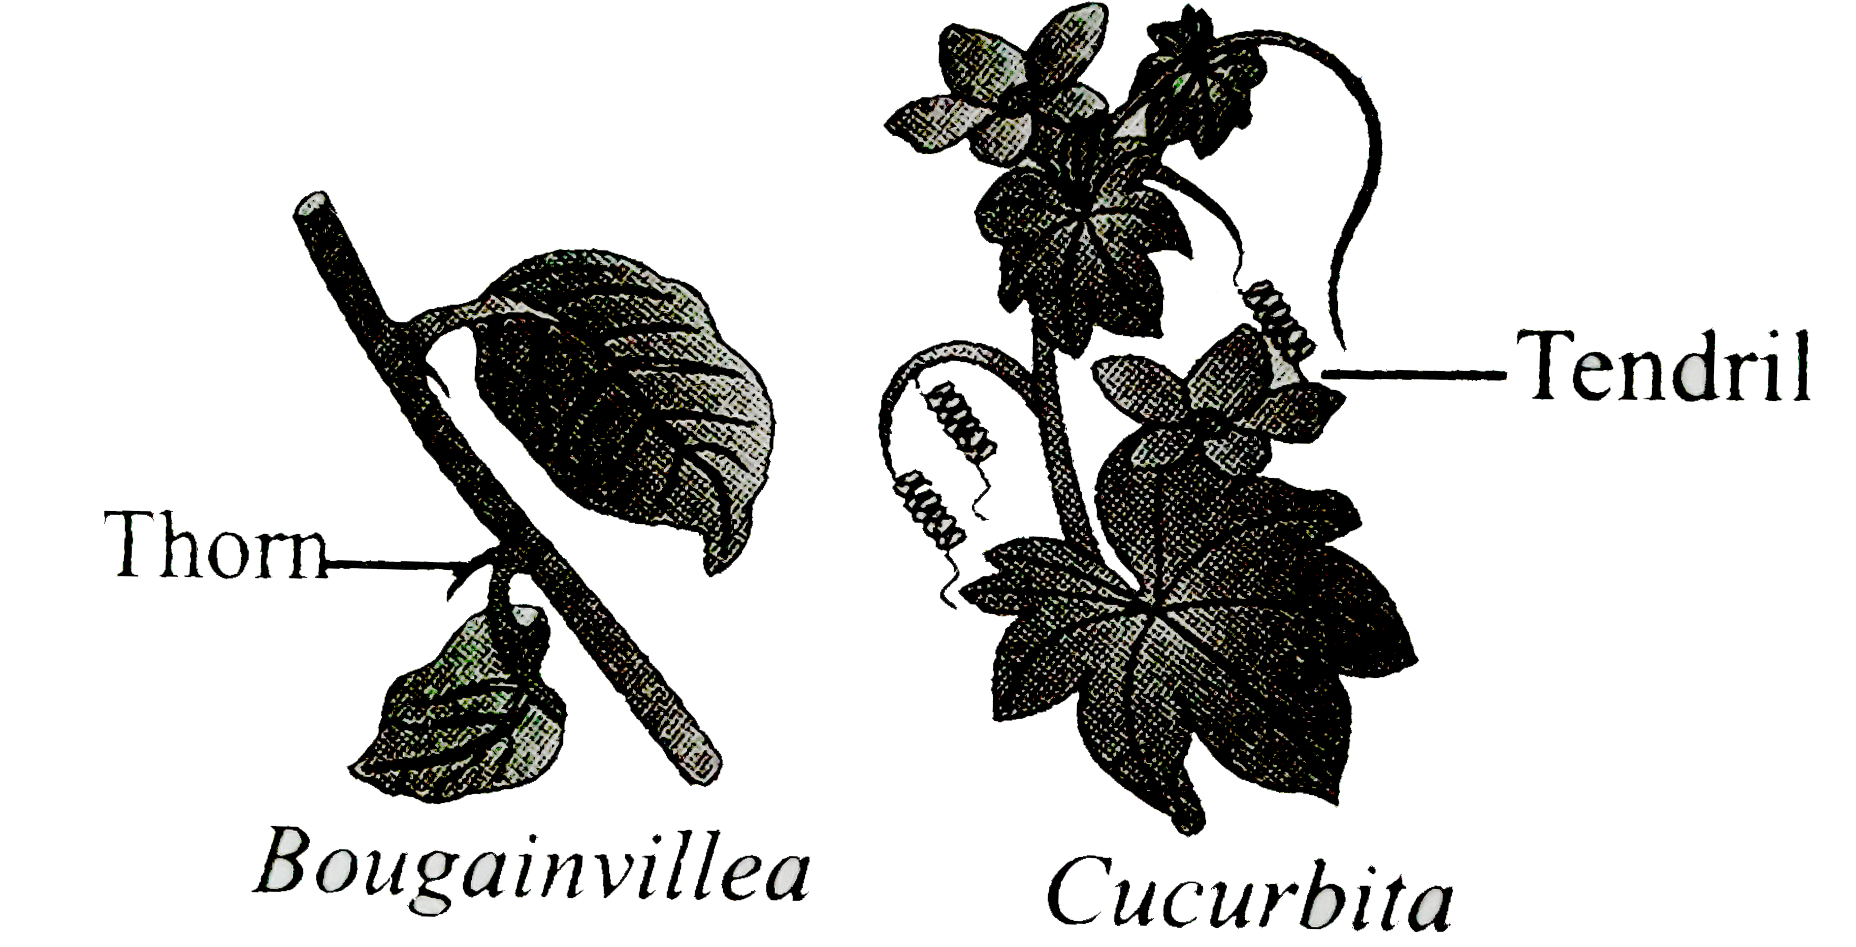
View Solution


