A survey in a study skills class asked the 20 students enrolled in the class how many hours (rounded to the nearest hour) they had spent studying on the previous evening. The 20 responses are summarized by the histogram below.
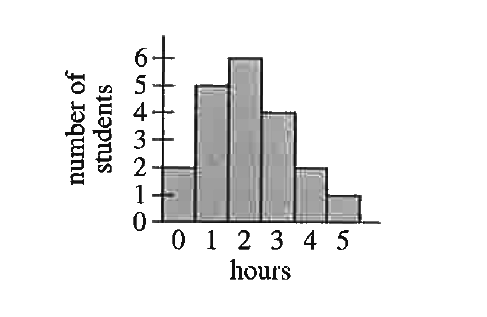
What fraction of the students responded that they had spent less than 3 hours studing?
13100
15
310
1320
The correct Answer is:D
Step by step video, text & image solution for A survey in a study skills class asked the 20 students enrolled in the class how many hours (rounded to the nearest hour) they had spent studying on the previous evening. The 20 responses are summarized by the histogram below. What fraction of the students responded that they had spent less than 3 hours studing? by Maths experts to help you in doubts & scoring excellent marks in Class 12 exams.
Updated on:21/07/2023Topper's Solved these Questions
Similar Questions
The following bar graph (Figure) represents the heights (in cm) of 50 students of Class XI of a particular school. Study the graph and answer the following questions: What percentage of the total number of students have their heights more than 149 cm? How many students in the class are in the range of maximum height of the class? The school wants to provide a particular type of tonic to each student below the height of 150cm to improve his height. If the cost of the tonic for each student comes out to be Rs. 55, how much amount of money is required? How many students are in the range of shortest height of the class? State whether true or false: There are 9 students in the class whose heights are in the range of 155-159 cm. Maximum height (in cm) of a student in the class is 17. There are 29 students in the class whose heights are in the range of 145-154 cm. Minimum height (in cm) of a student is the class is in the range of 140-144cms. The number of students in the class having their heights less than 150cm is 12. There are 14 students each of whom has height more than 154 cm.
View SolutionIn a class of 40 students 15of the total number of studetns like to study English, 25of the total number like to study mathematics and the remaining students like to study Science.
(i) How many students like to study English ?
(ii)How many students like to study Mathematics ?
(iii) What fraction of the total number of students like to study Science ?
View Solution
Knowledge Check
A survey in a study skills class asked the 20 students enrolled in the class how many hours (rounded to the nearest hour) they had spent studying on the previous evening. The 20 responses are summarized by the histogram below.
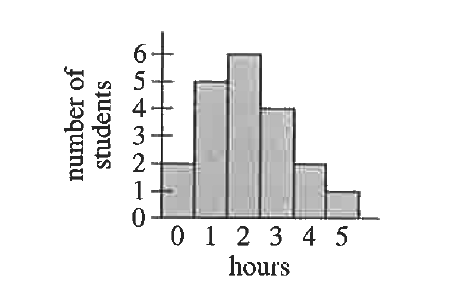
To the nearest tenth of an hour, what is the average number of hours for the 20 survey responses?A2.0B2.1C2.3D2.5A survey in a study skills class asked the 20 students enrolled in the class how many hours (rounded to the nearest hour) they had spent studying on the previous evening. The 20 responses are summarized by the histogram below.
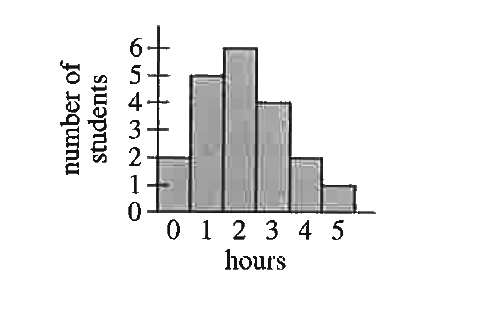
The teacher decides to show the data in a circle graph (pie chart). What should be the measure of the central angle of the sector for 3 hours?A18∘B20∘C36∘D72∘The Harrisburg Recreation Center recently changed its hours to open 1 hour later and close 3 hours later than it had previously. Residents of Harrisburg age 16 or older were given a survey and 560 residents replied. The survey asked each resident his or her student status (high school, college, or nonstudent) and what he or she thought about the change in hour (approve, disapprove, or no opinion). The results are summarized in the table below.

What fraction of these nonstudent resisdents replied they disapproved of the change in hours?A13B445C1475D353485
The number of hours television watched in a day by the students of a particular class during holidays is shown in the following histogram: Look at the histogram and answer the following questions: 1. For how many hours the maximum number of students watch TV? 2. How many students watch TV for less than 4 hours? 3. How many students spend more than 5 hours in watching TV?
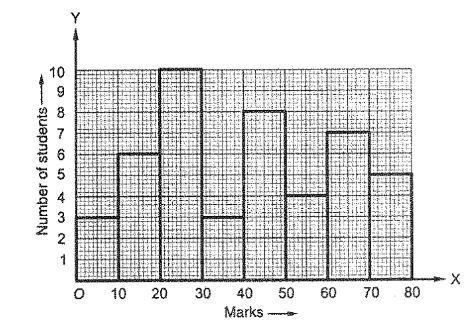
View SolutionThe following histogram depicts the marks obtained by 45 students of a class: Figure: Look at the histogram and answer the following questions: What is the class size? How many students obtained less than 10 marks? How many students obtained 30 or more marks but less than 40? What is the interval of highest marks and how many students are there in this interval? If passing marks are 30, what is the number of failures?
View SolutionThe Harrisburg Recreation Center recently changed its hours to open 1 hour later and close 3 hours later than it had previously. Residents of Harrisburg age 16 or older were given a survey and 560 residents replied. The survey asked each resident his or her student status (high school, college, or nonstudent) and what he or she thought about the change in hour (approve, disapprove, or no opinion). The results are summarized in the table below.

After constructing the table, it was discovered that the student status of 15 residents who replied that they approved had been incorrectly classified as nonstudents. After correcting the errors, exactly 60% of the college students had replied that they approved. To the nearest 1%, what percent of high school students replied that they approved?
View SolutionThe Harrisburg Recreation Center recently changed its hours to open 1 hour later and close 3 hours later than it had previously. Residents of Harrisburg age 16 or older were given a survey and 560 residents replied. The survey asked each resident his or her student status (high school, college, or nonstudent) and what he or she thought about the change in hour (approve, disapprove, or no opinion). The results are summarized in the table below.

Suppose a person will be chosen at random from these 560 residents. Which of the following values is closest to the probability that the person chosen will NOT be a high student and will NOT have replied with no opinion?
View SolutionIn a particular college, the test scores of the most recent test given for a particular Physics class and a particular Literature class were studied. Both tests were scored from 0 to 100 and had a total of 20 question, which were equally weighted with no partial credit. The physics class had 128 students and the Literature class had 75 students . The test results are shown in the two graphs below.
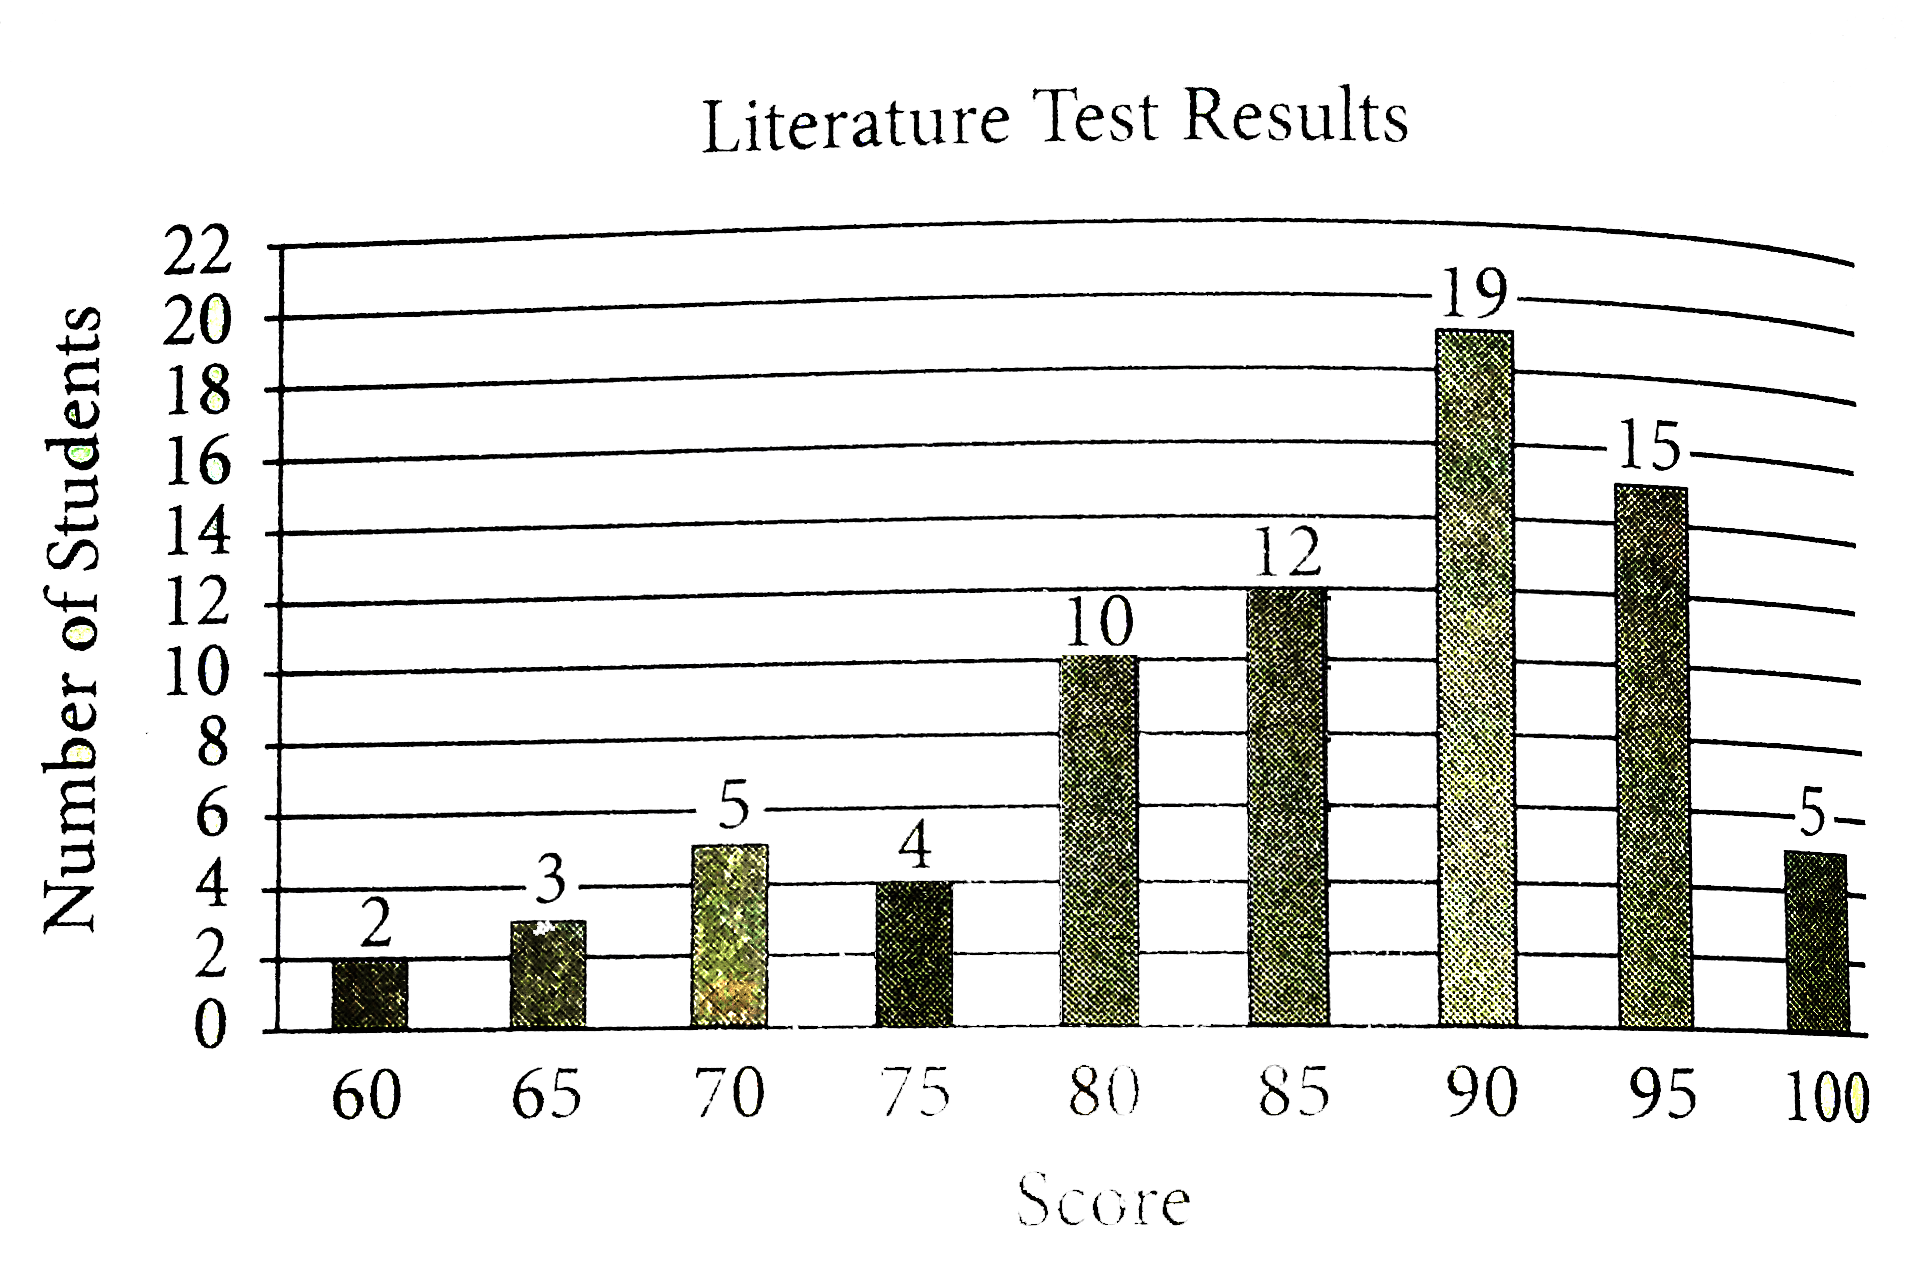
The dean of the college is comparing the scores from the two classes and calculates the median for each class. If the dean labels the median score of the Physics class P and the median score of the Literature class L, what is the sum of P and L?
View Solution

