During a snowstorm, the relationship between the depth of accumulated snow , y inches, and the elapsed time, x hours, was modeled by the equation 2x−5y=−5. One of the following graphs in the standard (x,y) coordinate plane models the equation for positive values of x and y. Which one?
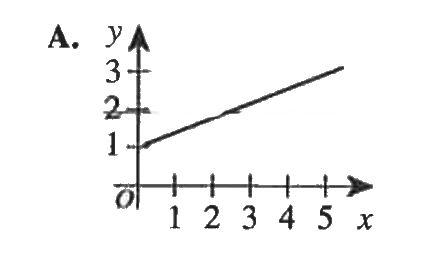
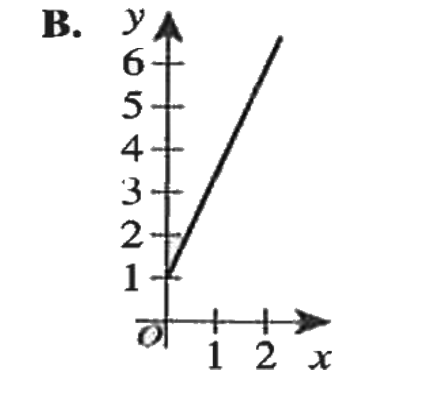

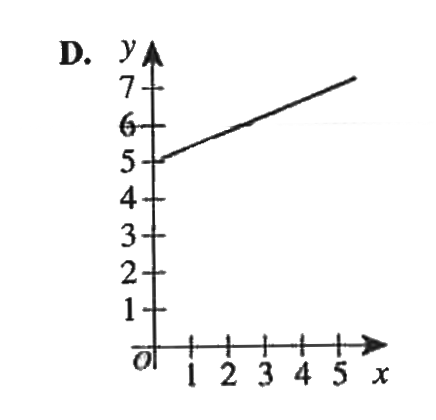
The correct Answer is:A
To solve the problem, we need to analyze the equation given and find the correct graph that represents the relationship between the depth of accumulated snow (y) and the elapsed time (x). The equation provided is:
2x−5y=−5
Step 1: Rearranging the Equation
We start by rearranging the equation to express y in terms of x:
1. Add 5y to both sides:
2x=5y−5
2. Add 5 to both sides:
2x+5=5y
3. Divide both sides by 5:
y=2x+55
Step 2: Finding the y-intercept
To find the y-intercept (where x = 0):
1. Substitute x = 0 into the equation:
y=2(0)+55=55=1
So, the y-intercept is (0, 1).
Step 3: Finding another point on the graph
Next, we can find another point by substituting a value for x. Let's choose x = 1:
1. Substitute x = 1 into the equation:
y=2(1)+55=2+55=75=1.4
So, another point is (1, 1.4).
Step 4: Finding another point on the graph
Now, let's substitute x = 2:
1. Substitute x = 2 into the equation:
y=2(2)+55=4+55=95=1.8
So, another point is (2, 1.8).
Step 5: Analyzing the Graph Options
Now we have the points (0, 1), (1, 1.4), and (2, 1.8). We need to check which graph option passes through these points.
1. Option A: Check if it passes through (0, 1), (1, 1.4), and (2, 1.8).
2. Option B: Check if it passes through (0, 1), (1, 1.4), and (2, 1.8).
3. Option C: This option passes through the origin (0, 0), which we already know is incorrect since we found (0, 1).
4. Option D: Check if it passes through (0, 5), which we know is incorrect.
After checking the graphs, we find that:
- Option A correctly passes through (0, 1), (1, 1.4), and (2, 1.8).
- Option B does not satisfy these points.
Conclusion
The correct graph that models the equation for positive values of x and y is Option A.
---
We start by rearranging the equation to express y in terms of x:
2x=5y−5
2x+5=5y
y=2x+55
To find the y-intercept (where x = 0):
y=2(0)+55=55=1
Next, we can find another point by substituting a value for x. Let's choose x = 1:
y=2(1)+55=2+55=75=1.4
Now, let's substitute x = 2:
y=2(2)+55=4+55=95=1.8
Now we have the points (0, 1), (1, 1.4), and (2, 1.8). We need to check which graph option passes through these points.
2. Option B: Check if it passes through (0, 1), (1, 1.4), and (2, 1.8).
3. Option C: This option passes through the origin (0, 0), which we already know is incorrect since we found (0, 1).
4. Option D: Check if it passes through (0, 5), which we know is incorrect.
- Option B does not satisfy these points.
The correct graph that models the equation for positive values of x and y is Option A.
Topper's Solved these Questions
Similar Questions
Knowledge Check
The graph in the standard (x,y) coordinate plane below is the graph of one of the following functions, which one?
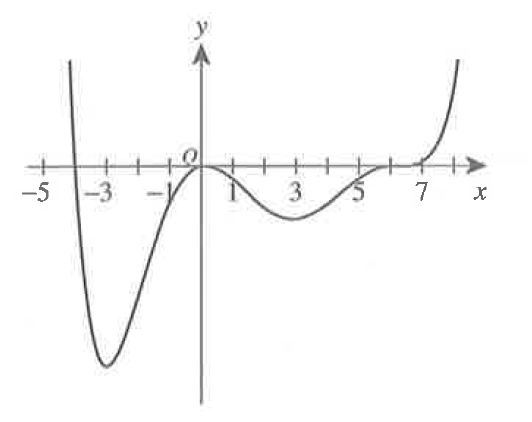 Ag(x)=x(x−6)(x+4)Bh(x)=x2(x+6)(x−4)Cn(x)=x2(x+6)3(x−4)Dp(x)=x2(x−6)3(x+4)
Which of the following is the equation of a circle in the standard (x,y) coordinate plane ?
A(x-3)+(y+6)=100By=x2+25Cx2=y2+25Dx2=36−y2In the standard (x,y) coordinate plane, what is the slope of the line 3x+8y=5?
A−3B−38C35D3
The line with equation 5y-4x=20 does NOT lie in which quadrant(s) of the standard (x,y) coordinate plane below ?
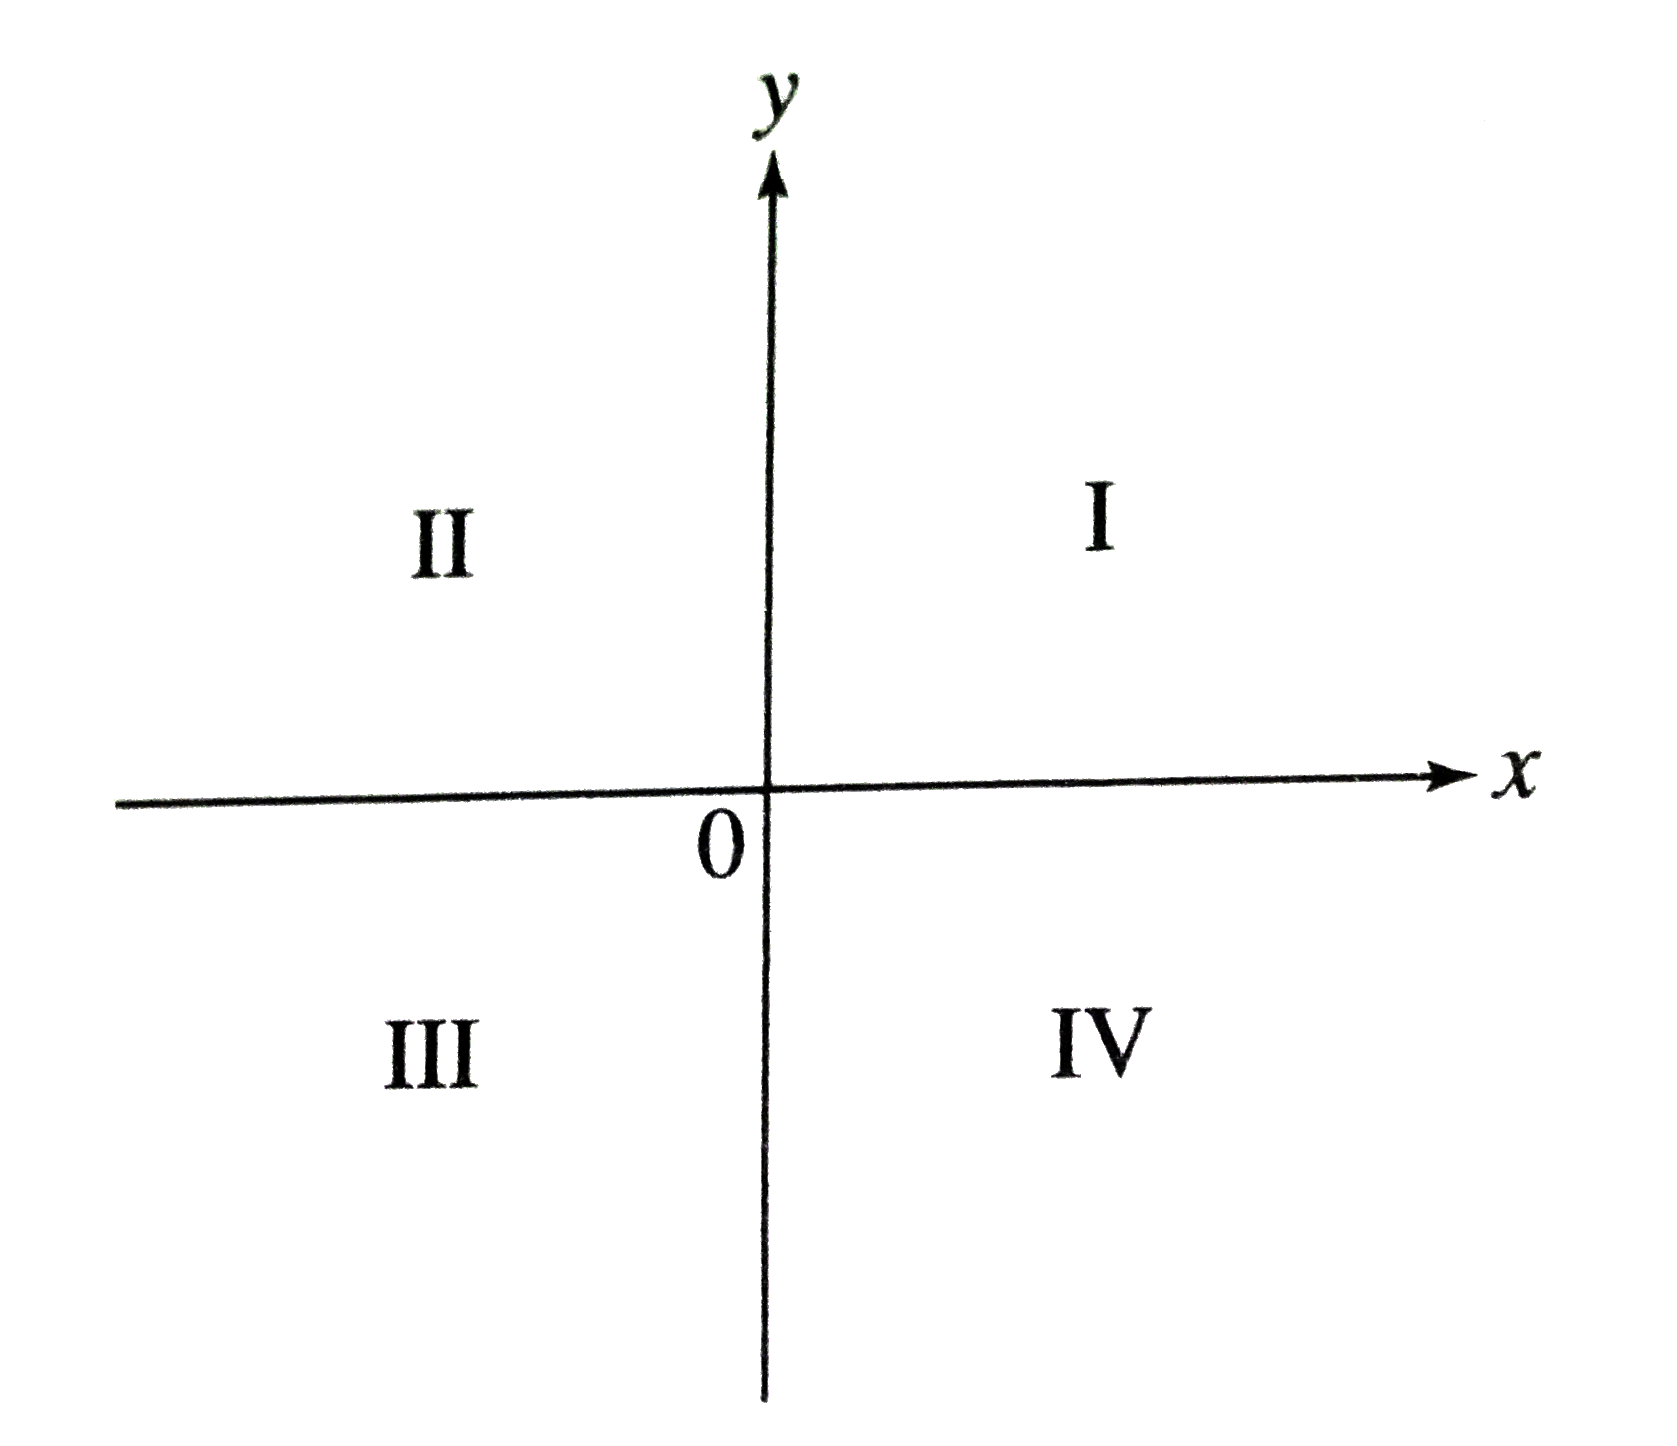
View SolutionIF (a,-3) is on the graph of the equation x-4y=14 in the standed (x,y) coordinate plane , then a= ?
View SolutionWhich of the following ordered pairs in the standard (x,y) coordinate plane satisfies the system of inequalities below?
x>2
y>0
x+y<5
View SolutionThe graph of y=3−5sin(x−π) is shown in the standard (x,y) coordinate plane below. What is the range of y?
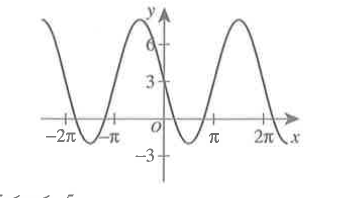
View SolutionWhich of the following is the graph of the equation y = 2x − 5 in the xy-plane?
View Solution


