The use of calculator is not permited.
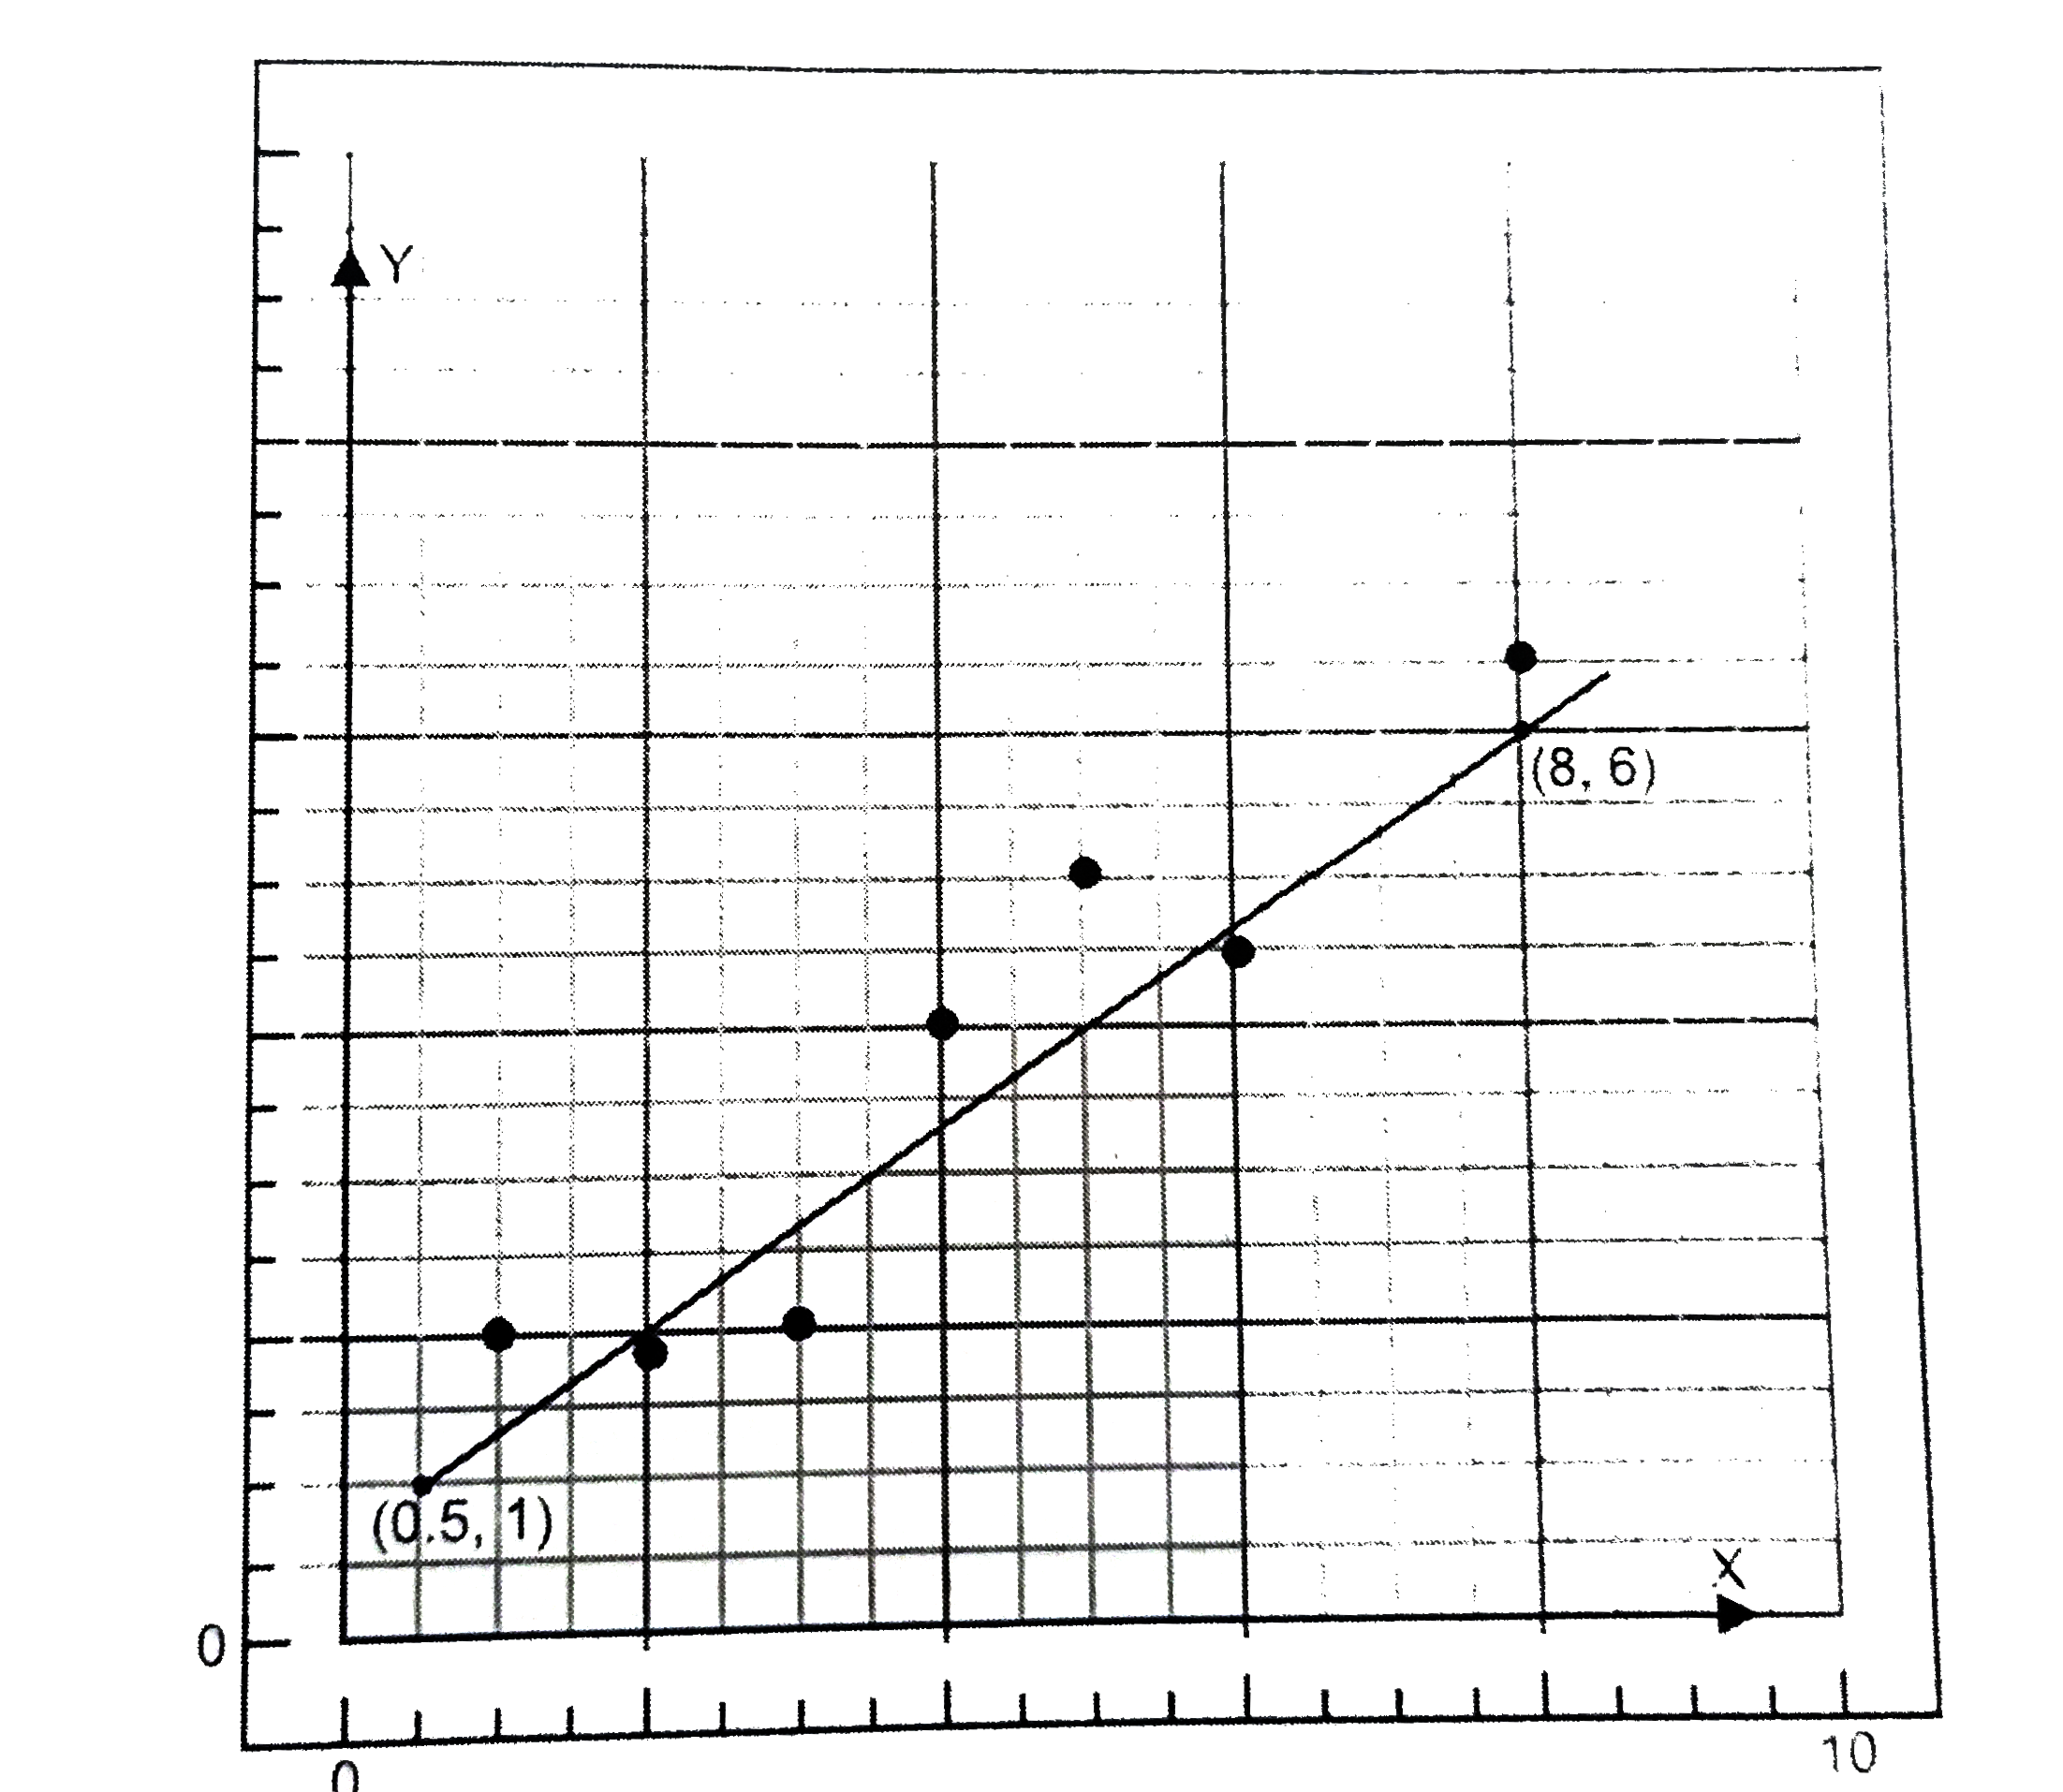
In the graph above ,a number of points are shown, and the line of best fit is also shown. What is the sum of the expected values of the Y coordinates of the points having X values 7 and 9?
The correct Answer is:12
Step by step video, text & image solution for The use of calculator is not permited. In the graph above ,a number of points are shown, and the line of best fit is also shown. What is the sum of the expected values of the Y coordinates of the points having X values 7 and 9? by Maths experts to help you in doubts & scoring excellent marks in Class 12 exams.
Updated on:21/07/2023Topper's Solved these Questions
Similar Questions
Knowledge Check
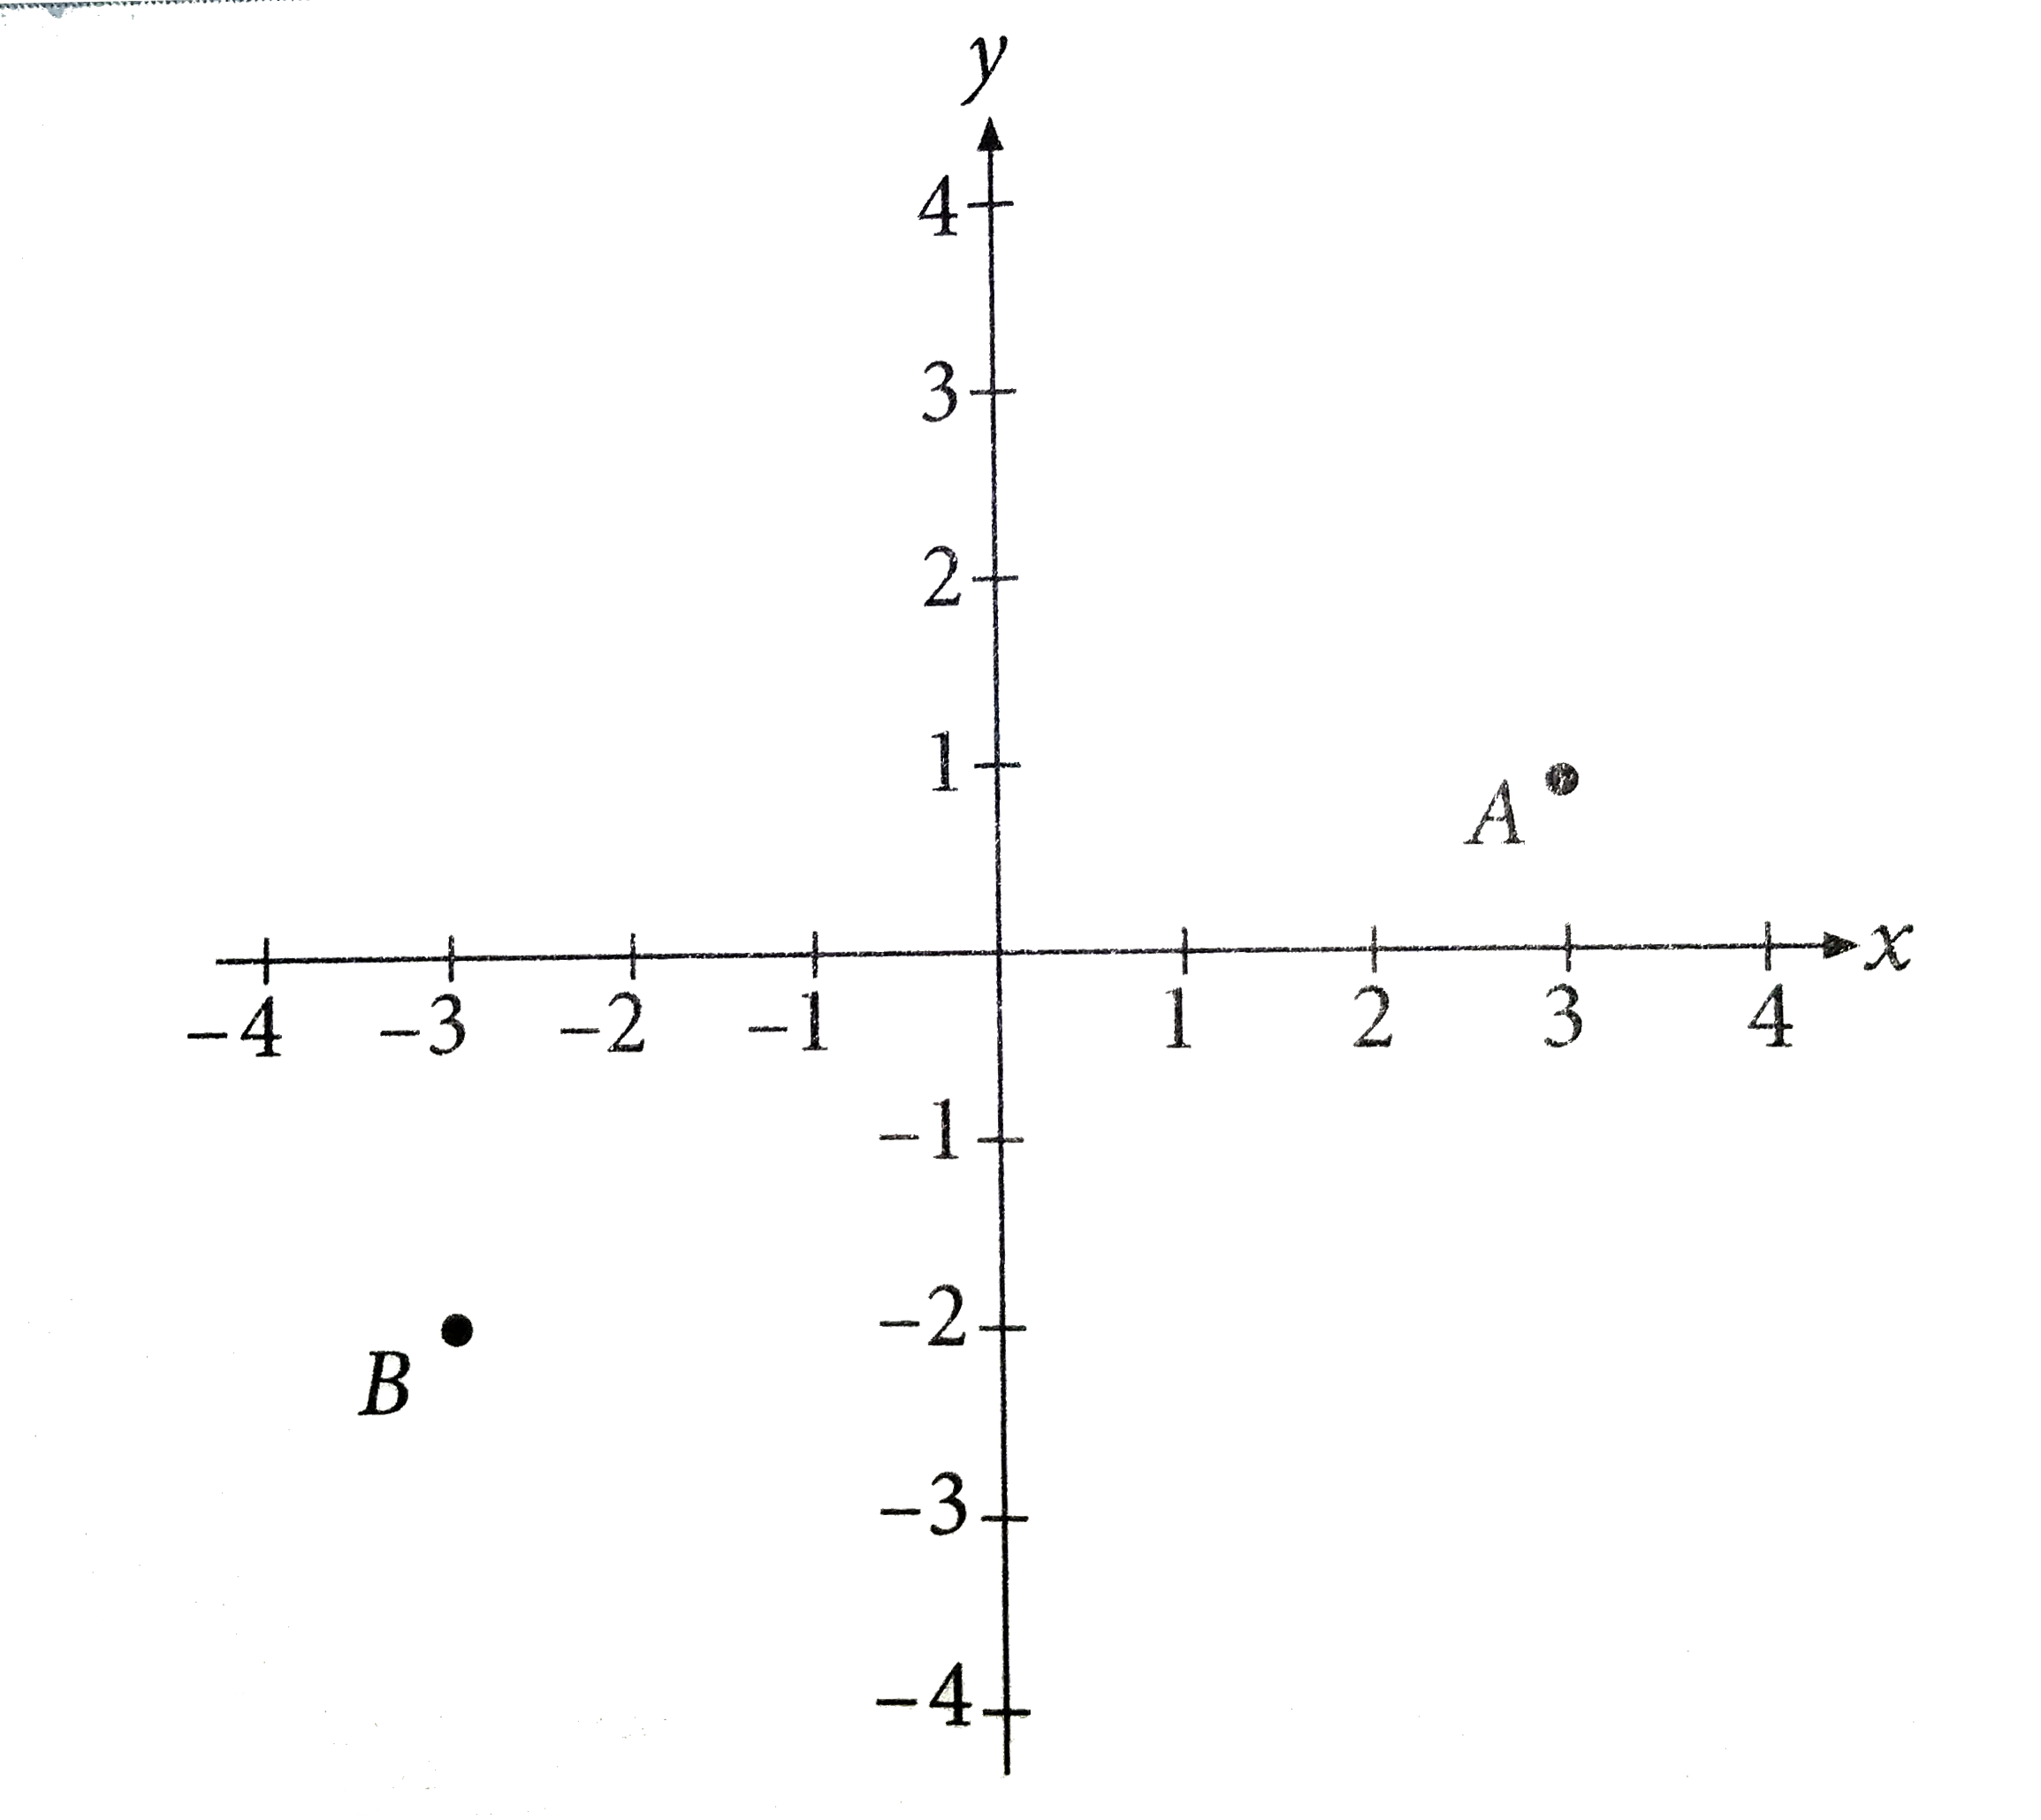
In the xy-plane above, what is the value of the x-coordinates of Point A minus the y-coordinates of Point B?A−2B−1C3D5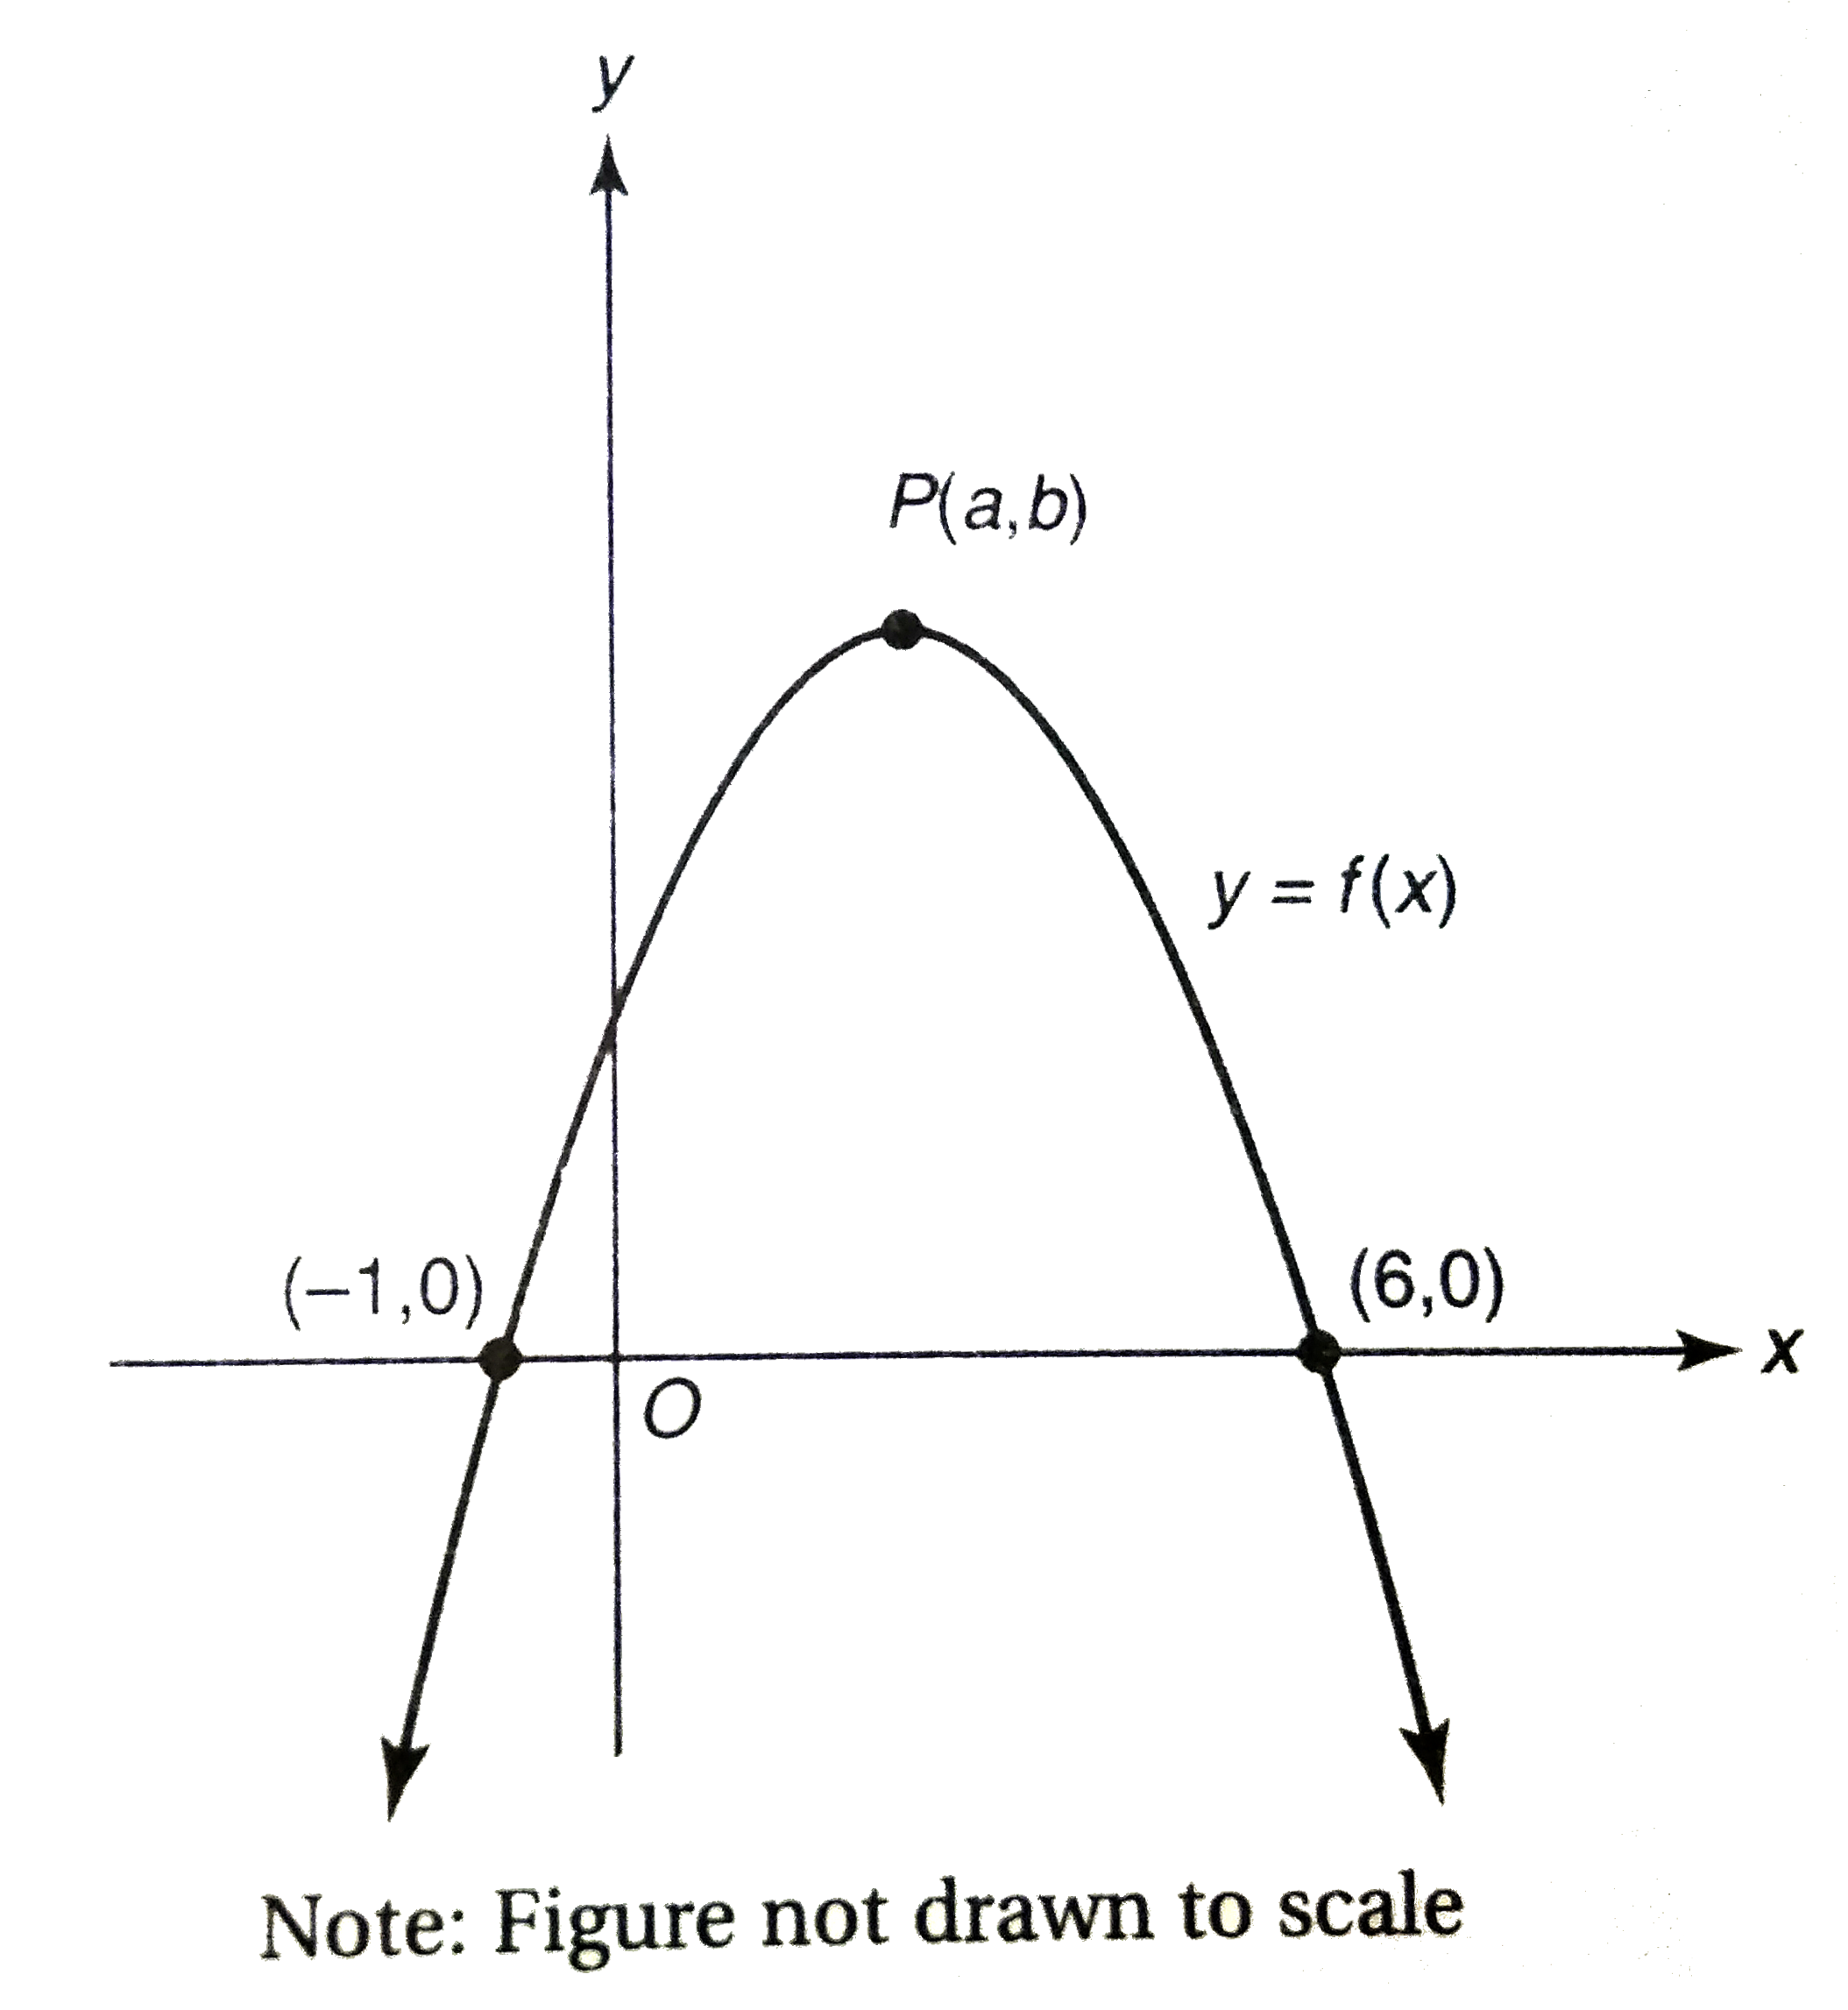
The graph of a quadratic function f is shown in the above figure. If f(x)≤b for all values of x, which of the following could be the coordinates of point P?A(1.5,2)B(2.25.3.5)C(2.5,4)D(2.75,5)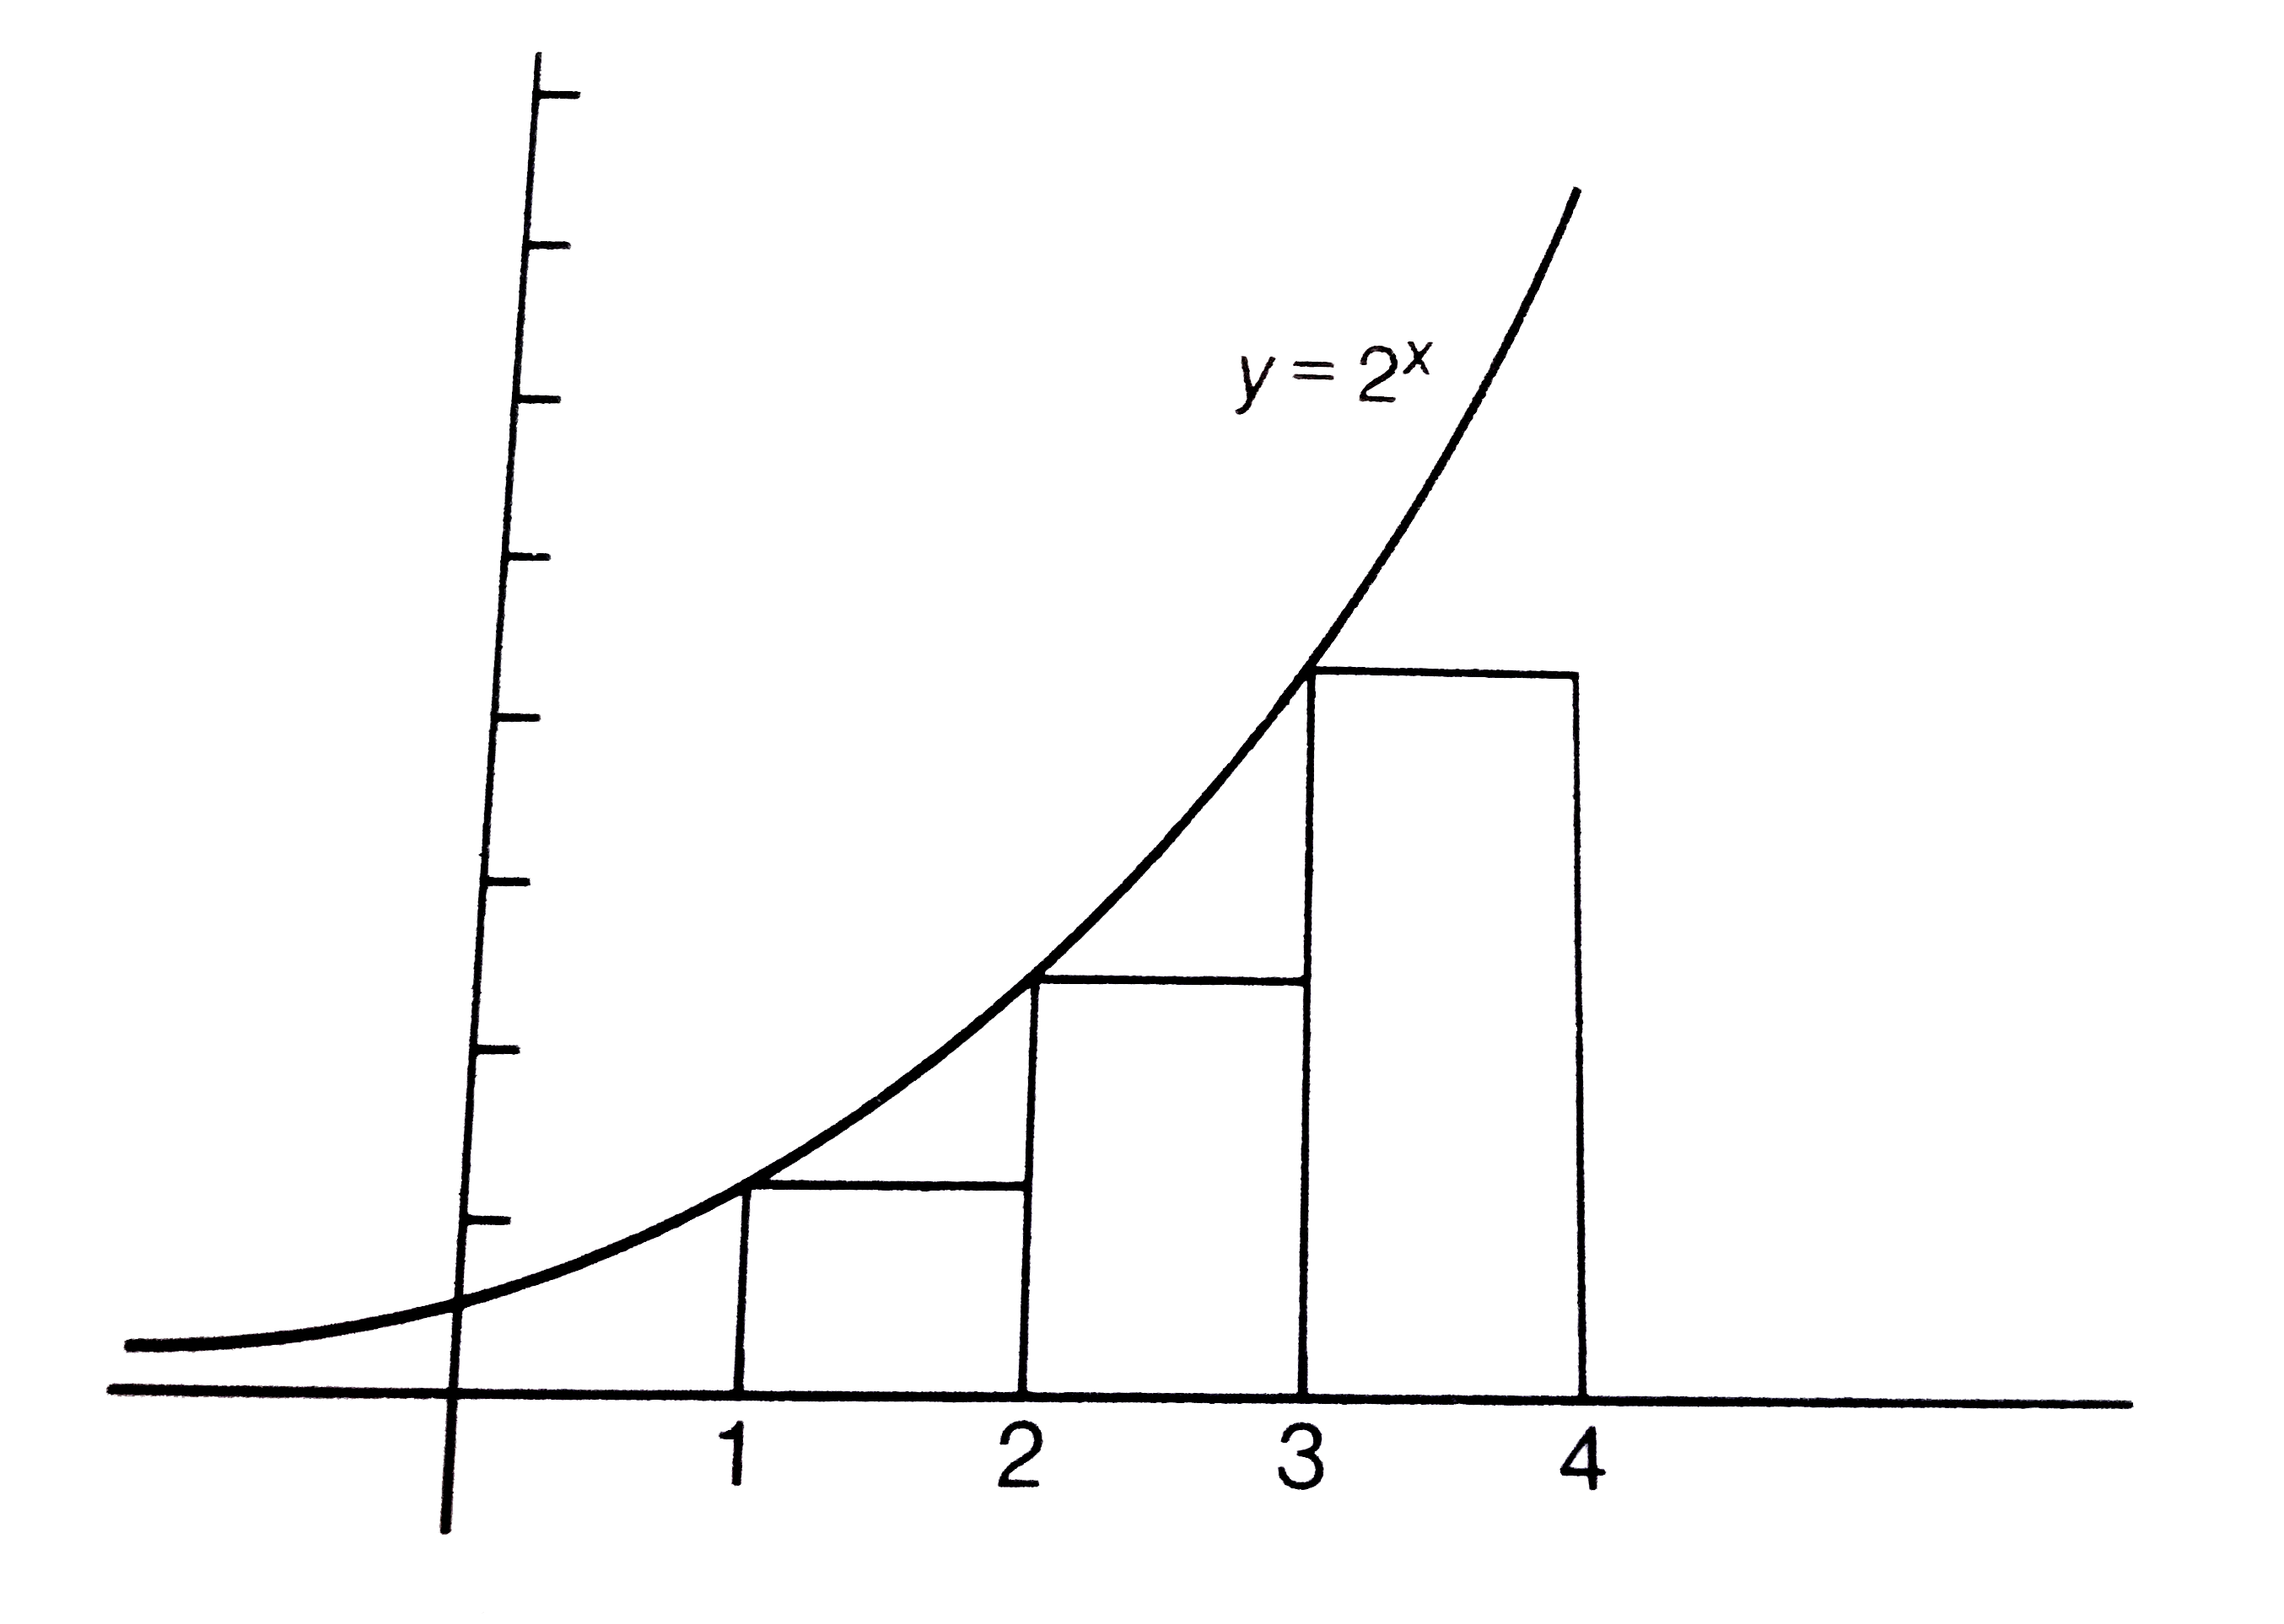
The figure above shows a portion of the graph of y=2x. What is the sum of the areas of the three inscribed rectangles shown?A14B28C128D256
Draw a graph of the line x−2y=3. From the graph, find the coordinates of the point when x=−5 (ii) y=0
View SolutionDraw the graphs of y=x and y=−x in the same graph. Also, find the coordinates of the point where the two lines intersect.
View SolutionDraw the graphs of y=x and y=−x in the same graph. Also, find the coordinates of the point where the two lines intersect.
View Solution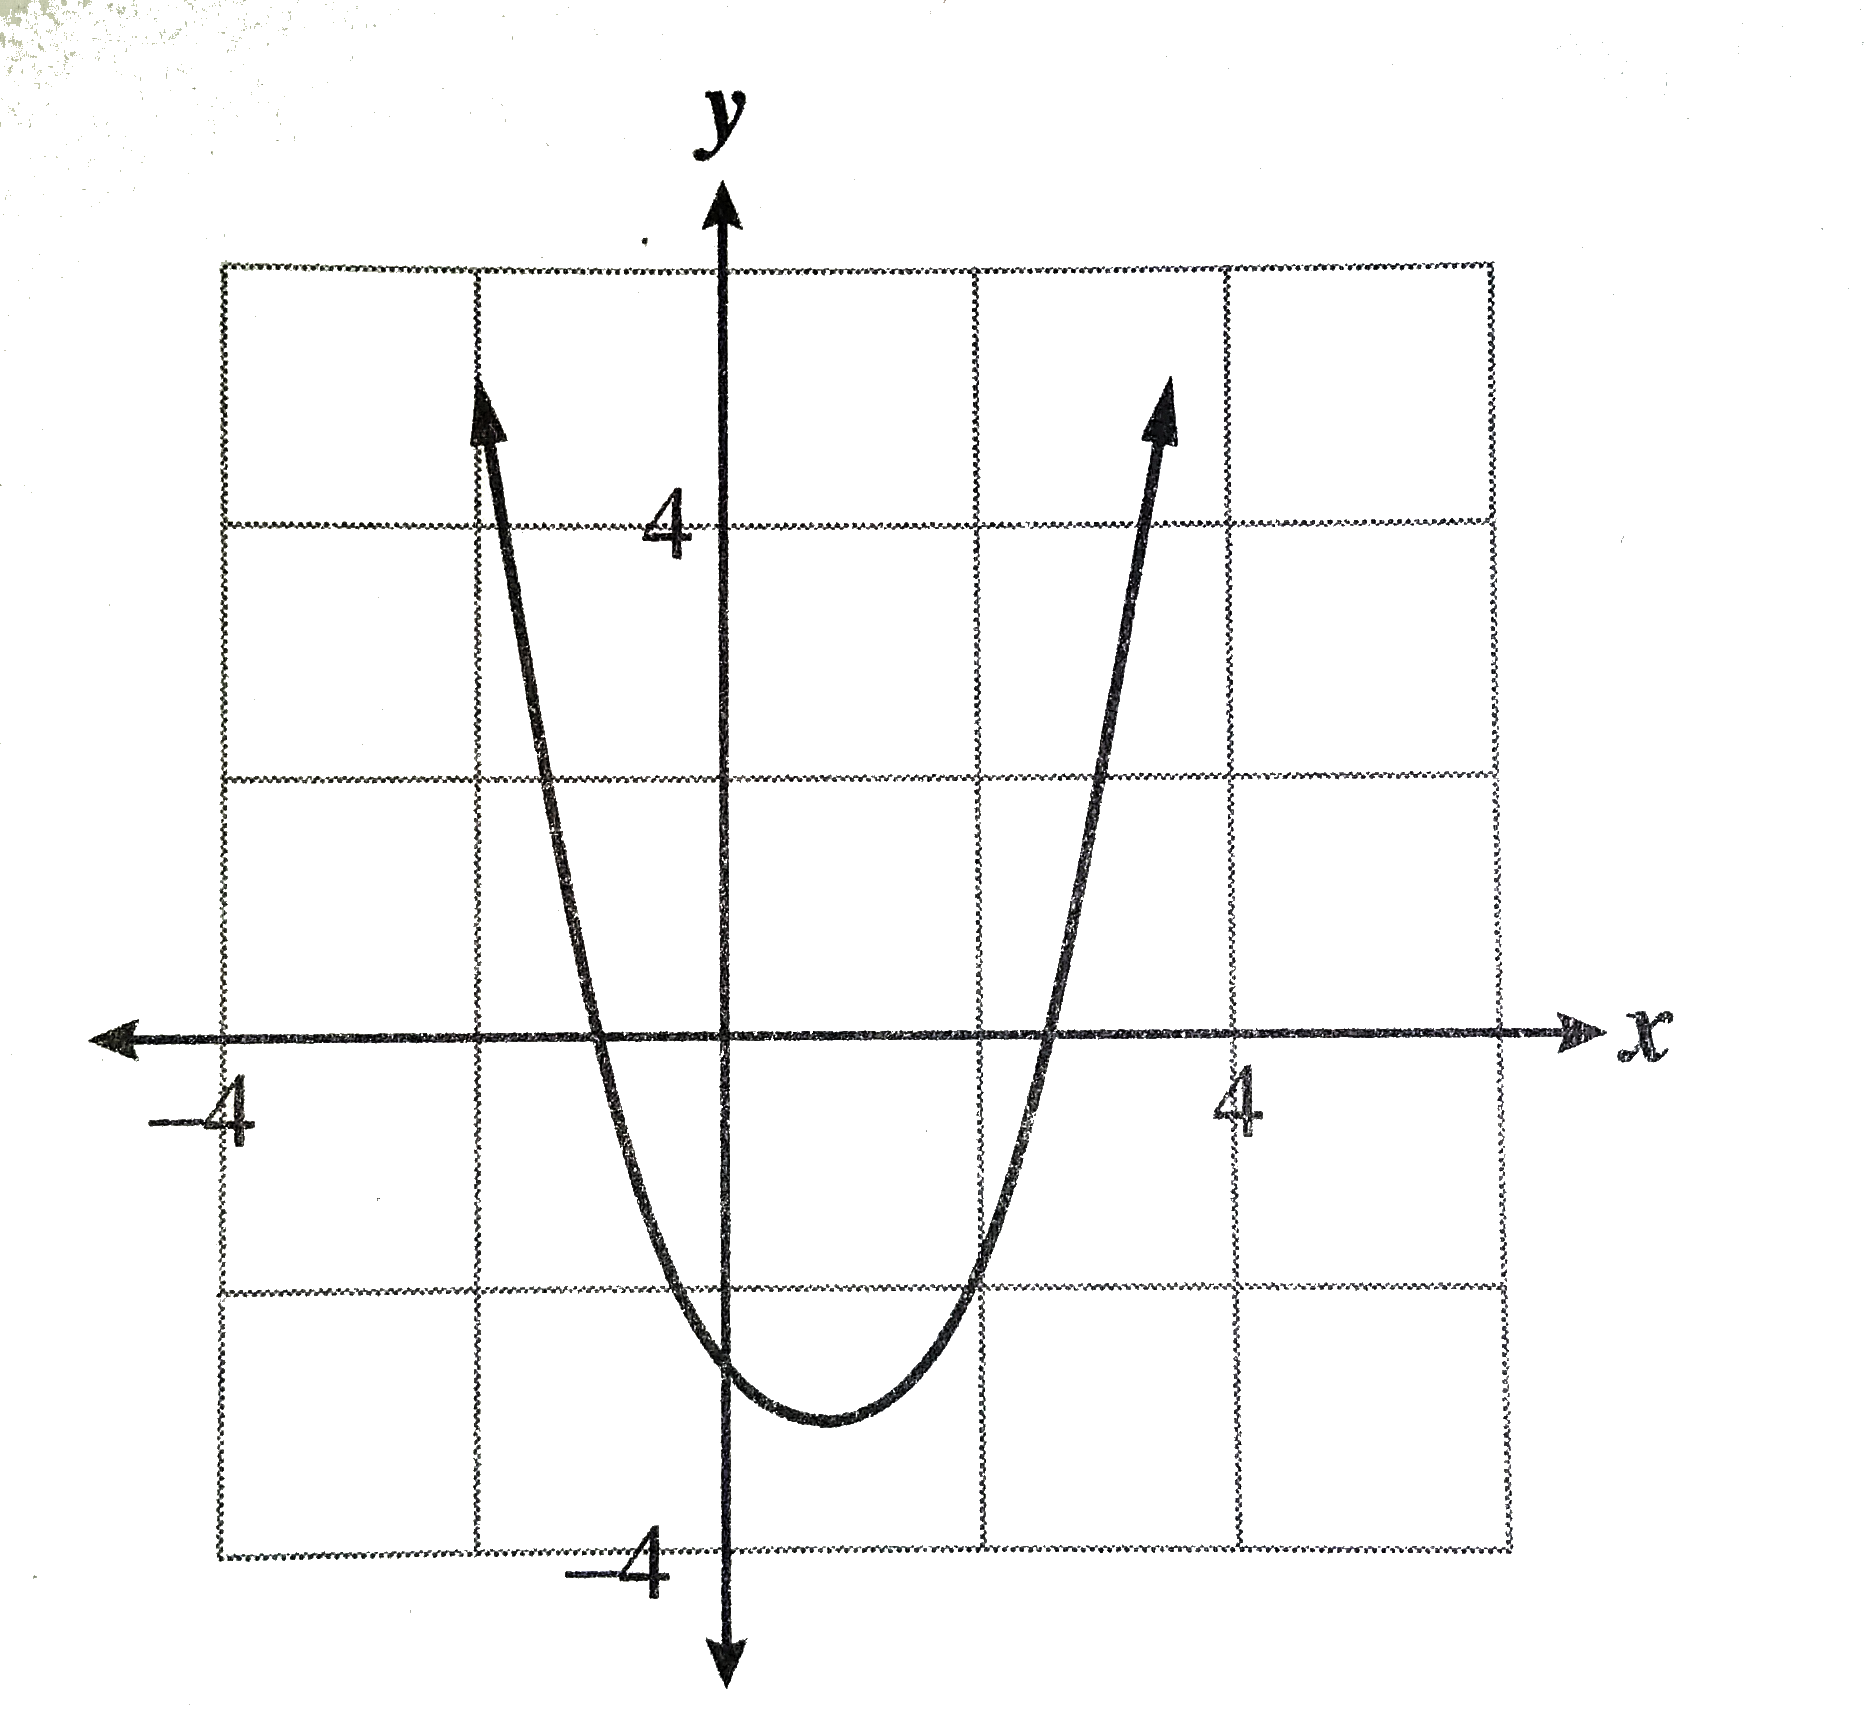
Each of the following quadratic equations represents the graph shown above. Which equation reveals the exact values of the x-intercepts of the graph?
View Solution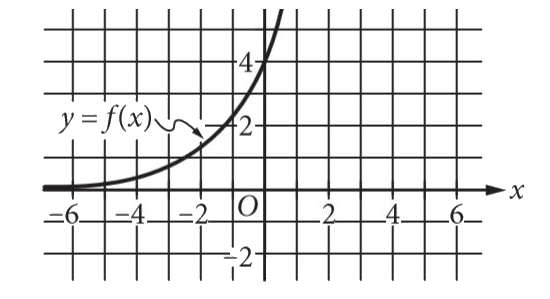
The graph of y = f (x) is shown in the xy -plane. What is the value of f (0) ?
View Solution


