
The frequency chart above shows number of absences for employees for a small business in a given year. The total number of employees was 43 . The following year , the employees are the same , and two employees are picked at random for an interview . What is the probability that both employees were absent between 11 and 14 times the previous year ?
243
1543
543
0.116
The correct Answer is:C, D
Step by step video, text & image solution for The frequency chart above shows number of absences for employees for a small business in a given year. The total number of employees was 43 . The following year , the employees are the same , and two employees are picked at random for an interview . What is the probability that both employees were absent between 11 and 14 times the previous year ? by Maths experts to help you in doubts & scoring excellent marks in Class 12 exams.
Similar Questions

The frequency chart shows test scores for a certain class. The total number of student is 31. If a student in the class was picked at random , what is the probability that the student's score was below 71 ?View SolutionFrom the employees of a company, 5 persons are selected to represent them in the managing committee of the company. Particulars of five persons are as follows:
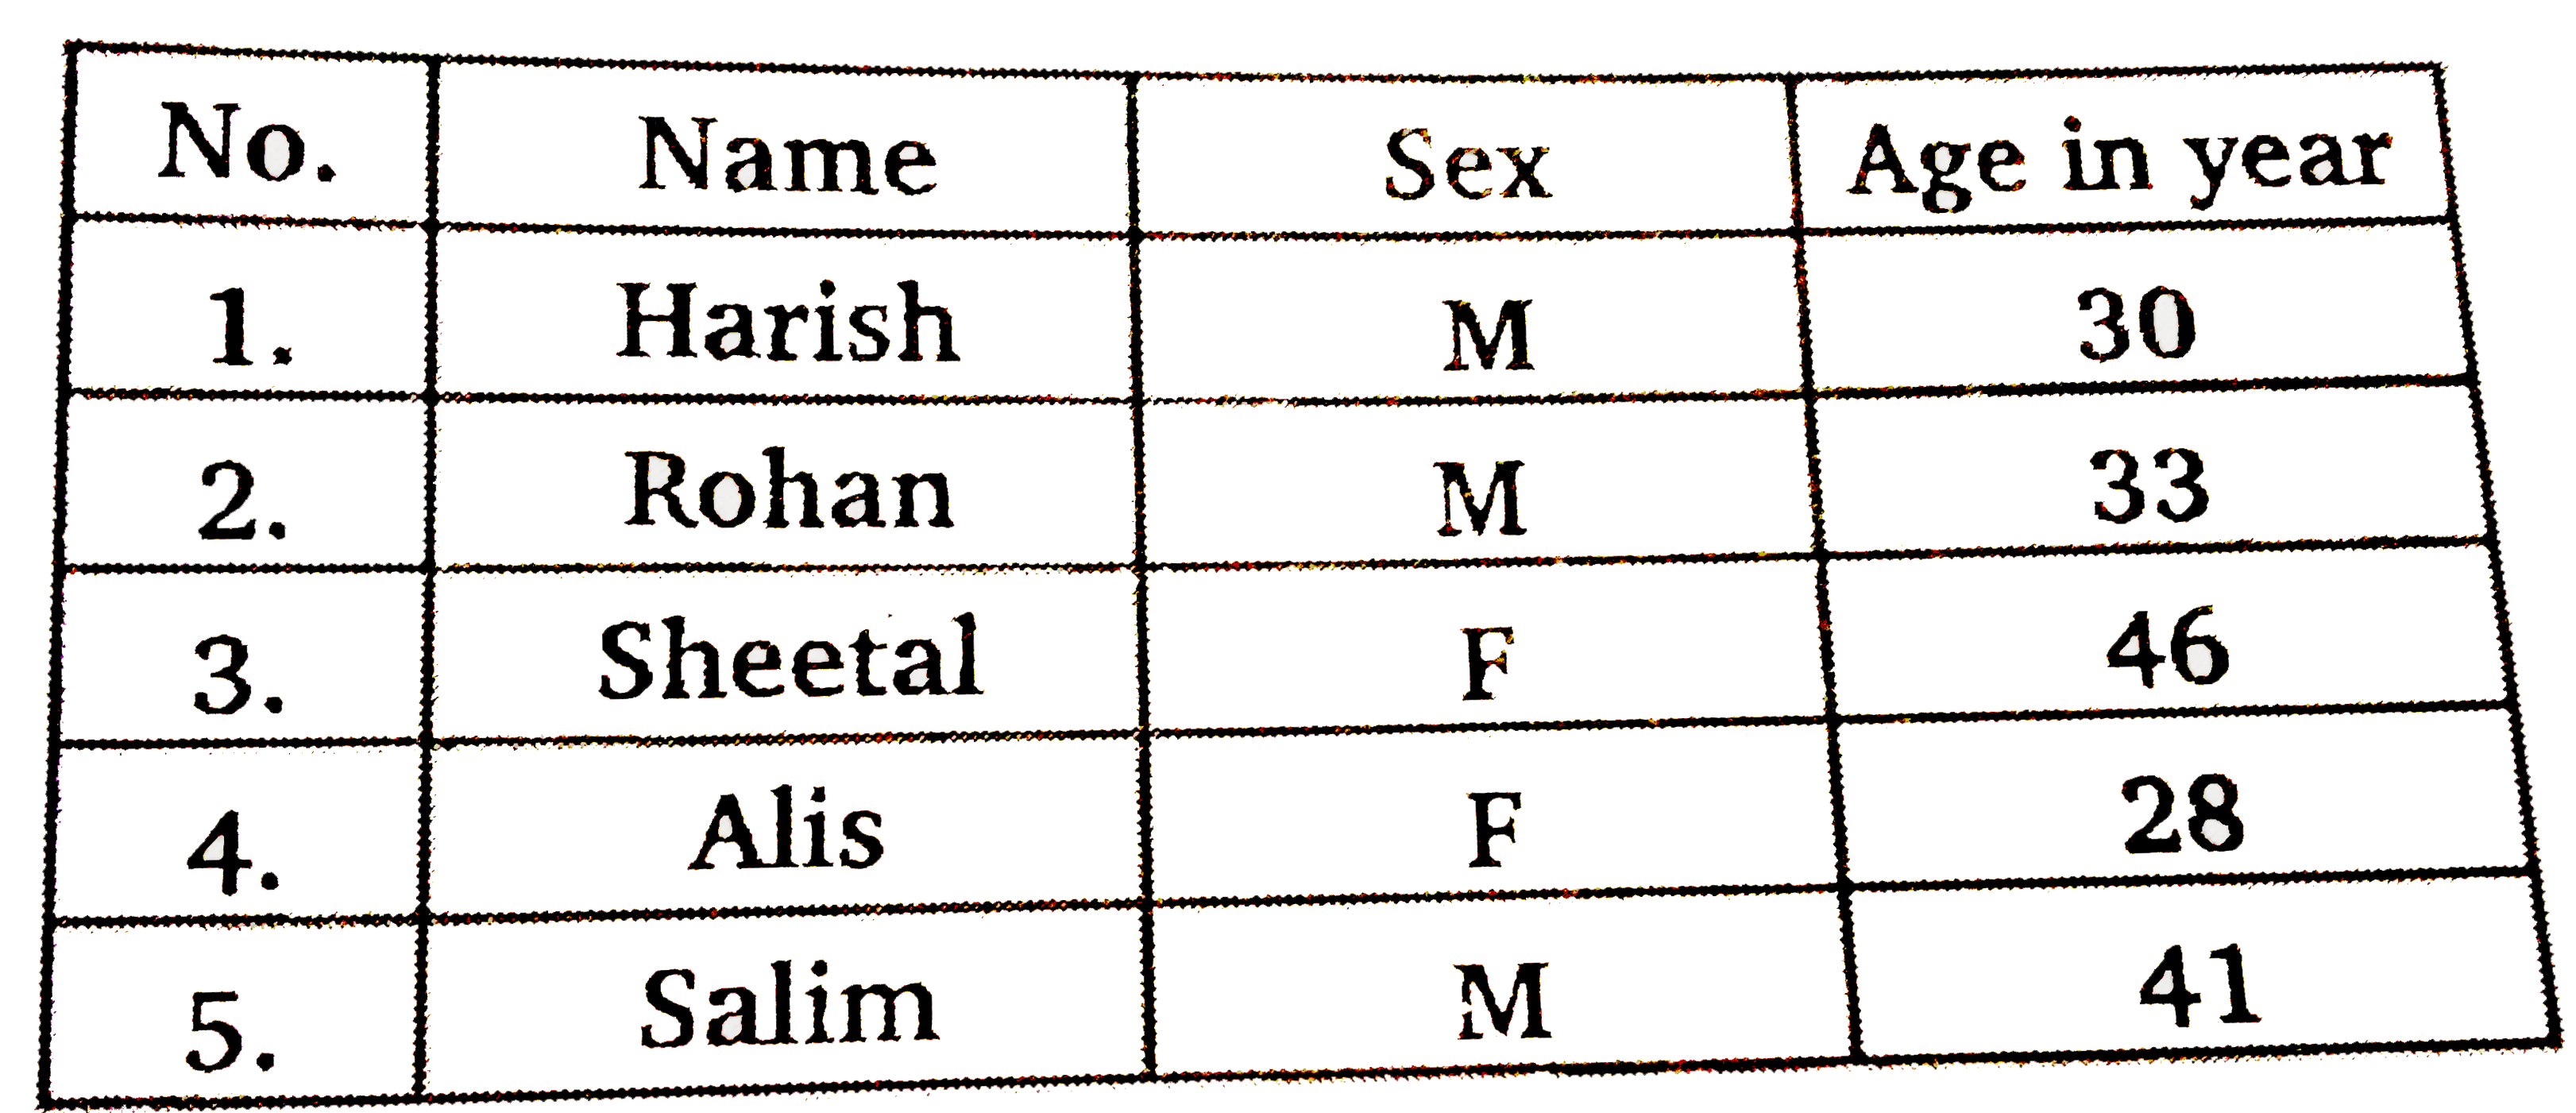
A person is selected at random from this group to act as a spokeperson. What is the probability that the spokesperson wil be either male or over 35 years?View Solution
Knowledge Check
- Question 1 - Select One
The retirement plans for a company allows employees to invest in 10 different mutual funds. Six of the fund grew by at least 10% over the last year. If Sam randomly selected 4 of the 10 funds, what is the probability that 3 of Sam's 4 funds grew by at least 10% over last year?
A.6C3.10C4B.6C3⋅.4C1.10C4C.6C3⋅.4C1.10P4D.6P3⋅.4P1.10C4 - Question 2 - Select One
Number of Registered Voters
in the United States in 2012, in Thousands
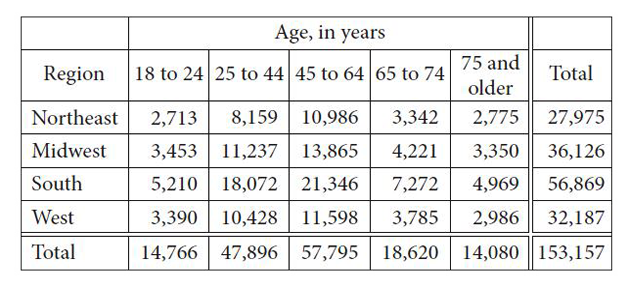
The table above shows the number of registered voters in 2012, in thousands, in four geographic regions and five age groups. Based on the table, if a registered voter who was 18 to 44 years old in 2012 is chosen at random, which of the following is closest to the probability that the registered voter was from the Midwest region?A0.1B0.25C0.4D0.75 - Question 3 - Select One
The chart below shows data about the number of employees at Cuda Cola,a popular beverage company.

Assuming the employee total grows at the same rate each year, and male and female percentages continue to decrease and increase by 5%, respectively, approximately how many male employees will work at Cuda Cola in 2015?A1515B1398C1282D1165
The following graph shows the breakup of the type of employees of company Z form 1997 - 2000, Managerial , Staff, Unskilled and Temporay .
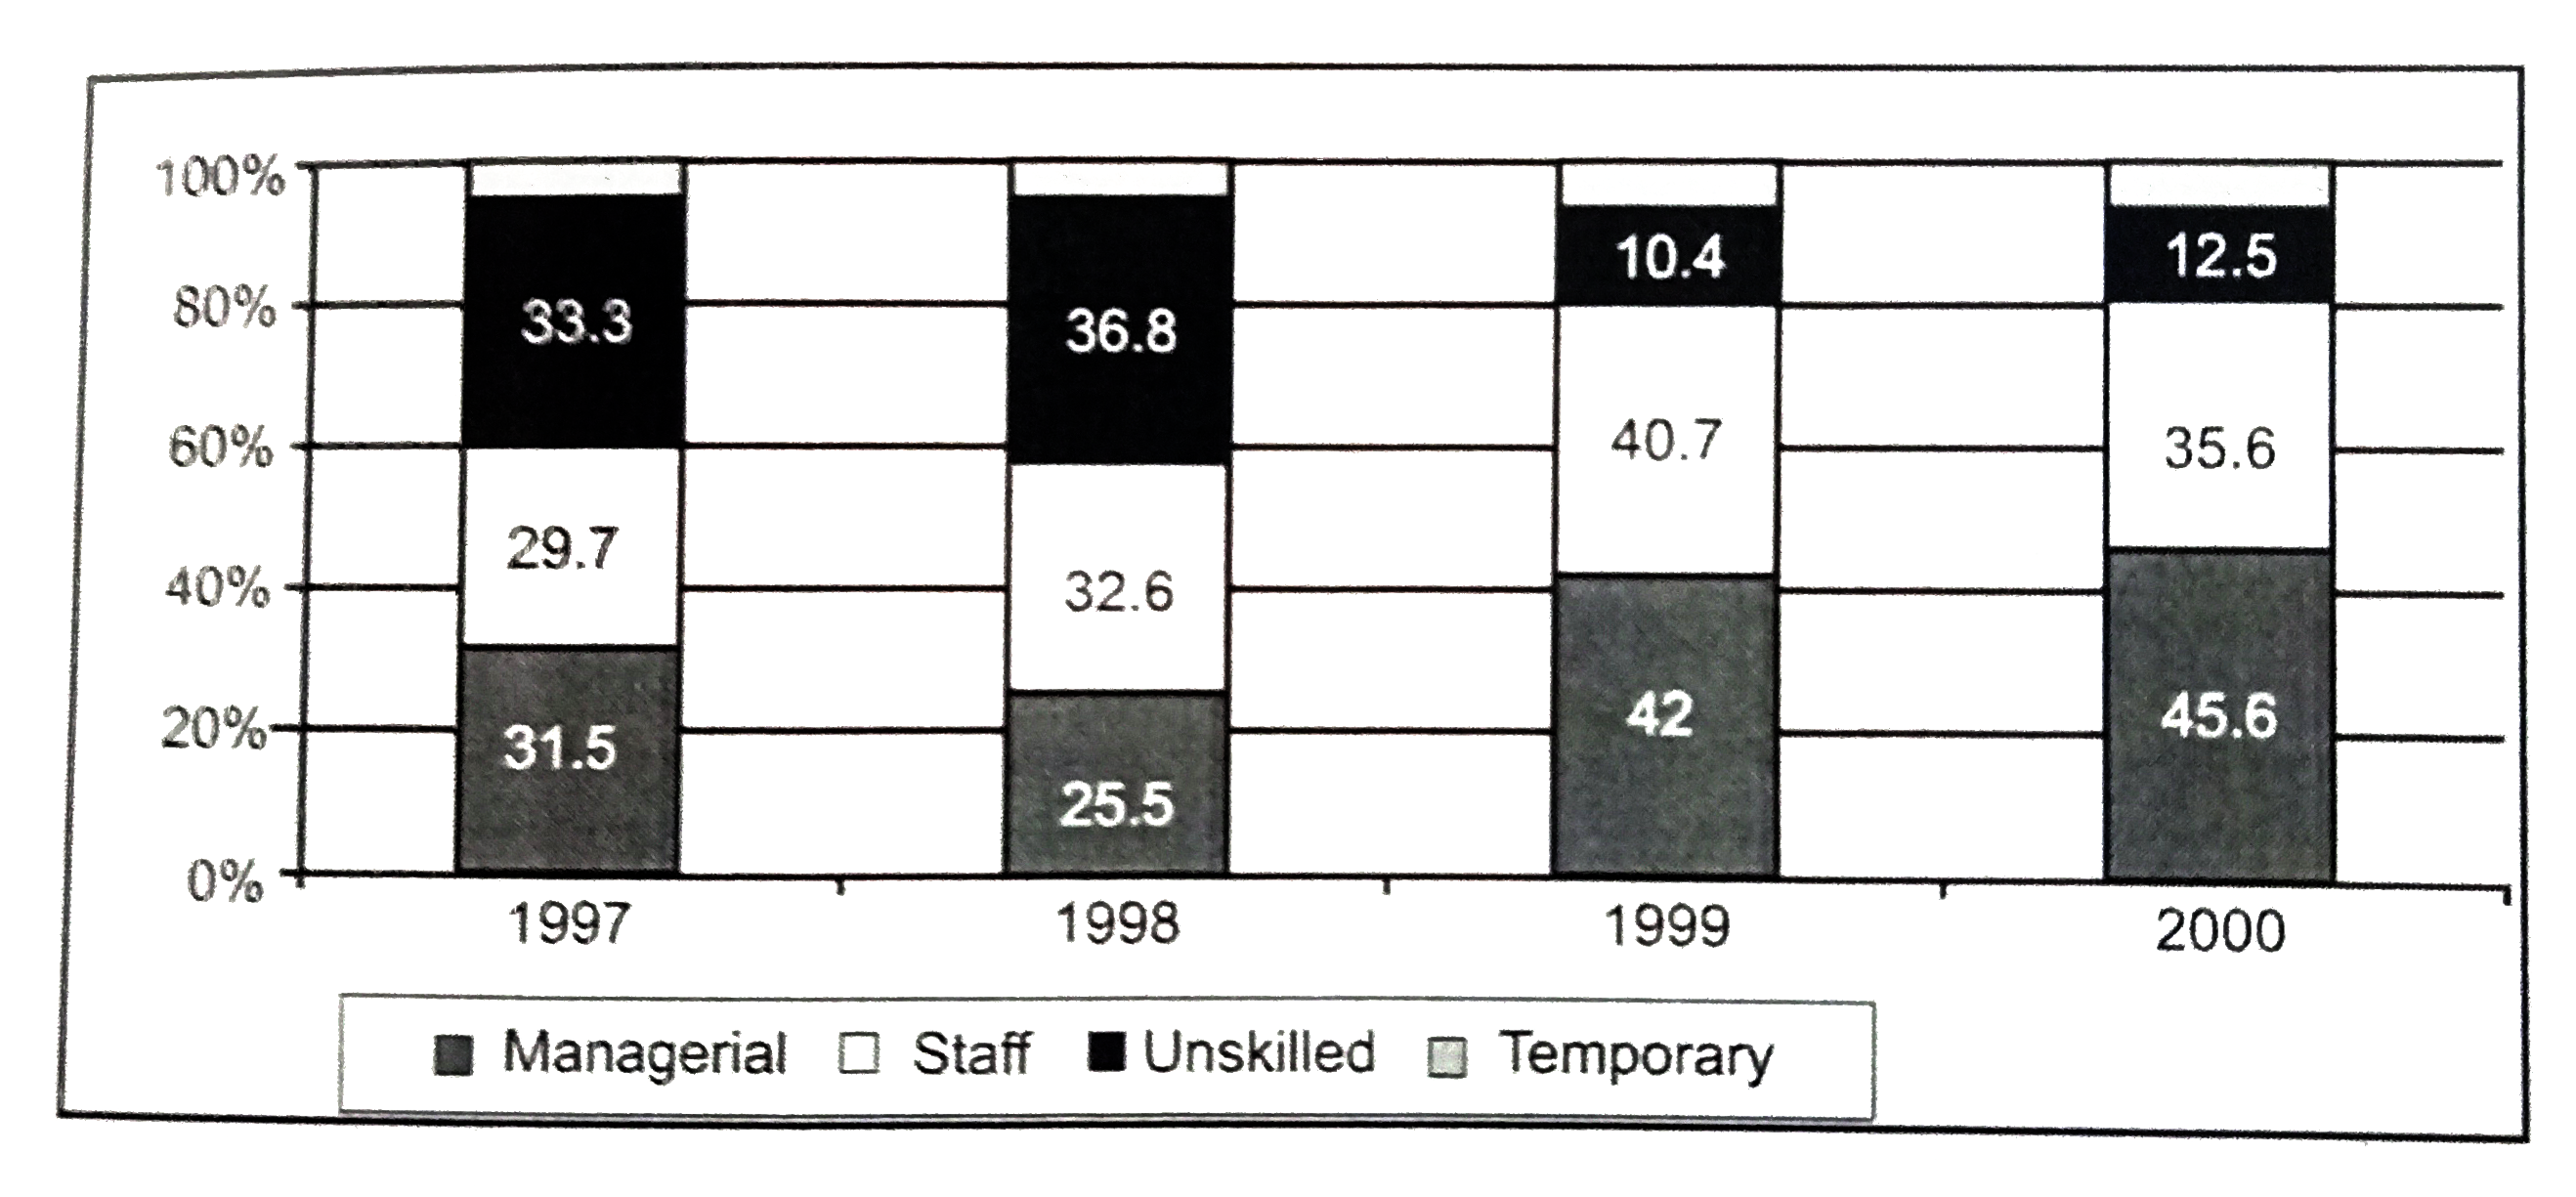
If the total number of employees remained the same throughout, what is the approxmiate percent increase in the number of staff employees between 1997 and 1998 ?View SolutionFrom the employees of a company 5 persons are elected to represent them n the managing committee of the company. Particulars of the five persons are as follows: S. No. Person Age (in years) 1 2 3 4 5 Male Male Female Female Male 30 33 46 28 41 A person is selected at random from this group to act as a spokesperson. What is the probability that the spokesperson will be either male or over 35 years?
View SolutionThe following graph shows the breakup of the type of employees of company Z form 1997 - 2000, Managerial , Staff, Unskilled and Temporay .
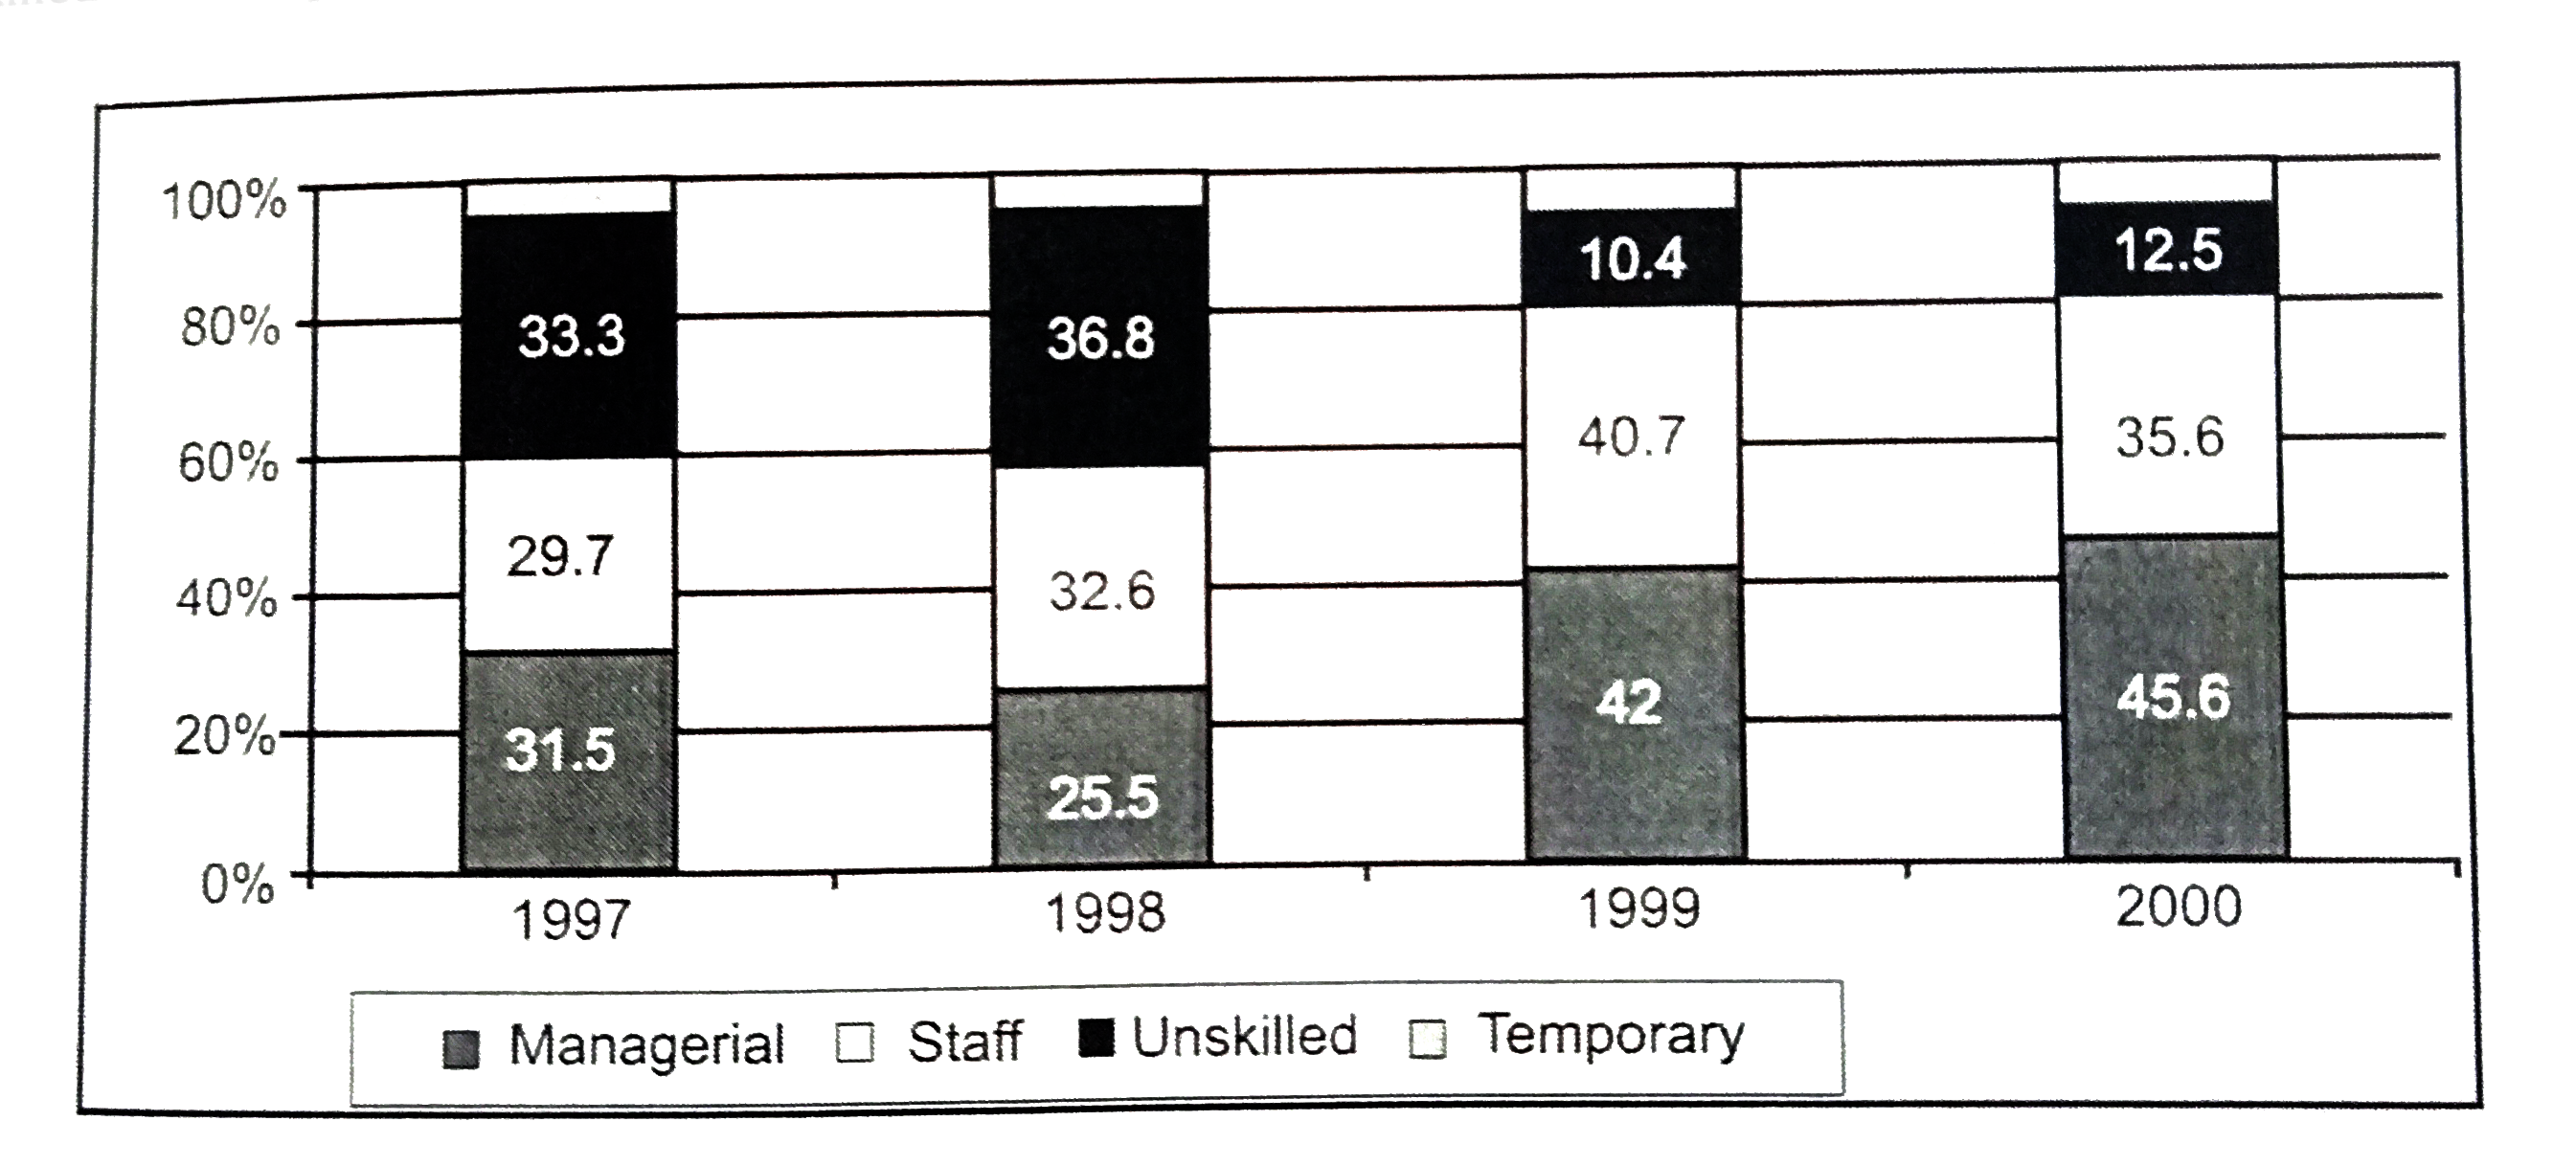
If the total strength of all employess in 1997 was 5000, and there was a 20% increase in total strength for every year from 1997,what is the number of mangerial empolyees in 1999 ?View SolutionA coffee distributes randomly polled 200 employees from each of two companies and asked each employee how many cups of coffee he or she drinks per day. The data is shown in the table below.

The are 4,000 employees at Company X and 3,000 employee at Company Y.
Q. What is the difference between the expected total number of employees who drink 1 cup of coffee at Company X and the expected total number of employees who drink 1 cup of coffee at Company Y?View SolutionA coffee distributes randomly polled 200 employees from each of two companies and asked each employee how many cups of coffee he or she drinks per day. The data is shown in the table below.
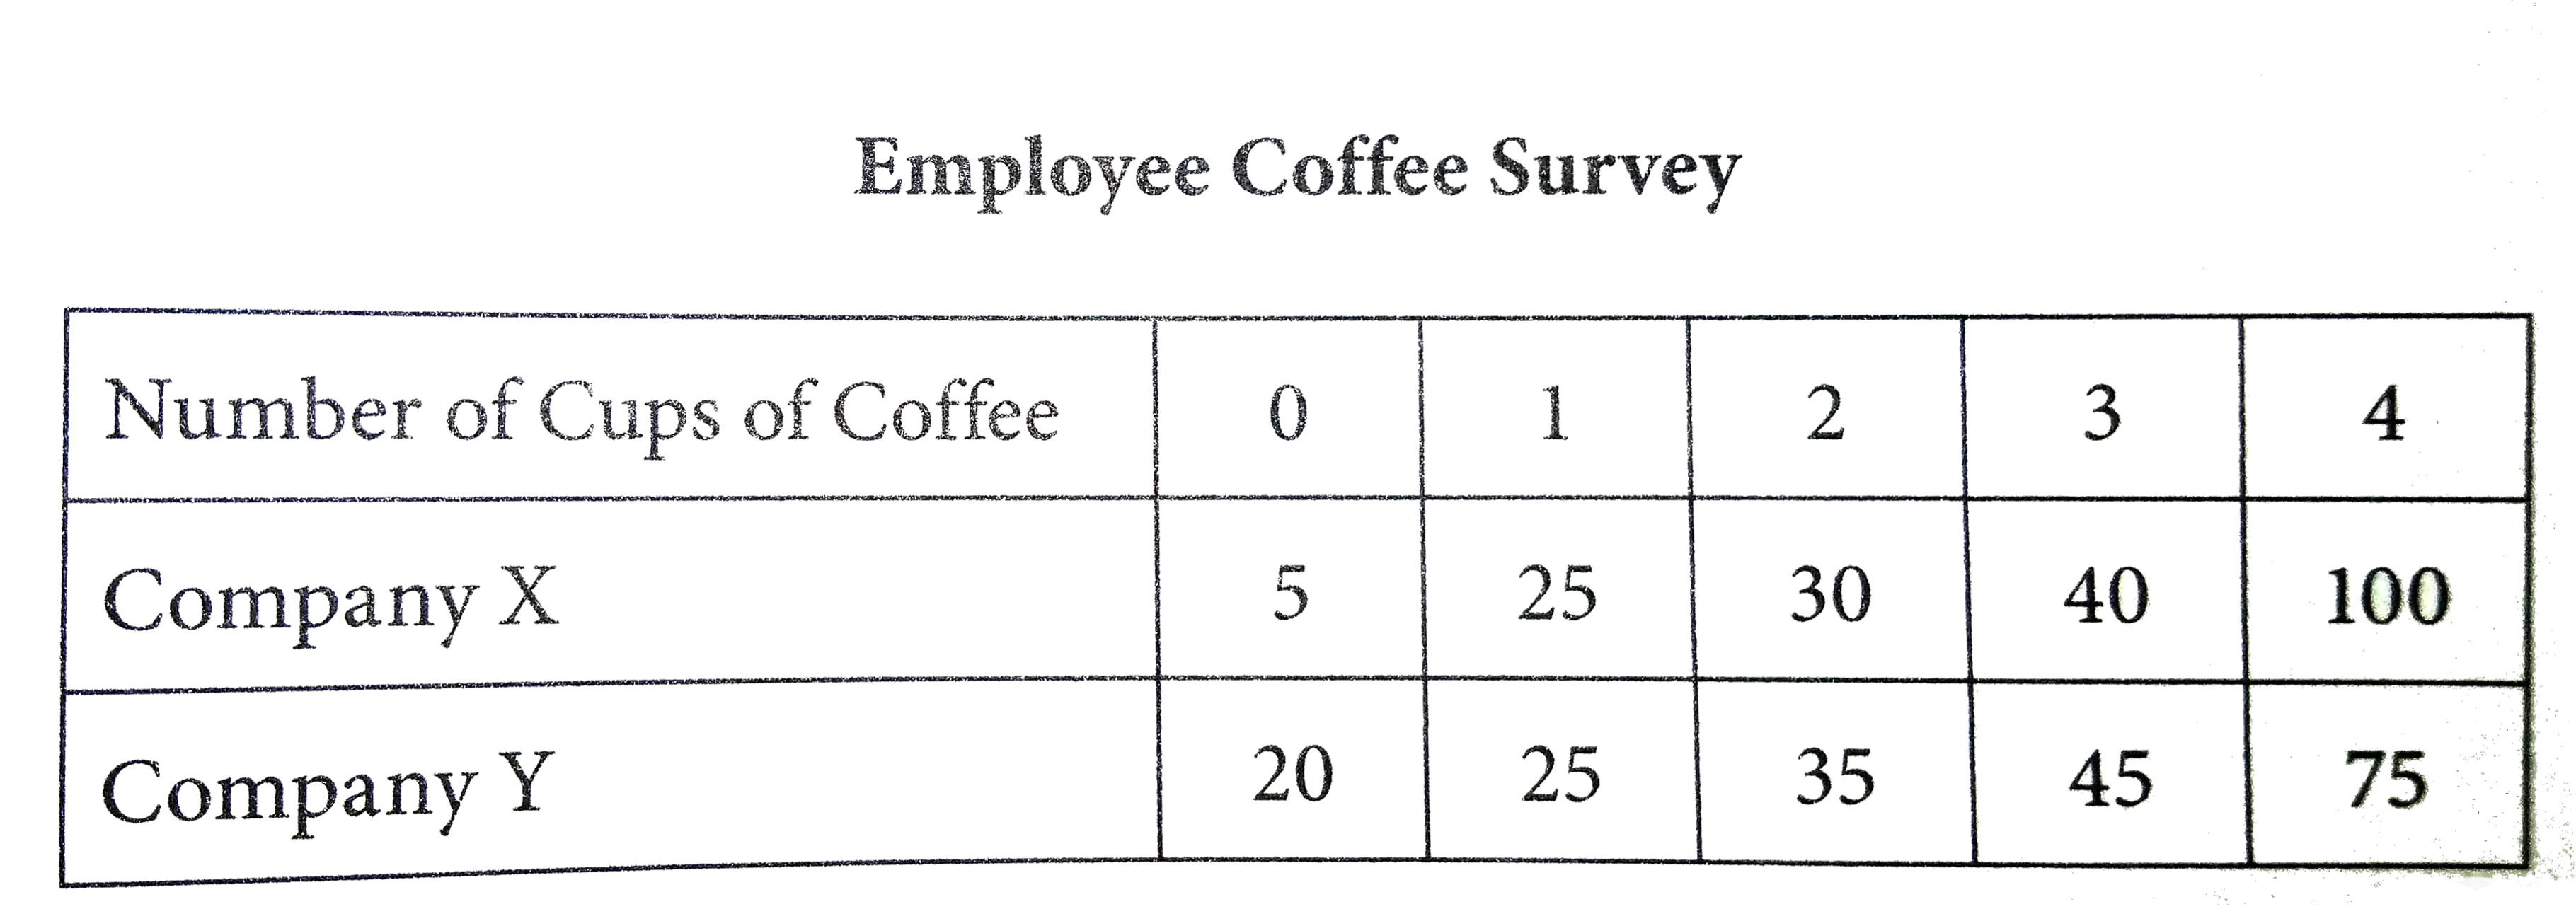
The are 4,000 employees at Company X and 3,000 employee at Company Y.
Q. Of the employees polled at Company X, approximately what is the average number of cups of coffee consumed per employee on a given day?View Solution

