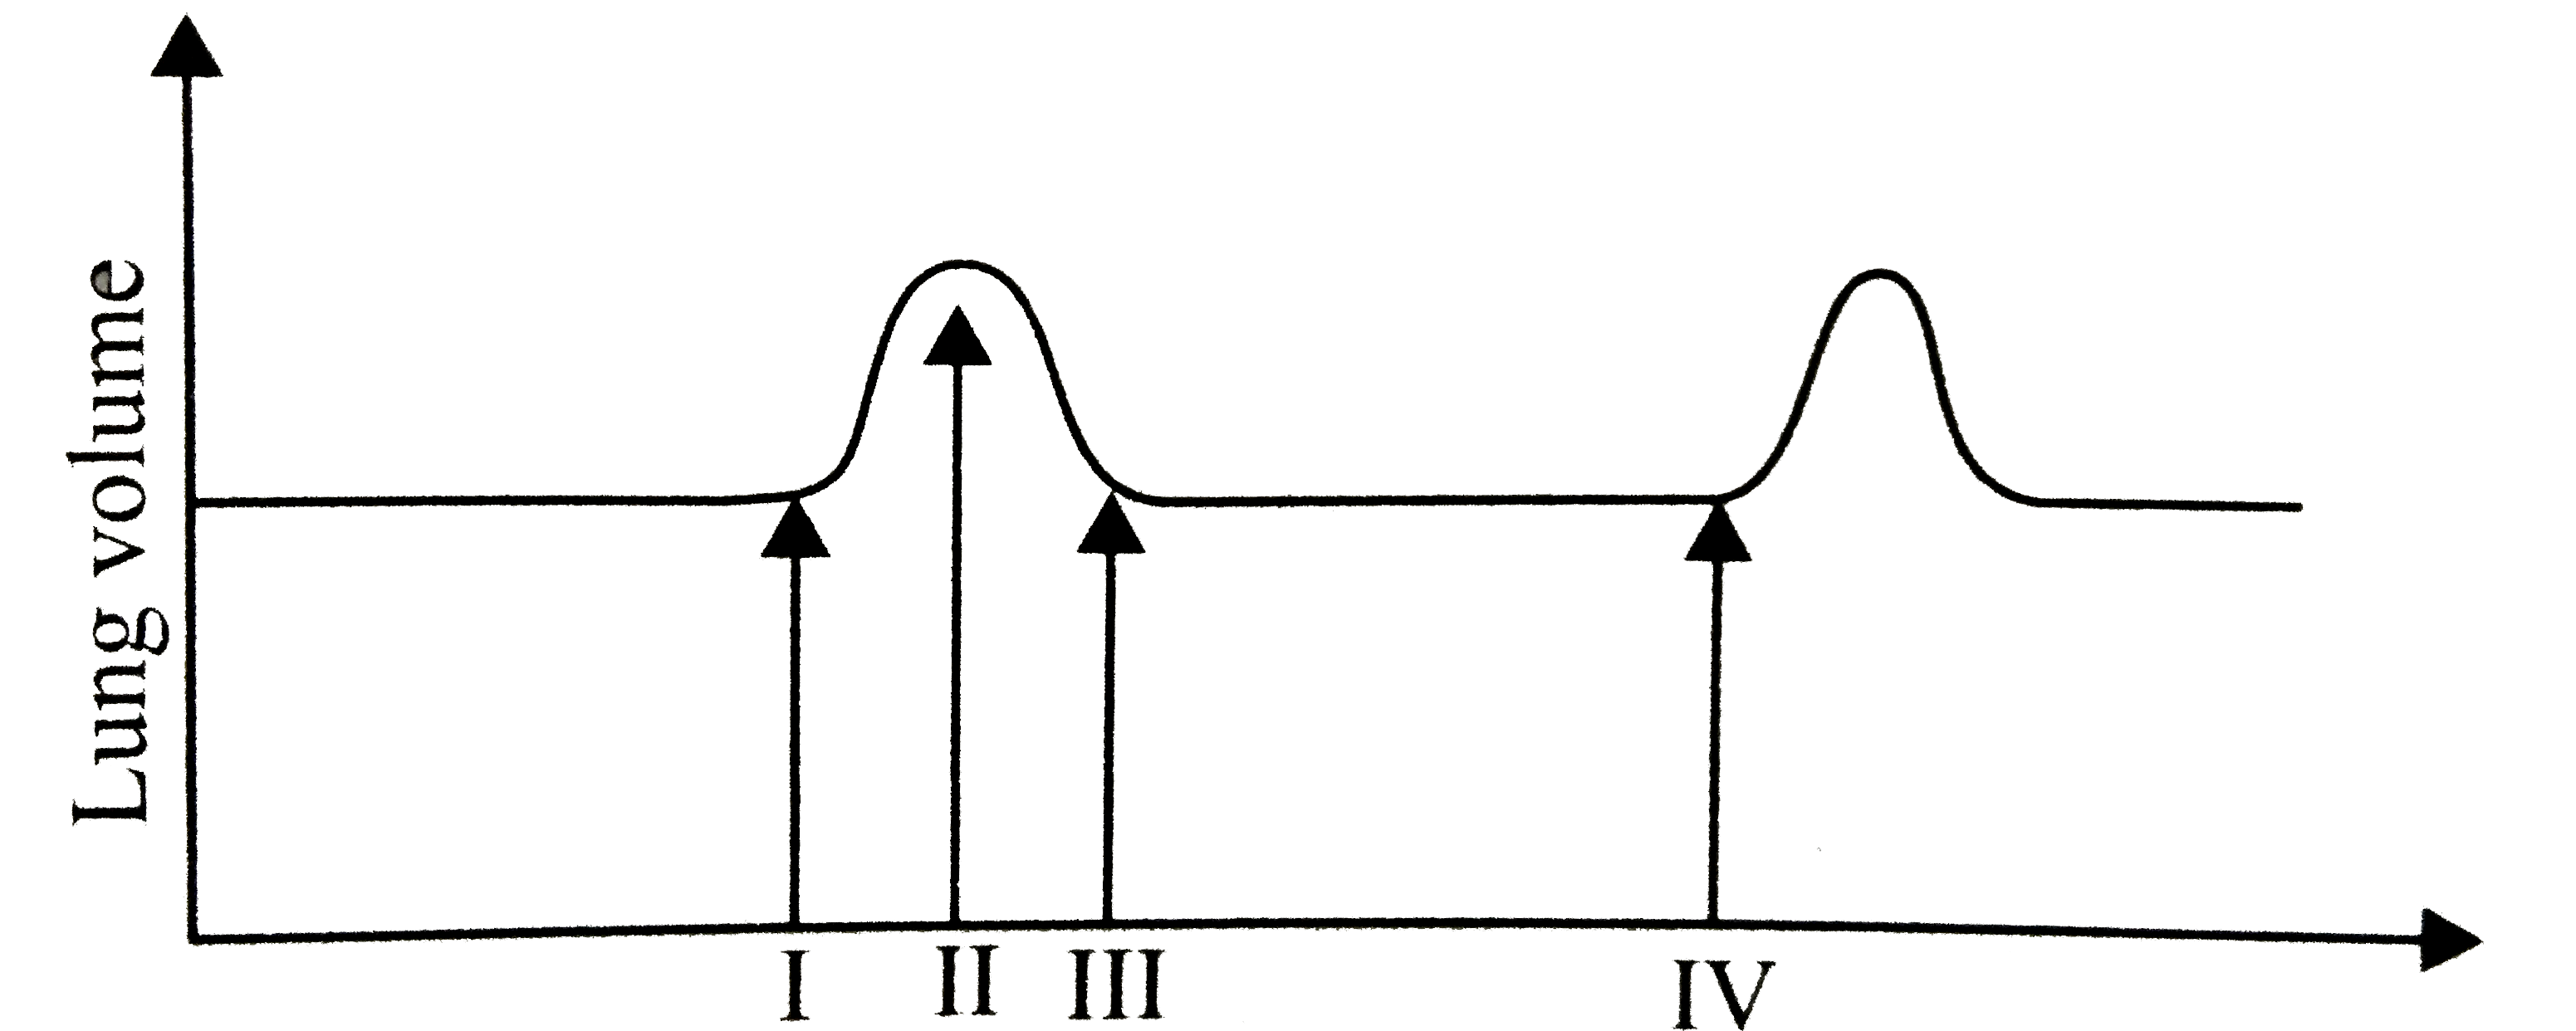
The given figure illustrates the changes in lung volume during the process of breathing.

The changes from II to III indicates the
Expansion of ribs
Movement of air out of the thoracic cage
Movement of diaphragm away from the lungs
Movement of air out of the lungs
The correct Answer is:D
Step by step video, text & image solution for The given figure illustrates the changes in lung volume during the process of breathing. The changes from II to III indicates the by Biology experts to help you in doubts & scoring excellent marks in Class 12 exams.
Updated on:21/07/2023Topper's Solved these Questions
Similar Questions
Knowledge Check
The given figure illustrates the changes in lung volume during the process of breathing. The change from II to III indicates the :-
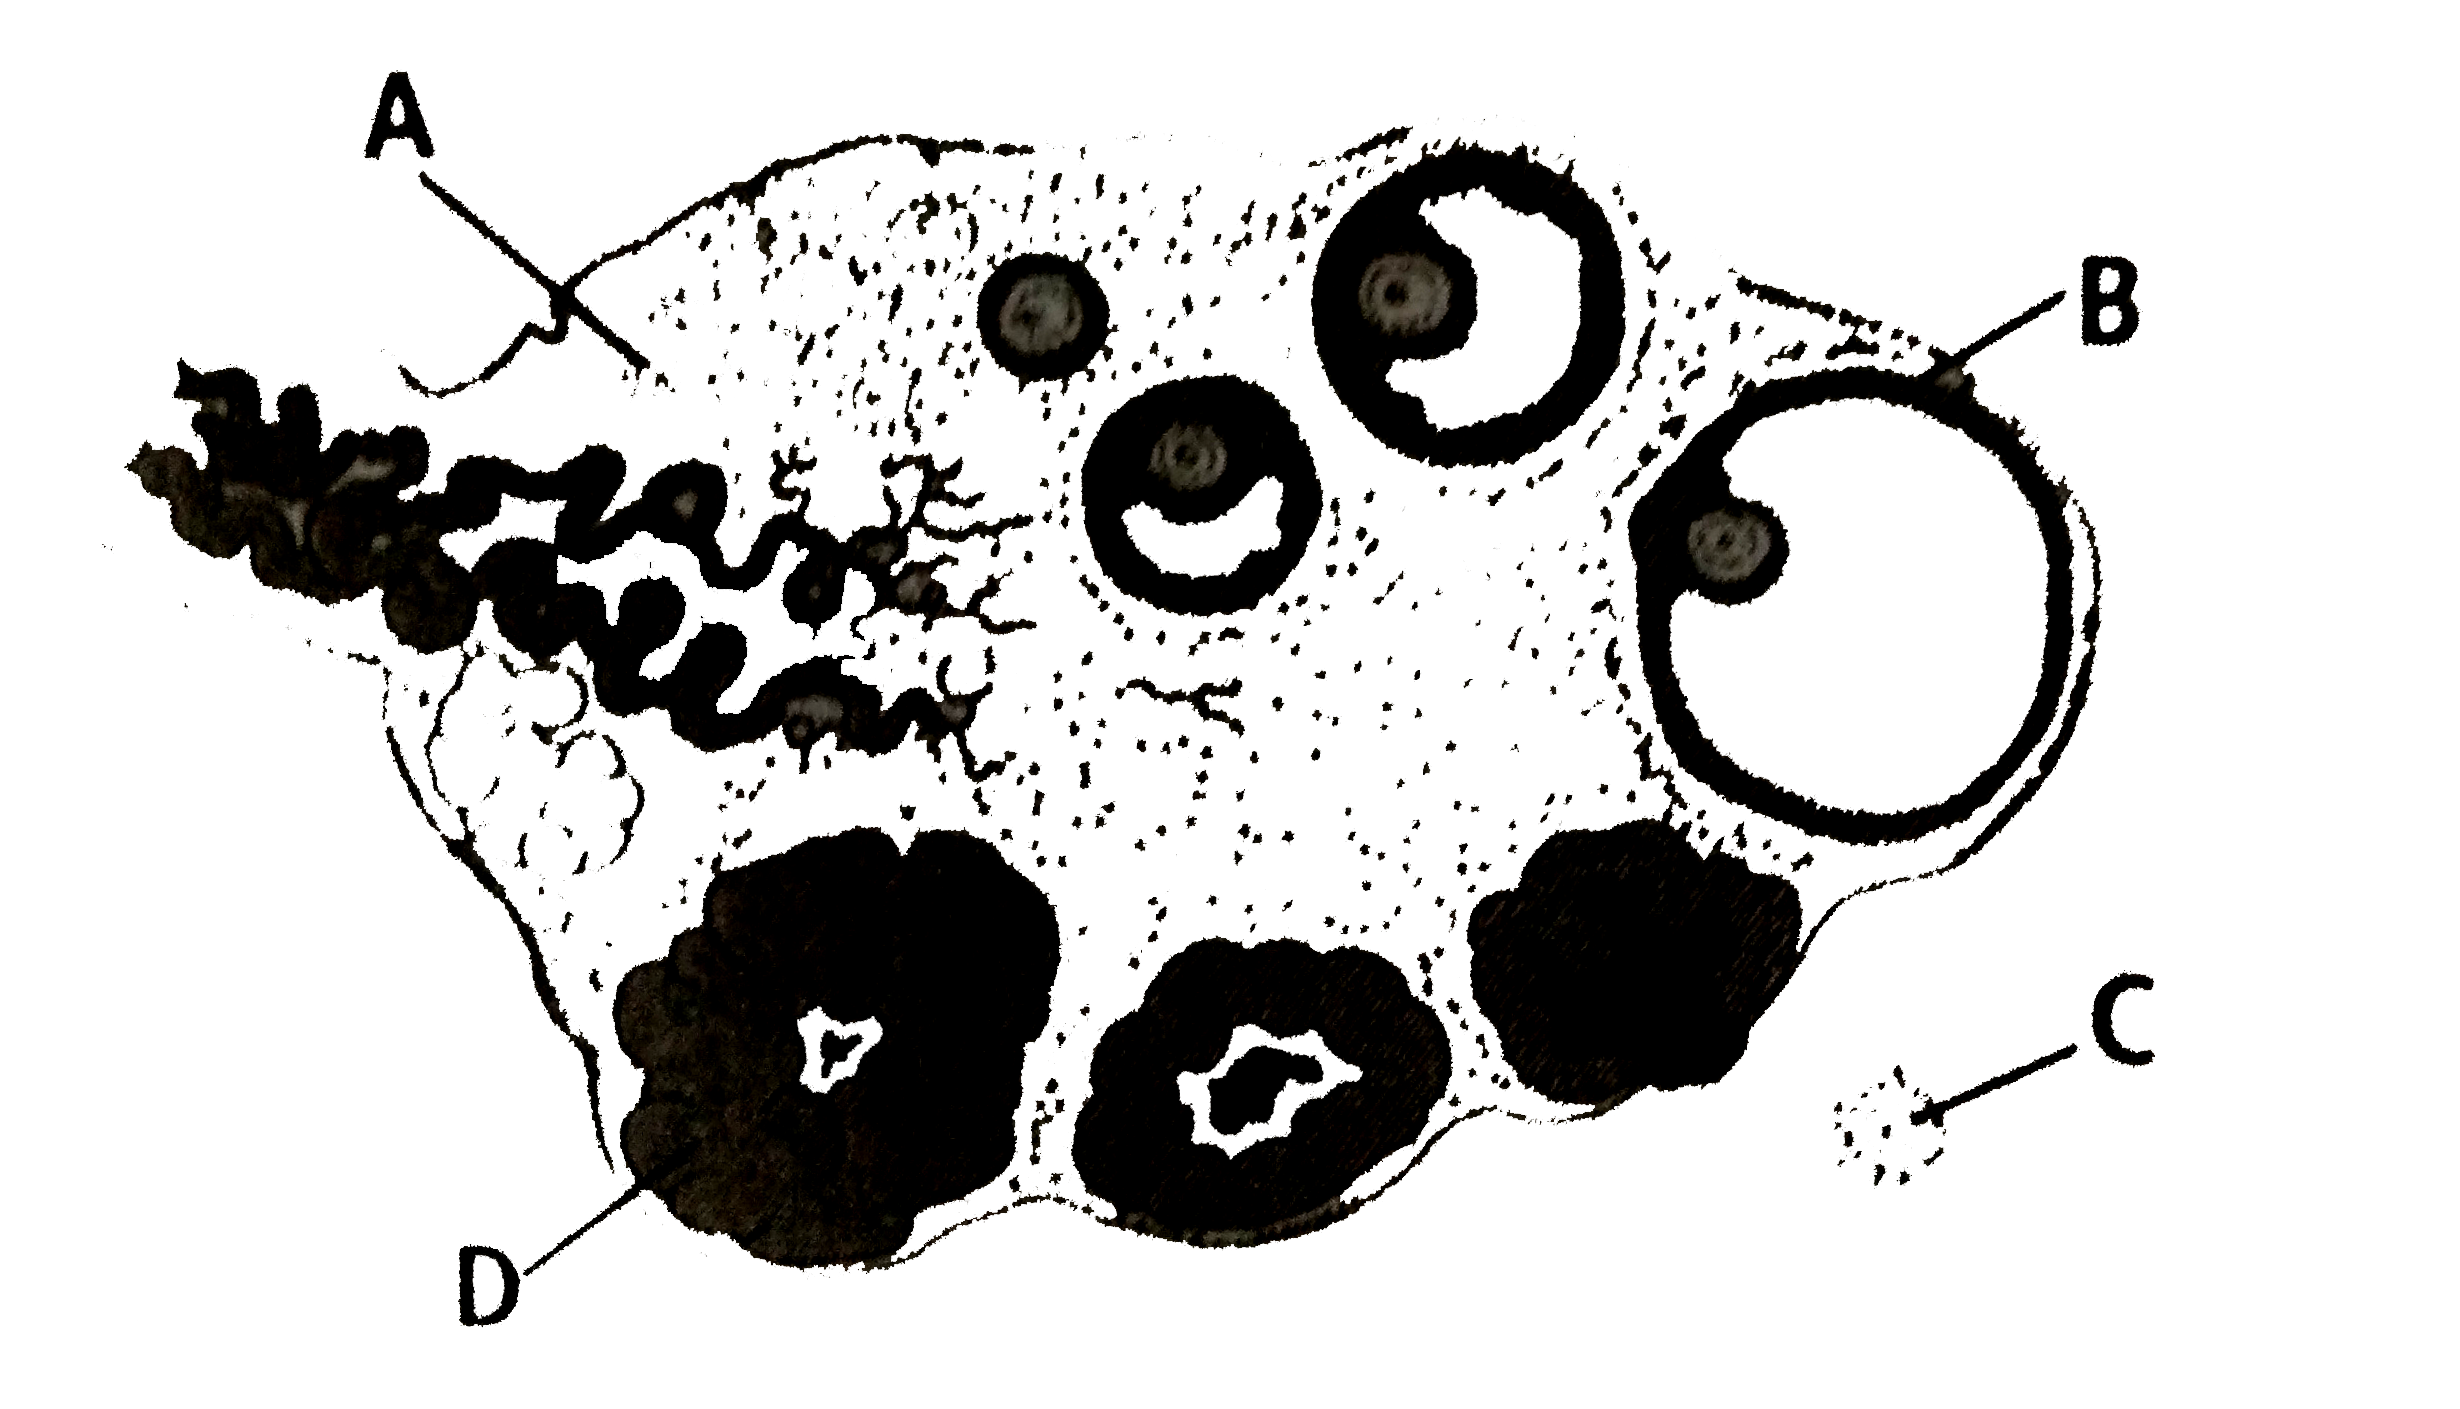
AExpansion of ribsBMovement of air out of the thoracic cageCMovement of diaphragm away from the lungsDMovement of air out of the lungsThe given figure illustrates montly changes in the human ovary during the reproduction cycle.

Which of the following statements most accurately describes each structure?ABefore puberty, the oocyte (A) does not start the process of meiosis.BThe hormone produced by by structure (B) causes thinning of the uterine cervical mucus to allow passage of sperms.CDuring ovulation, structure (C) stays at the interphase between meiosis I and meiosis II.DThe hormone produced by structure (D) stimulates the pituitary gland to secrete luteinising hormone.Which of the follwoing changes takes place during the process of calcination of an ore?
Athermal decomposition of ore takes placeBthe mass become porousCmoisture is removedDall the above
During the process of ecological succession, the changes that take place in communities are
View SolutionDuring the process of ecological succession the changes that takes place in communities are
View SolutionDuring the process of ecological succession the changes that take place in communities are
View SolutionThe change of a solid into liquid is called ………
View SolutionBreathing, an important step of the respiratory system, is a two-part process involving-inhalation and exhalation. During the process of breathing, the thorax region shows some changes. Identify the statement/s from below that is/are related to the exhalation process.
I. External intercostal muscles contract
II. Pressure in the lungs increases
III. Diaphragm contracts
IV. The volume of thorax decreases
View Solution

