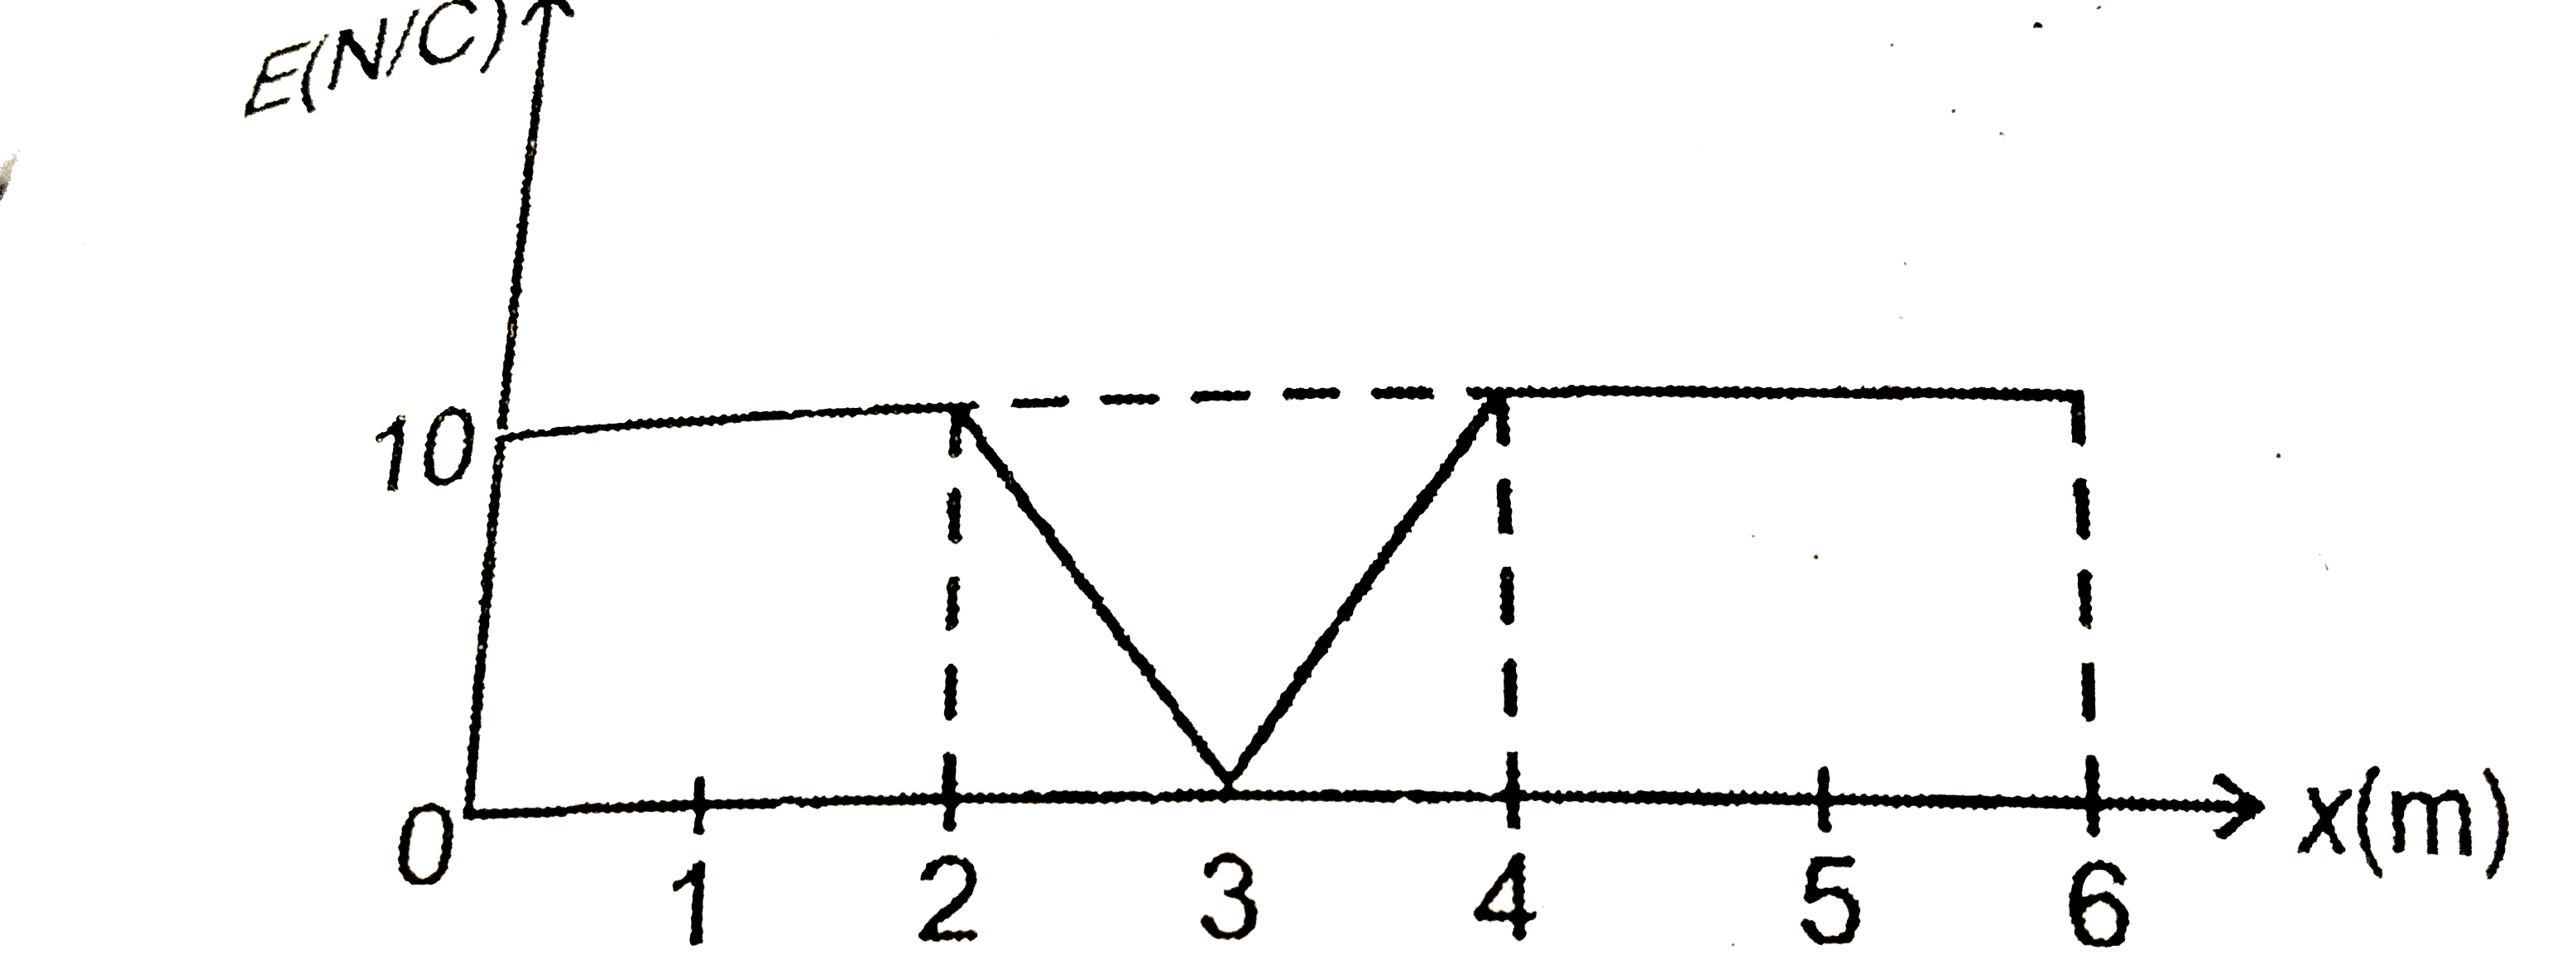
Figure shows the variation of electric field intensity E with distance x. The potential difference between the point x = 0 and x= 5m is

40V
50V
30V
20V
The correct Answer is:A
Area under electric field - position graph gives potential difference
ΔV = Area under the curve
=10×2+12×10×1+12×10×1+10×1
=20+5+5+10
ΔV=40V
Topper's Solved these Questions
Similar Questions
Knowledge Check
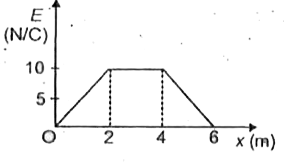
Figure shows the variation of electric field intensity E versus distance x. What is the potential difference between the point at x = 2 m and at x = 6 m from O?
 A30 VB60 VC40 VD80 V
If the electric field is given by →E=(100x2)i the potential difference between points x=10m and x=20m in volts is
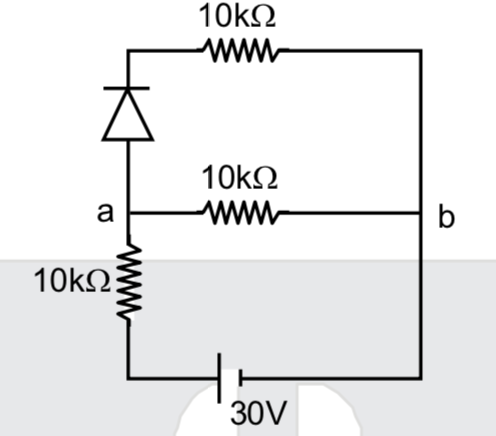
A−5B5C−10D10There is a electric circuit as shown in the figure. Find potential difference between points a and b.
 A3VB15VC10VD5V
Two identical positive charges are kept as shown in Fig < 0 x a The variation of electric field intensity E along x-axis is given by (The electric field intensity towards positive x-axis is taken as positive)
View SolutionA uniform electric field is present in the positive x - direction. If the intensity of the field is 5NC−1 then find the potential difference (VB−VA) between two points A (0 m, 2 m) and B (5 m, 3 m).
View SolutionA uniform electric field is along x-axis. The potential difference VA−VB=10V is between two points A (2m, 3m) and (4m, 8m). Find the electric field intensity.
View SolutionElectric field at a distance x from the origin is given as E=100N−m2/Cx2 . Then potential difference between the points situated at x = 10 m and x = 20m is :-
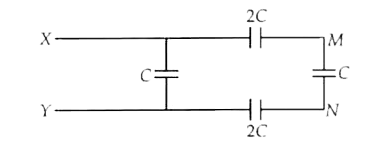
View SolutionIn the adjoining figure the potential difference between X and Y is 60 V . The potential difference between the points M and N - will be

View Solution
