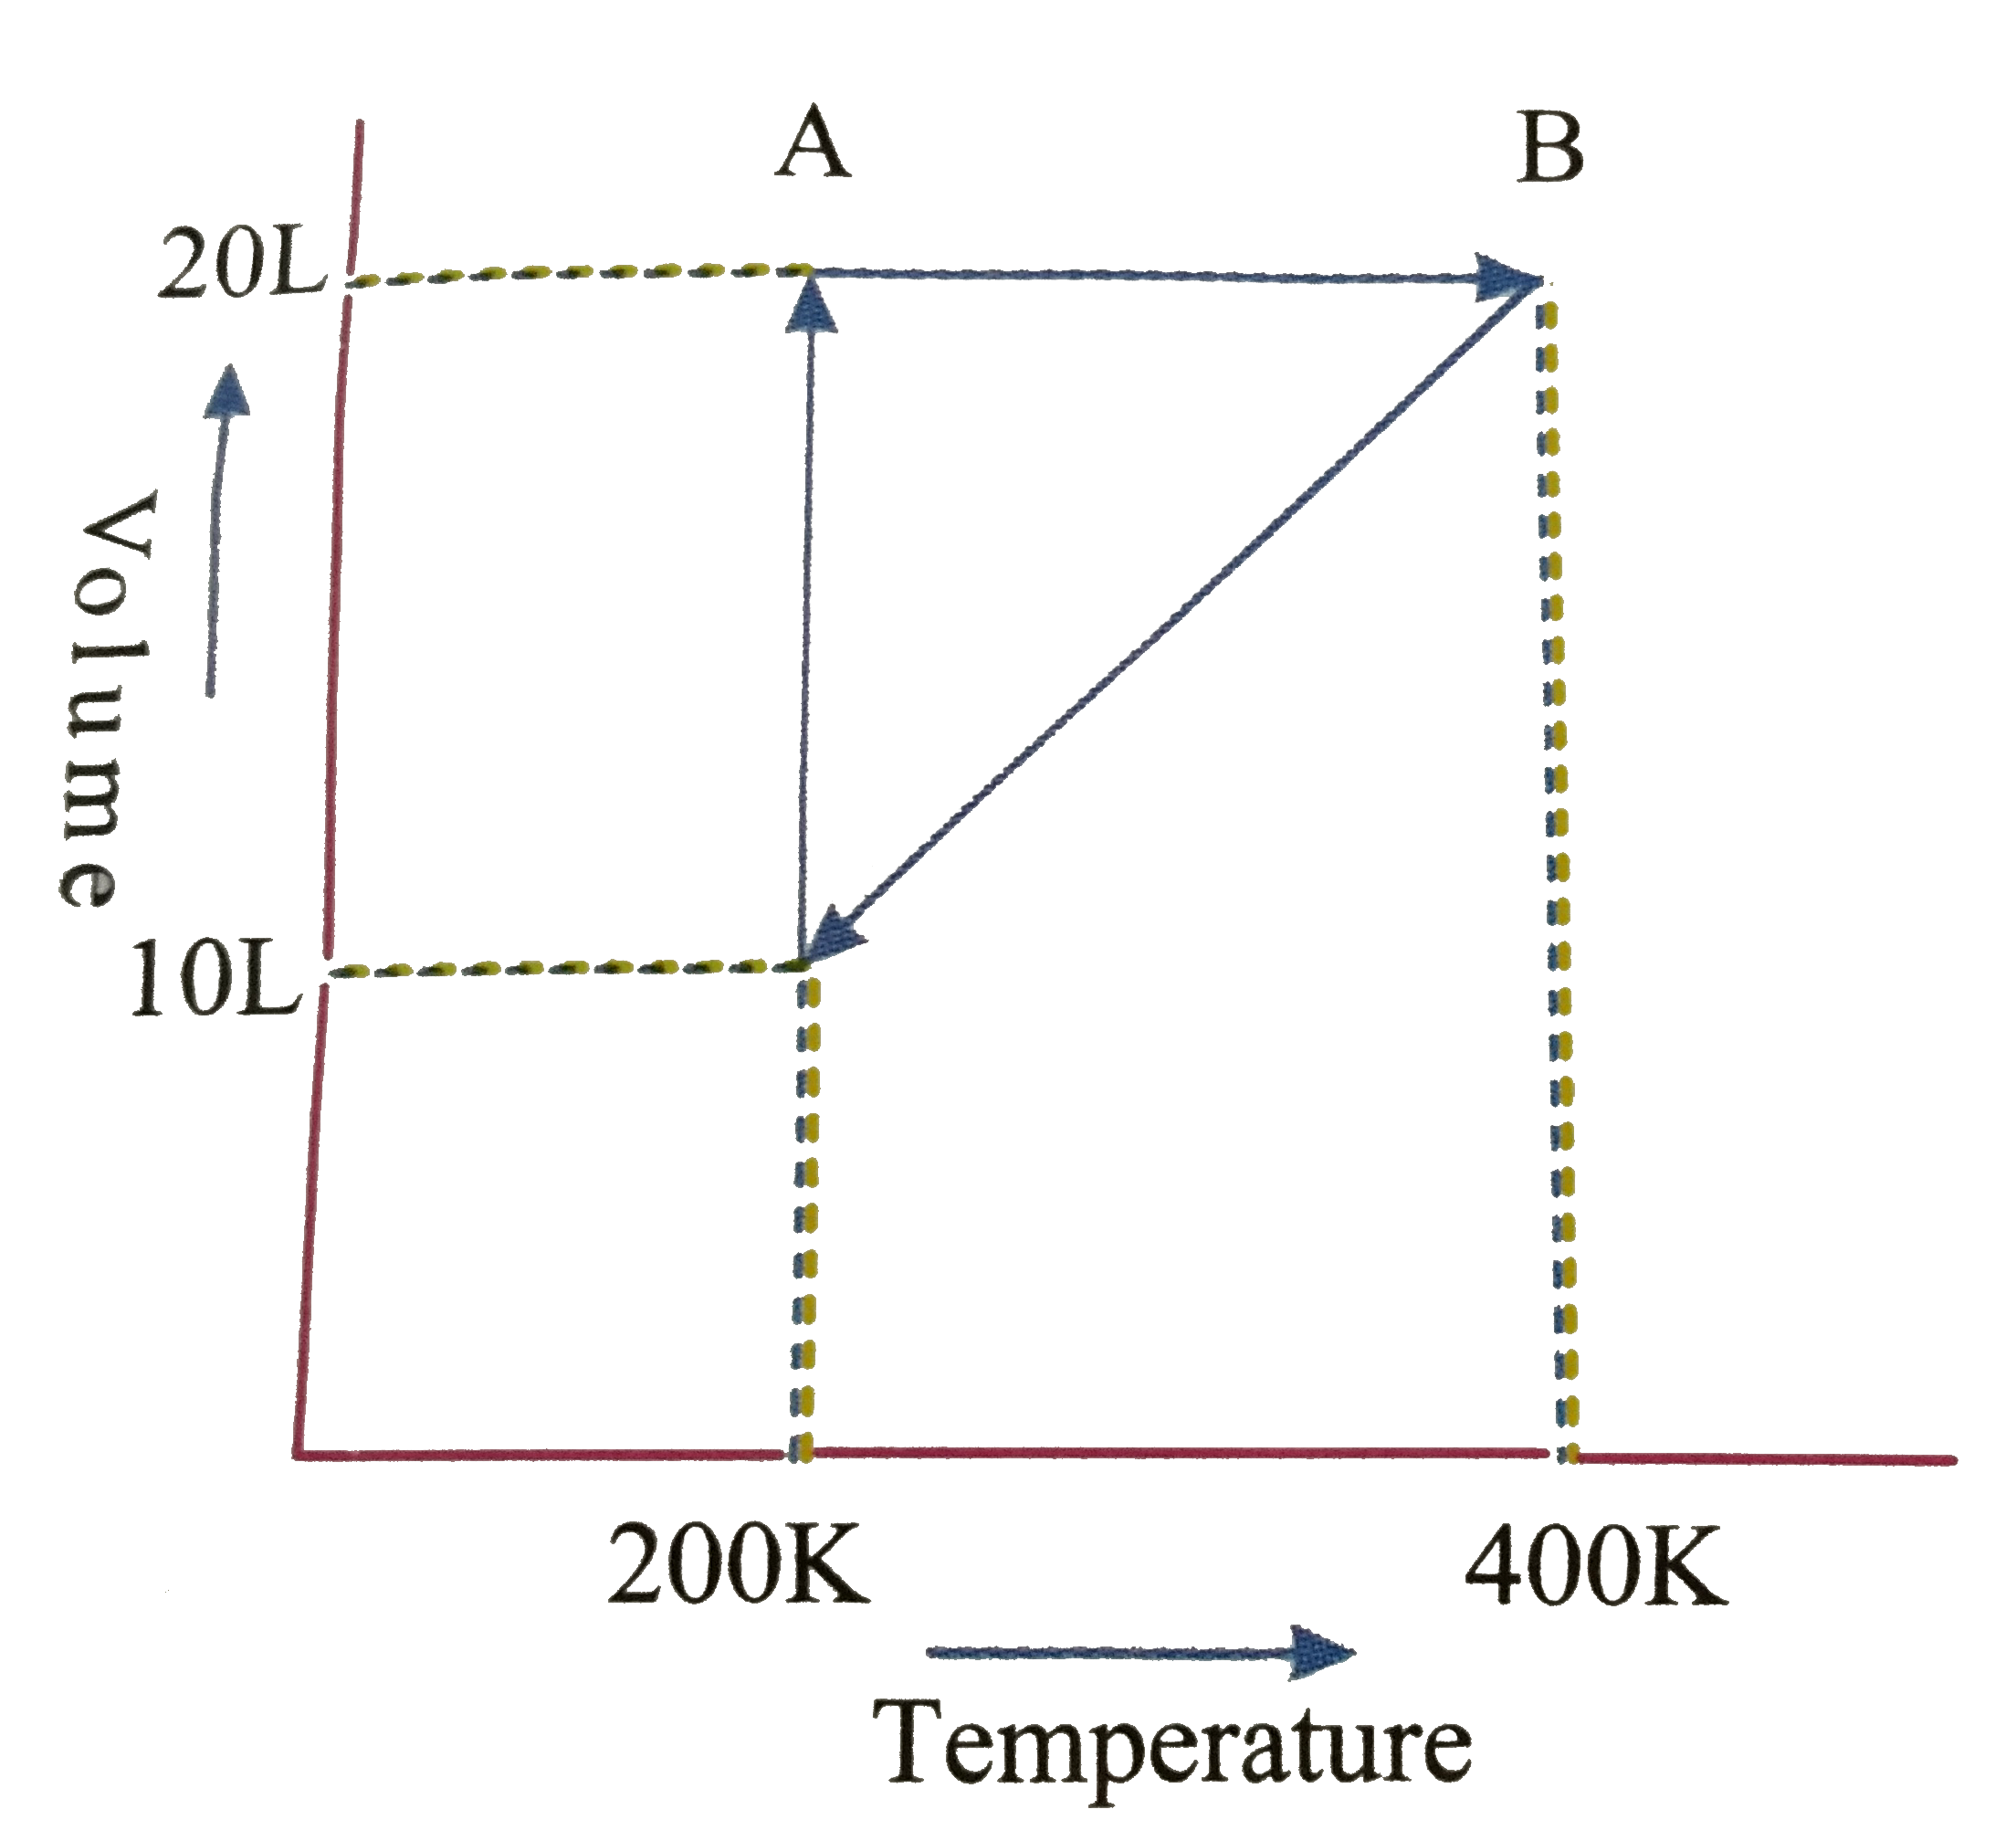
Graph for one mole gas is given below
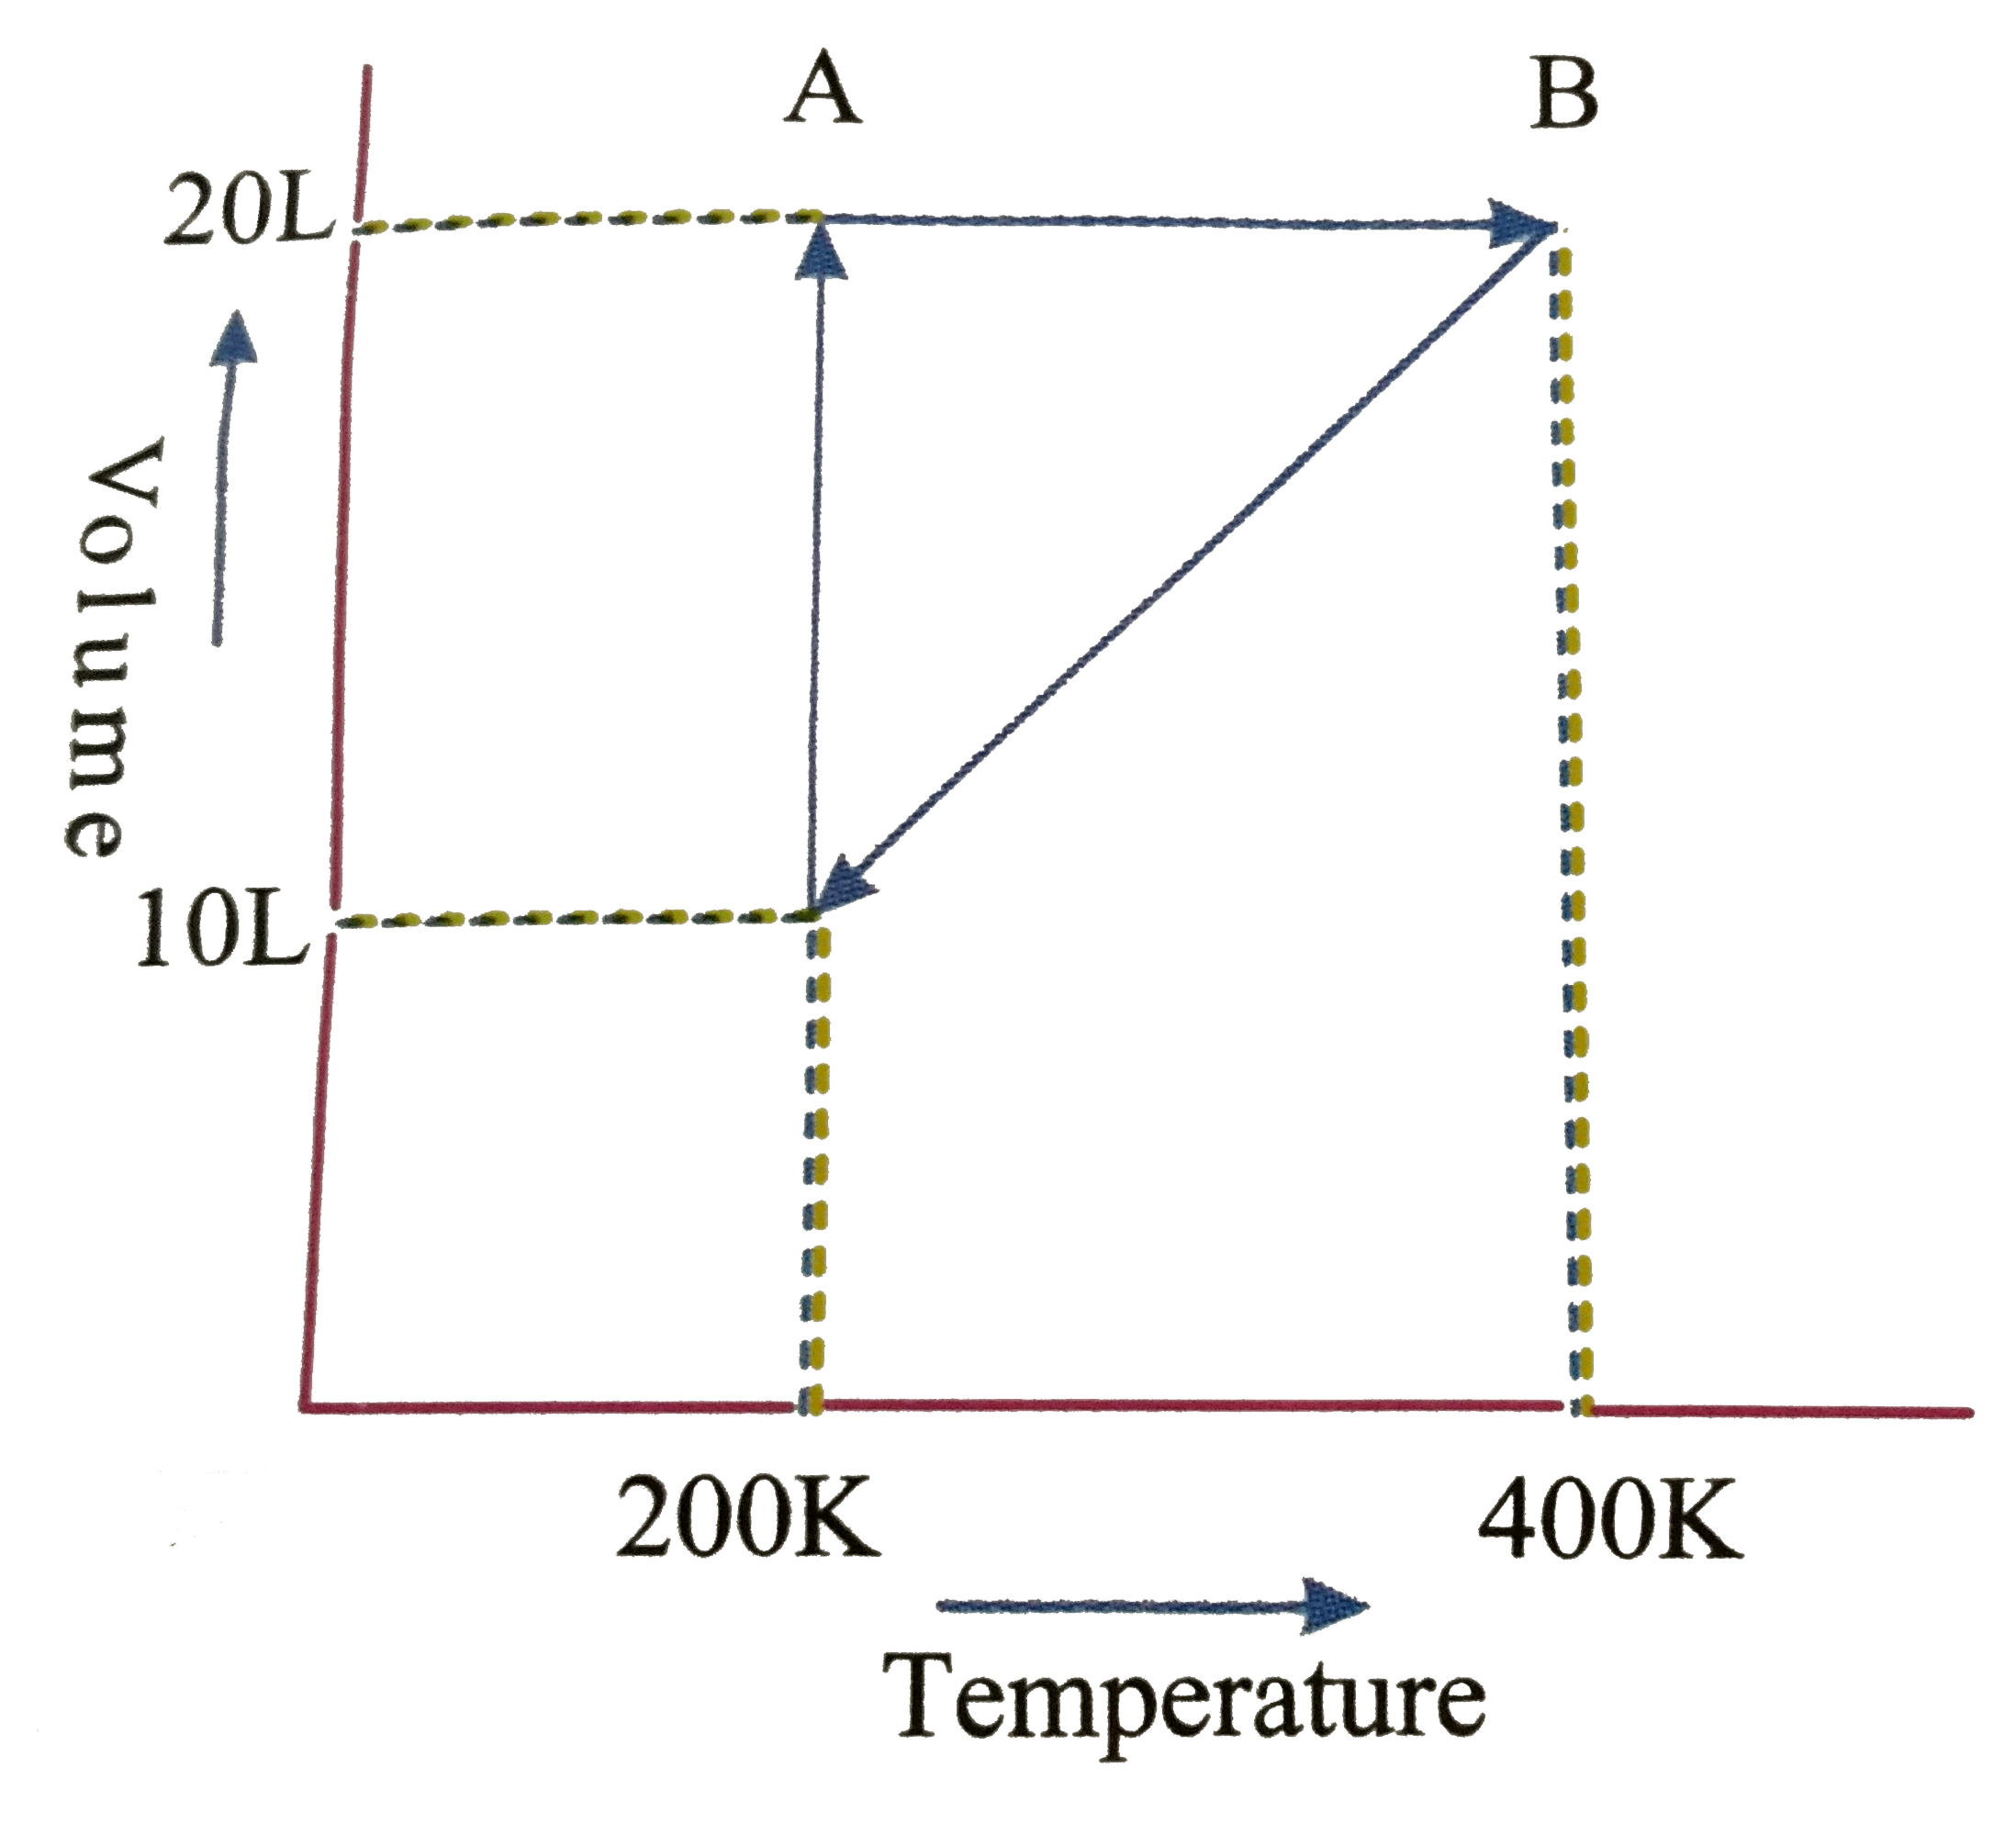
the process which occurs in going from, B→C is
Isothermal
Adiabatic
Isobaric
Isochoric
The correct Answer is:C
Step by step video, text & image solution for Graph for one mole gas is given below the process which occurs in going from, B rarr C is by Chemistry experts to help you in doubts & scoring excellent marks in Class 11 exams.
Topper's Solved these Questions
- BOOK - NARAYNACHAPTER - THERMODYNAMICSEXERCISE - Matching type6videos
THERMODYNAMICS
- BOOK - NARAYNACHAPTER - THERMODYNAMICSEXERCISE - Assertion- Reason5videos
THERMODYNAMICS
- BOOK - NARAYNACHAPTER - THERMODYNAMICSEXERCISE - Level-VI150videos
THERMODYNAMICS
- BOOK - NARAYNACHAPTER - STRUCTURE OF ATOMEXERCISE - EXERCISE - IV EXEMPLAR PROBLEMS24videos
STRUCTURE OF ATOM
Similar Questions
Knowledge Check
- Question 1 - Select One
Graph for one mole gas is given below
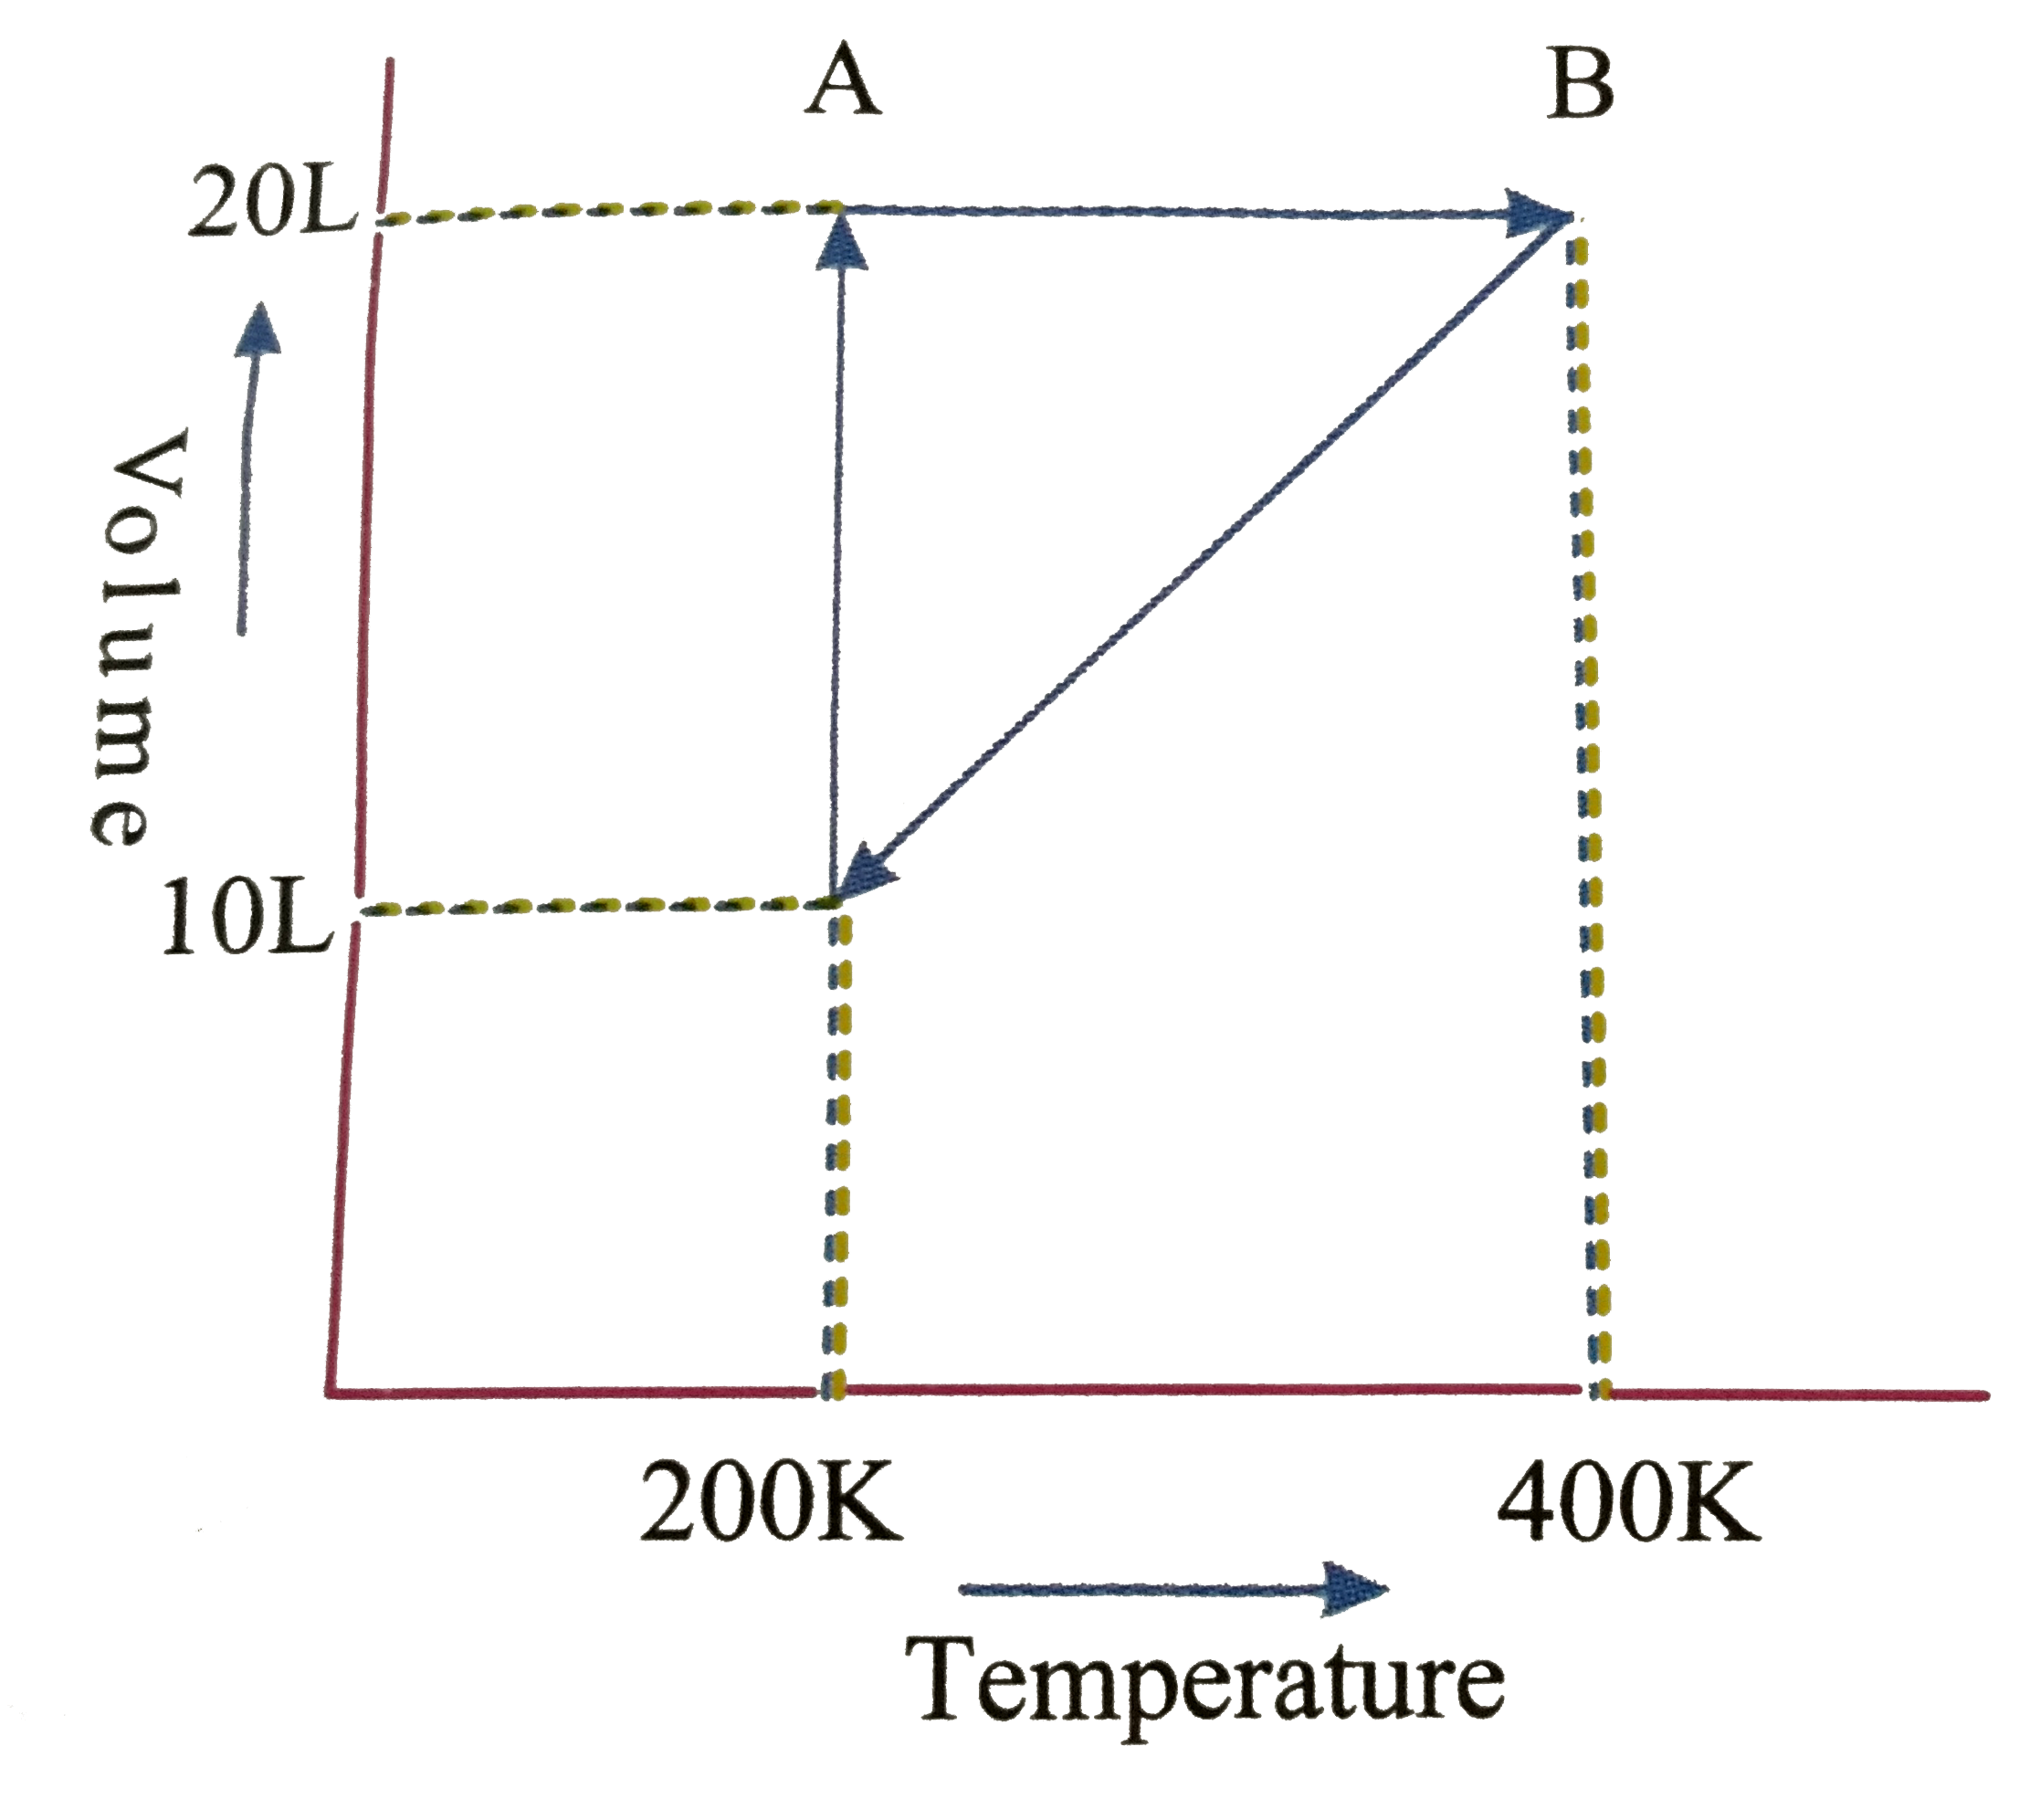
The pressure at C isAZeroB1.642 atmC0.0821 atmD0.821 atm - Question 2 - Select One
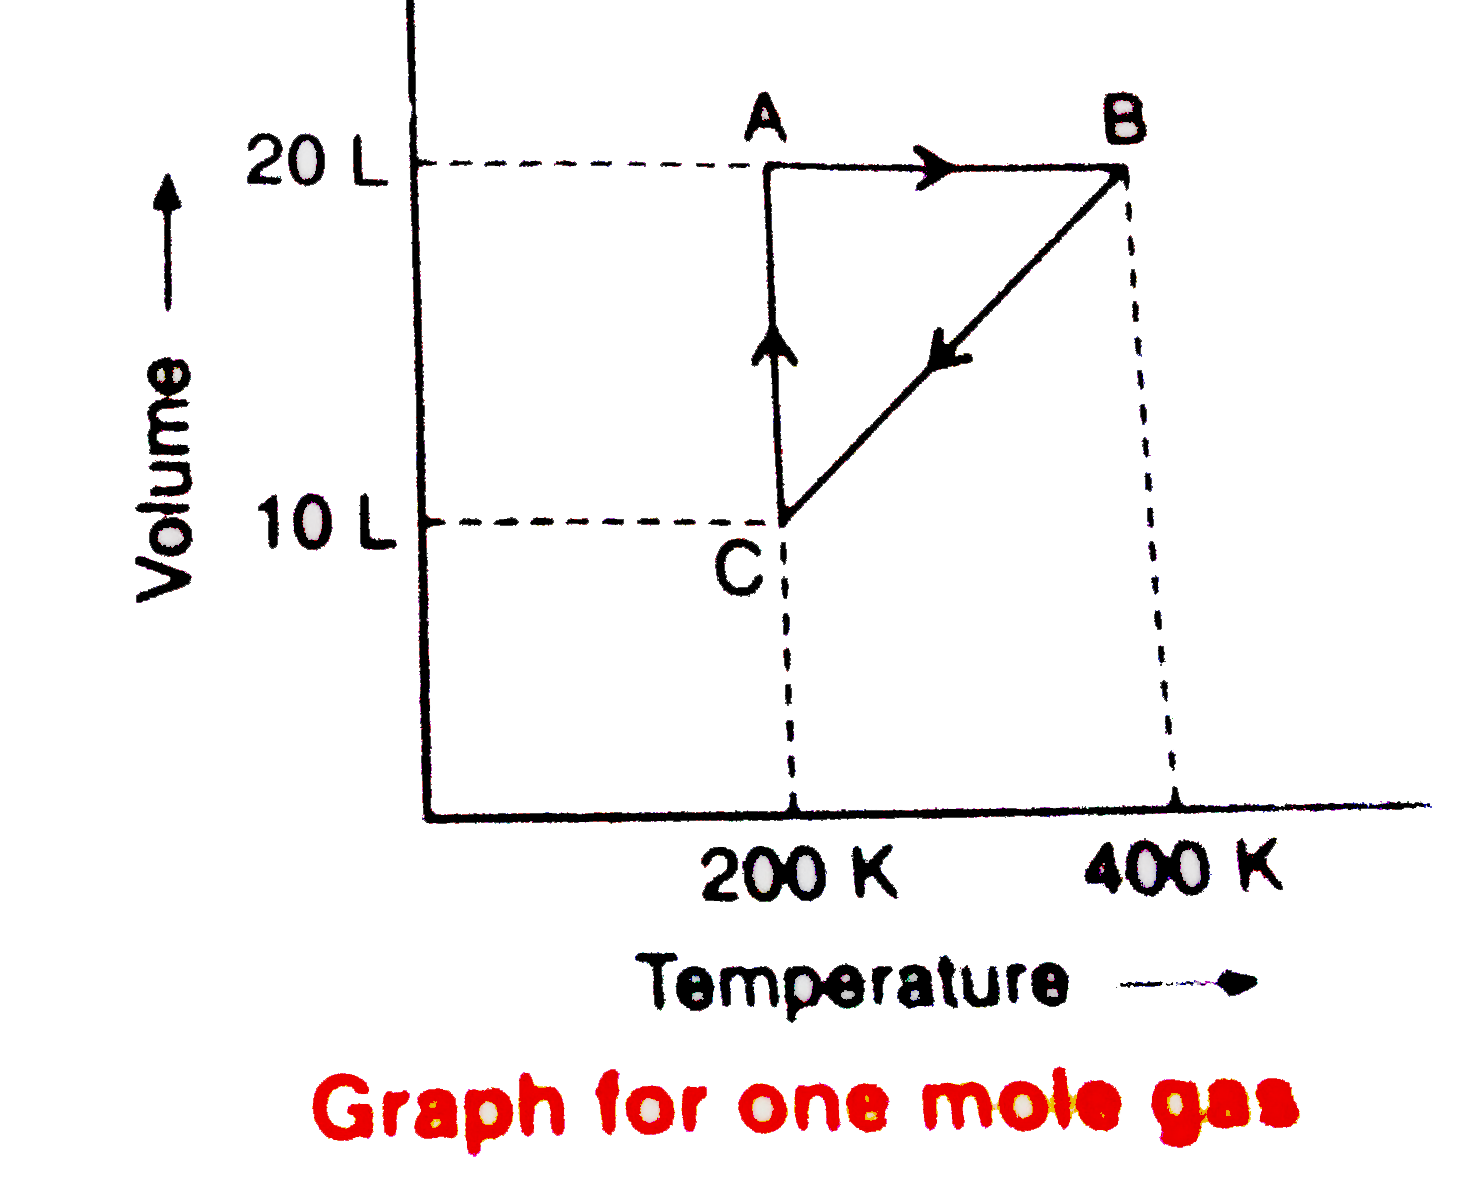
Q. The process which occurs in going from B→C is:AisothermalBadiabaticCisobaricDisochoric - Question 3 - Select One
Graph for one mole gas is given below
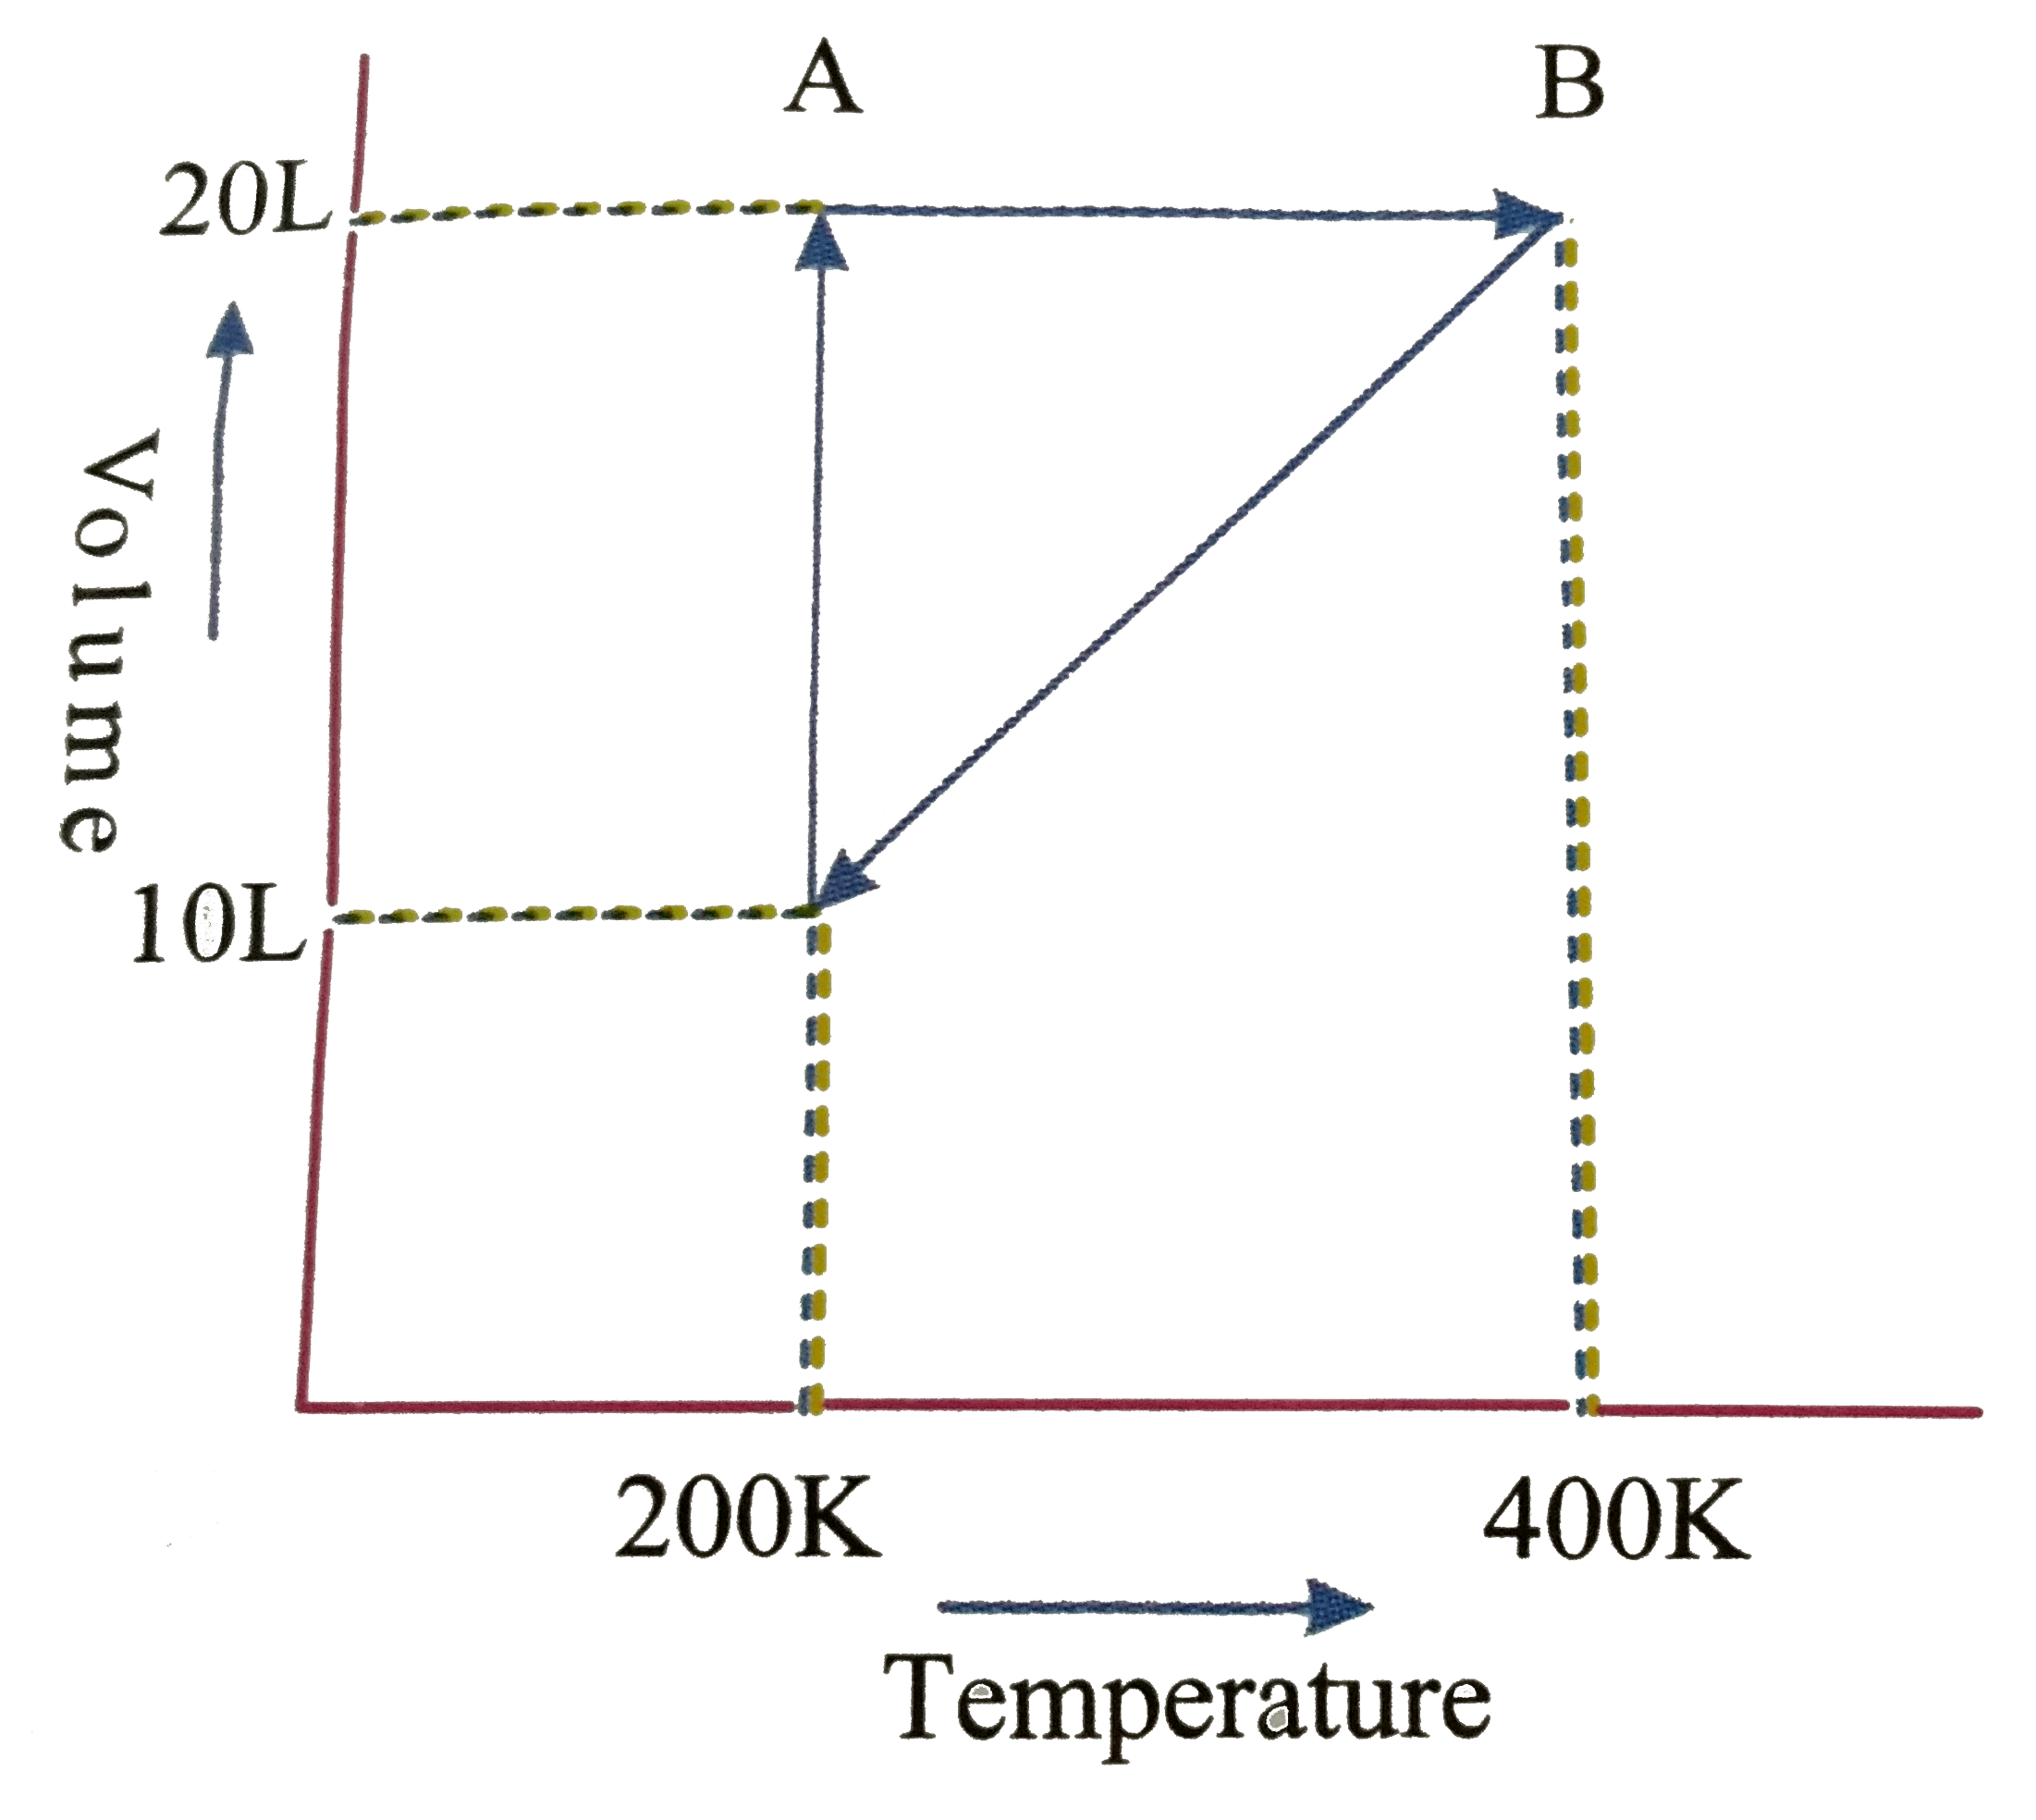
Work done in the process C→A isAZeroB8.21 L atmC16.2 L atmDUnpredictable
The volume vs. temperature graph of 1 mole of an ideal gas is given below
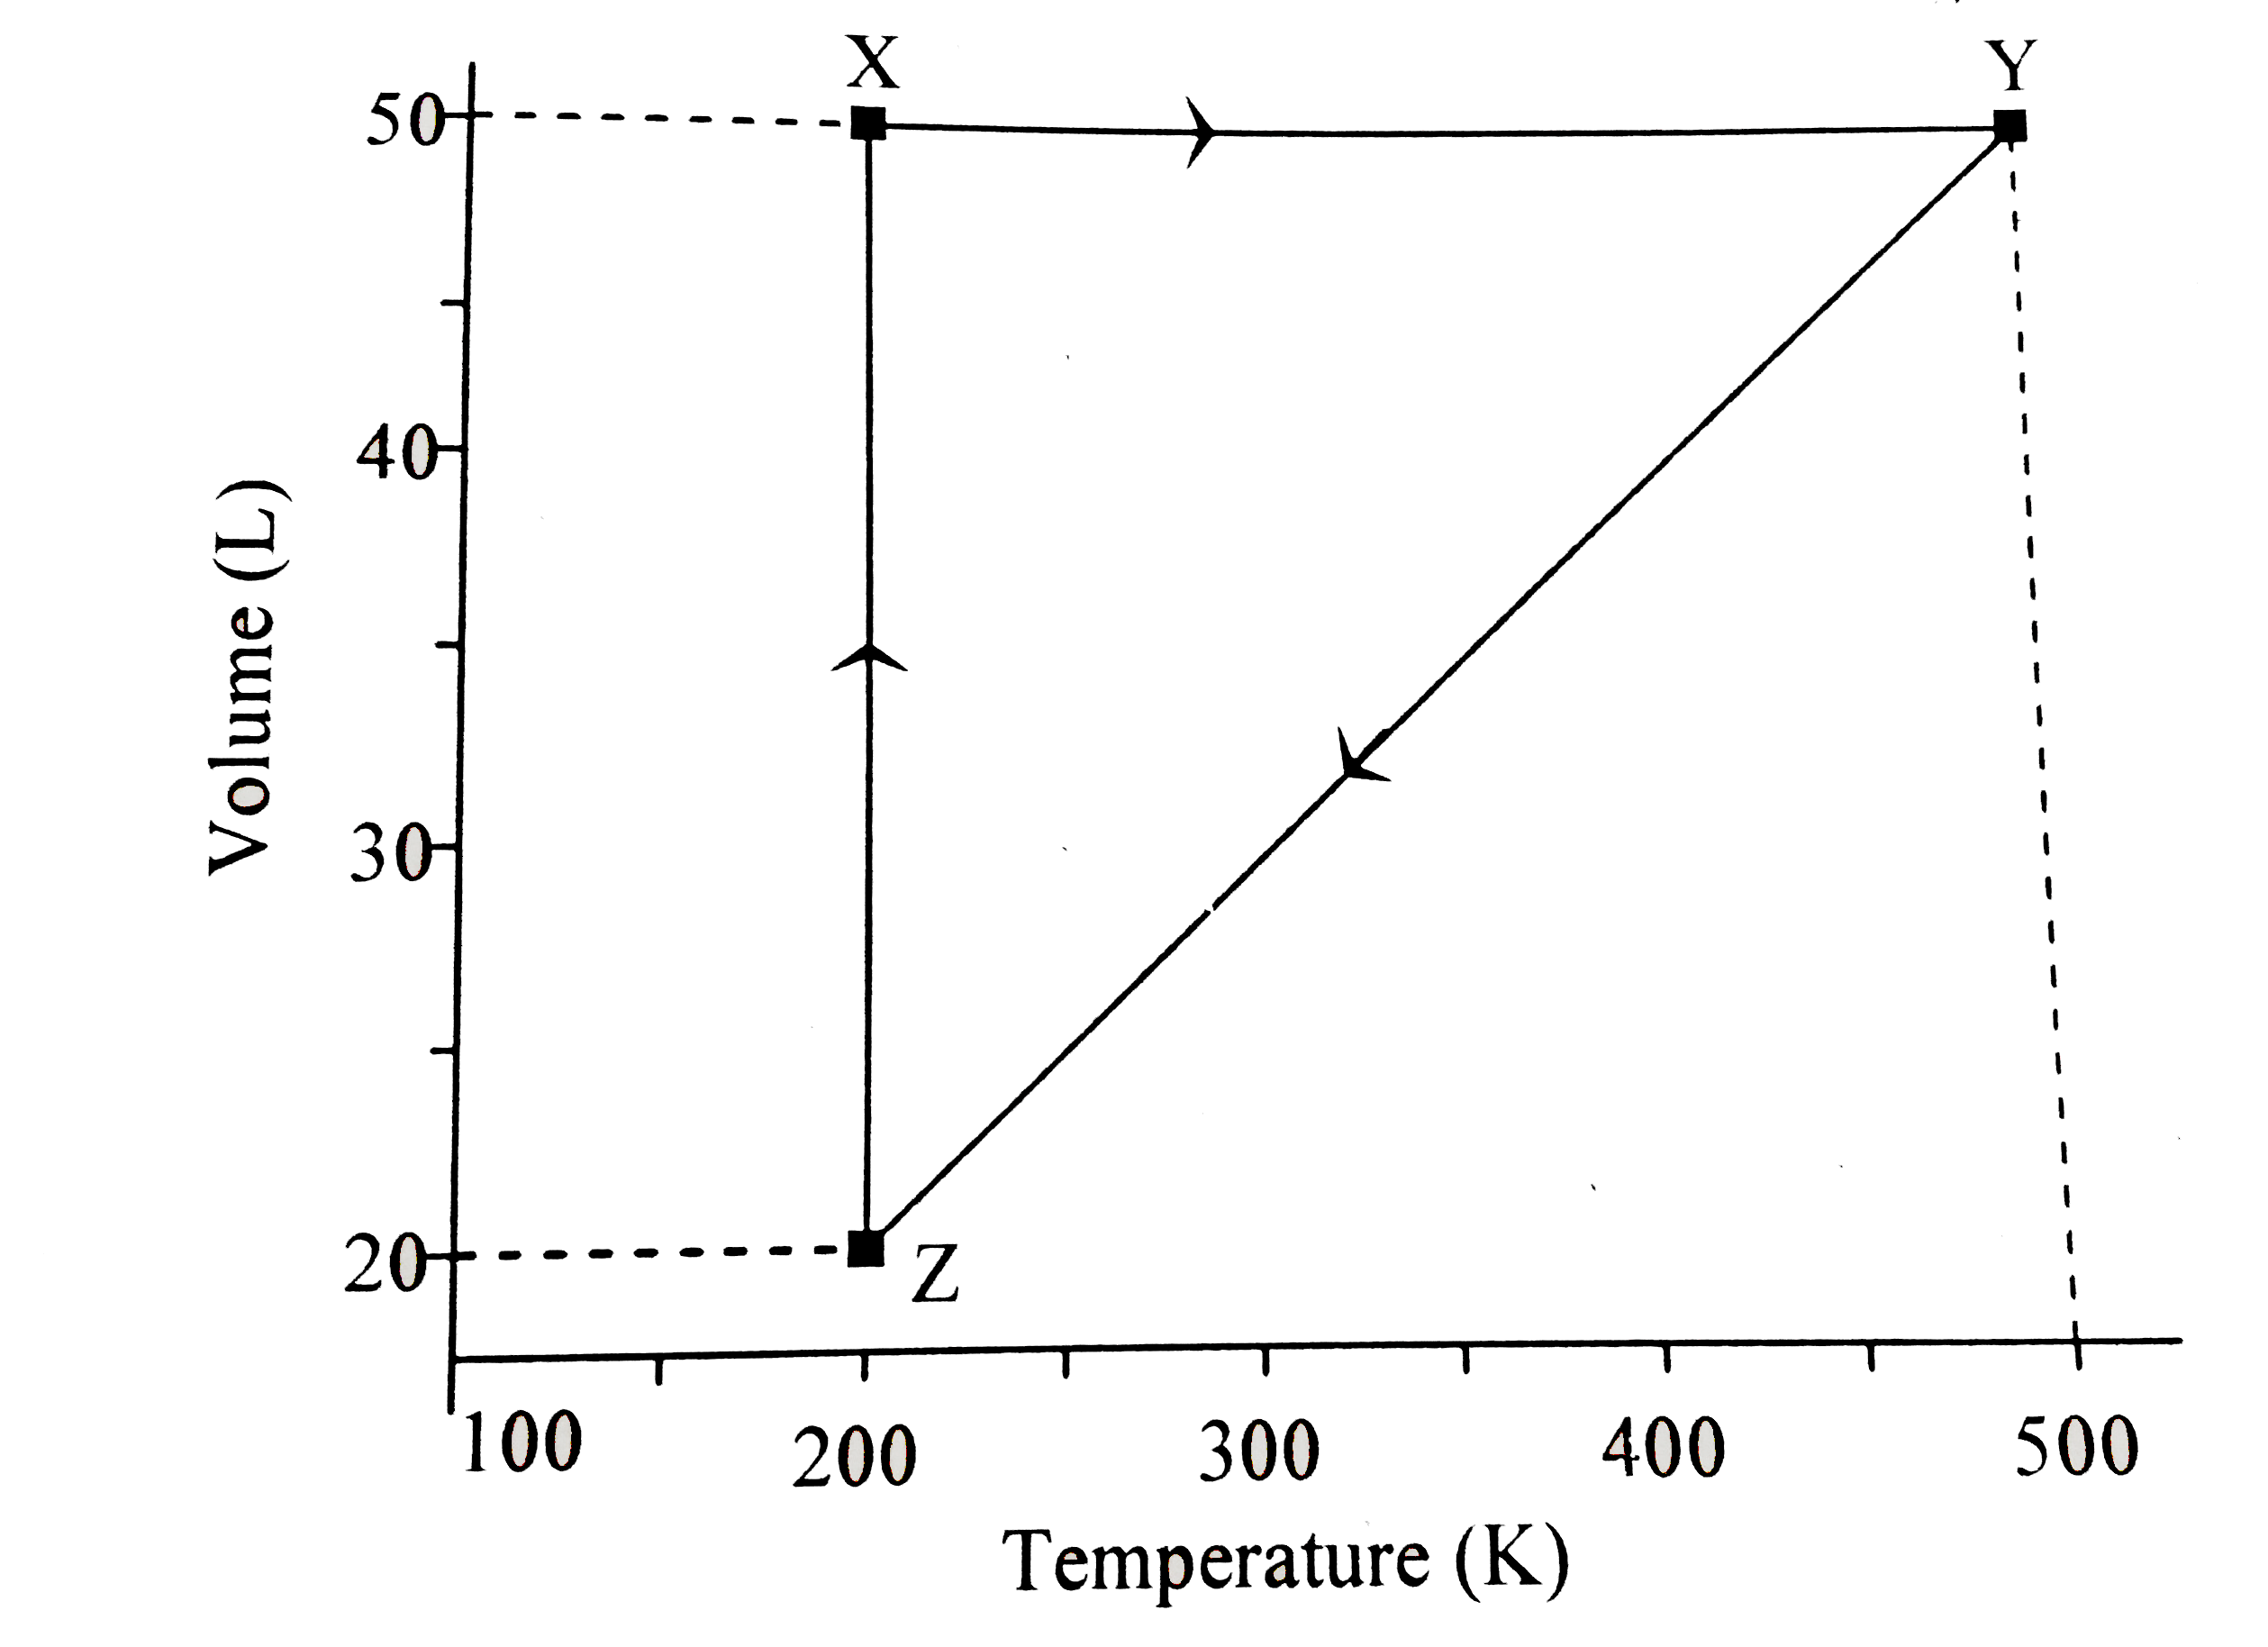
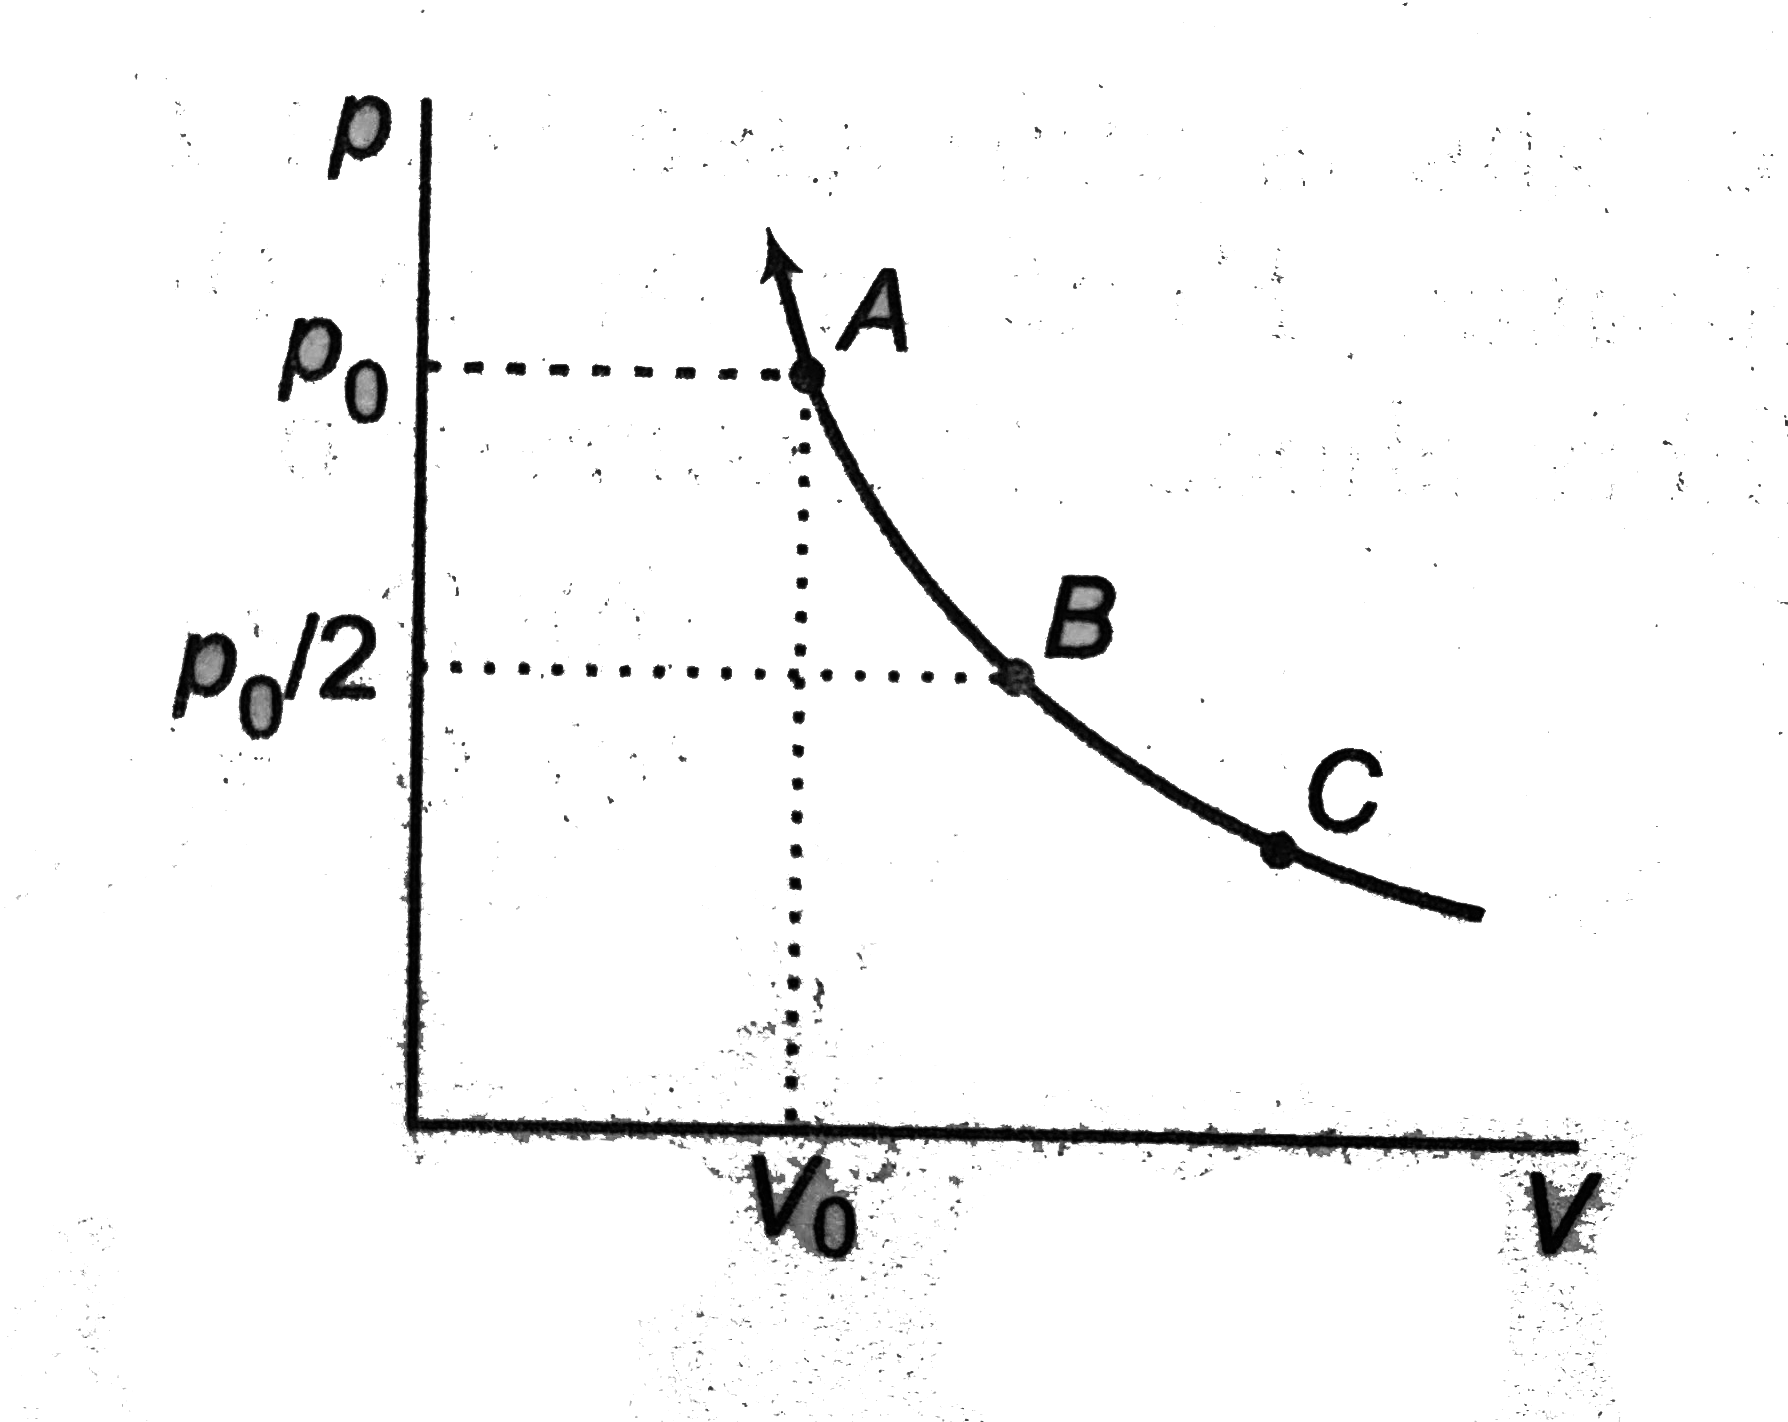
The pressure of the gas (in atm) at X, Y and Z, respectively, areView SolutionThe state of an ideal gas is changed through an isothermal process at temperature T0 as shown in figure. The work done by the gas in going from state B to C is double the work done by gas in going from state A to B. If the pressure in the state B is p02, then the pressure of the gas in state C is
 View Solution
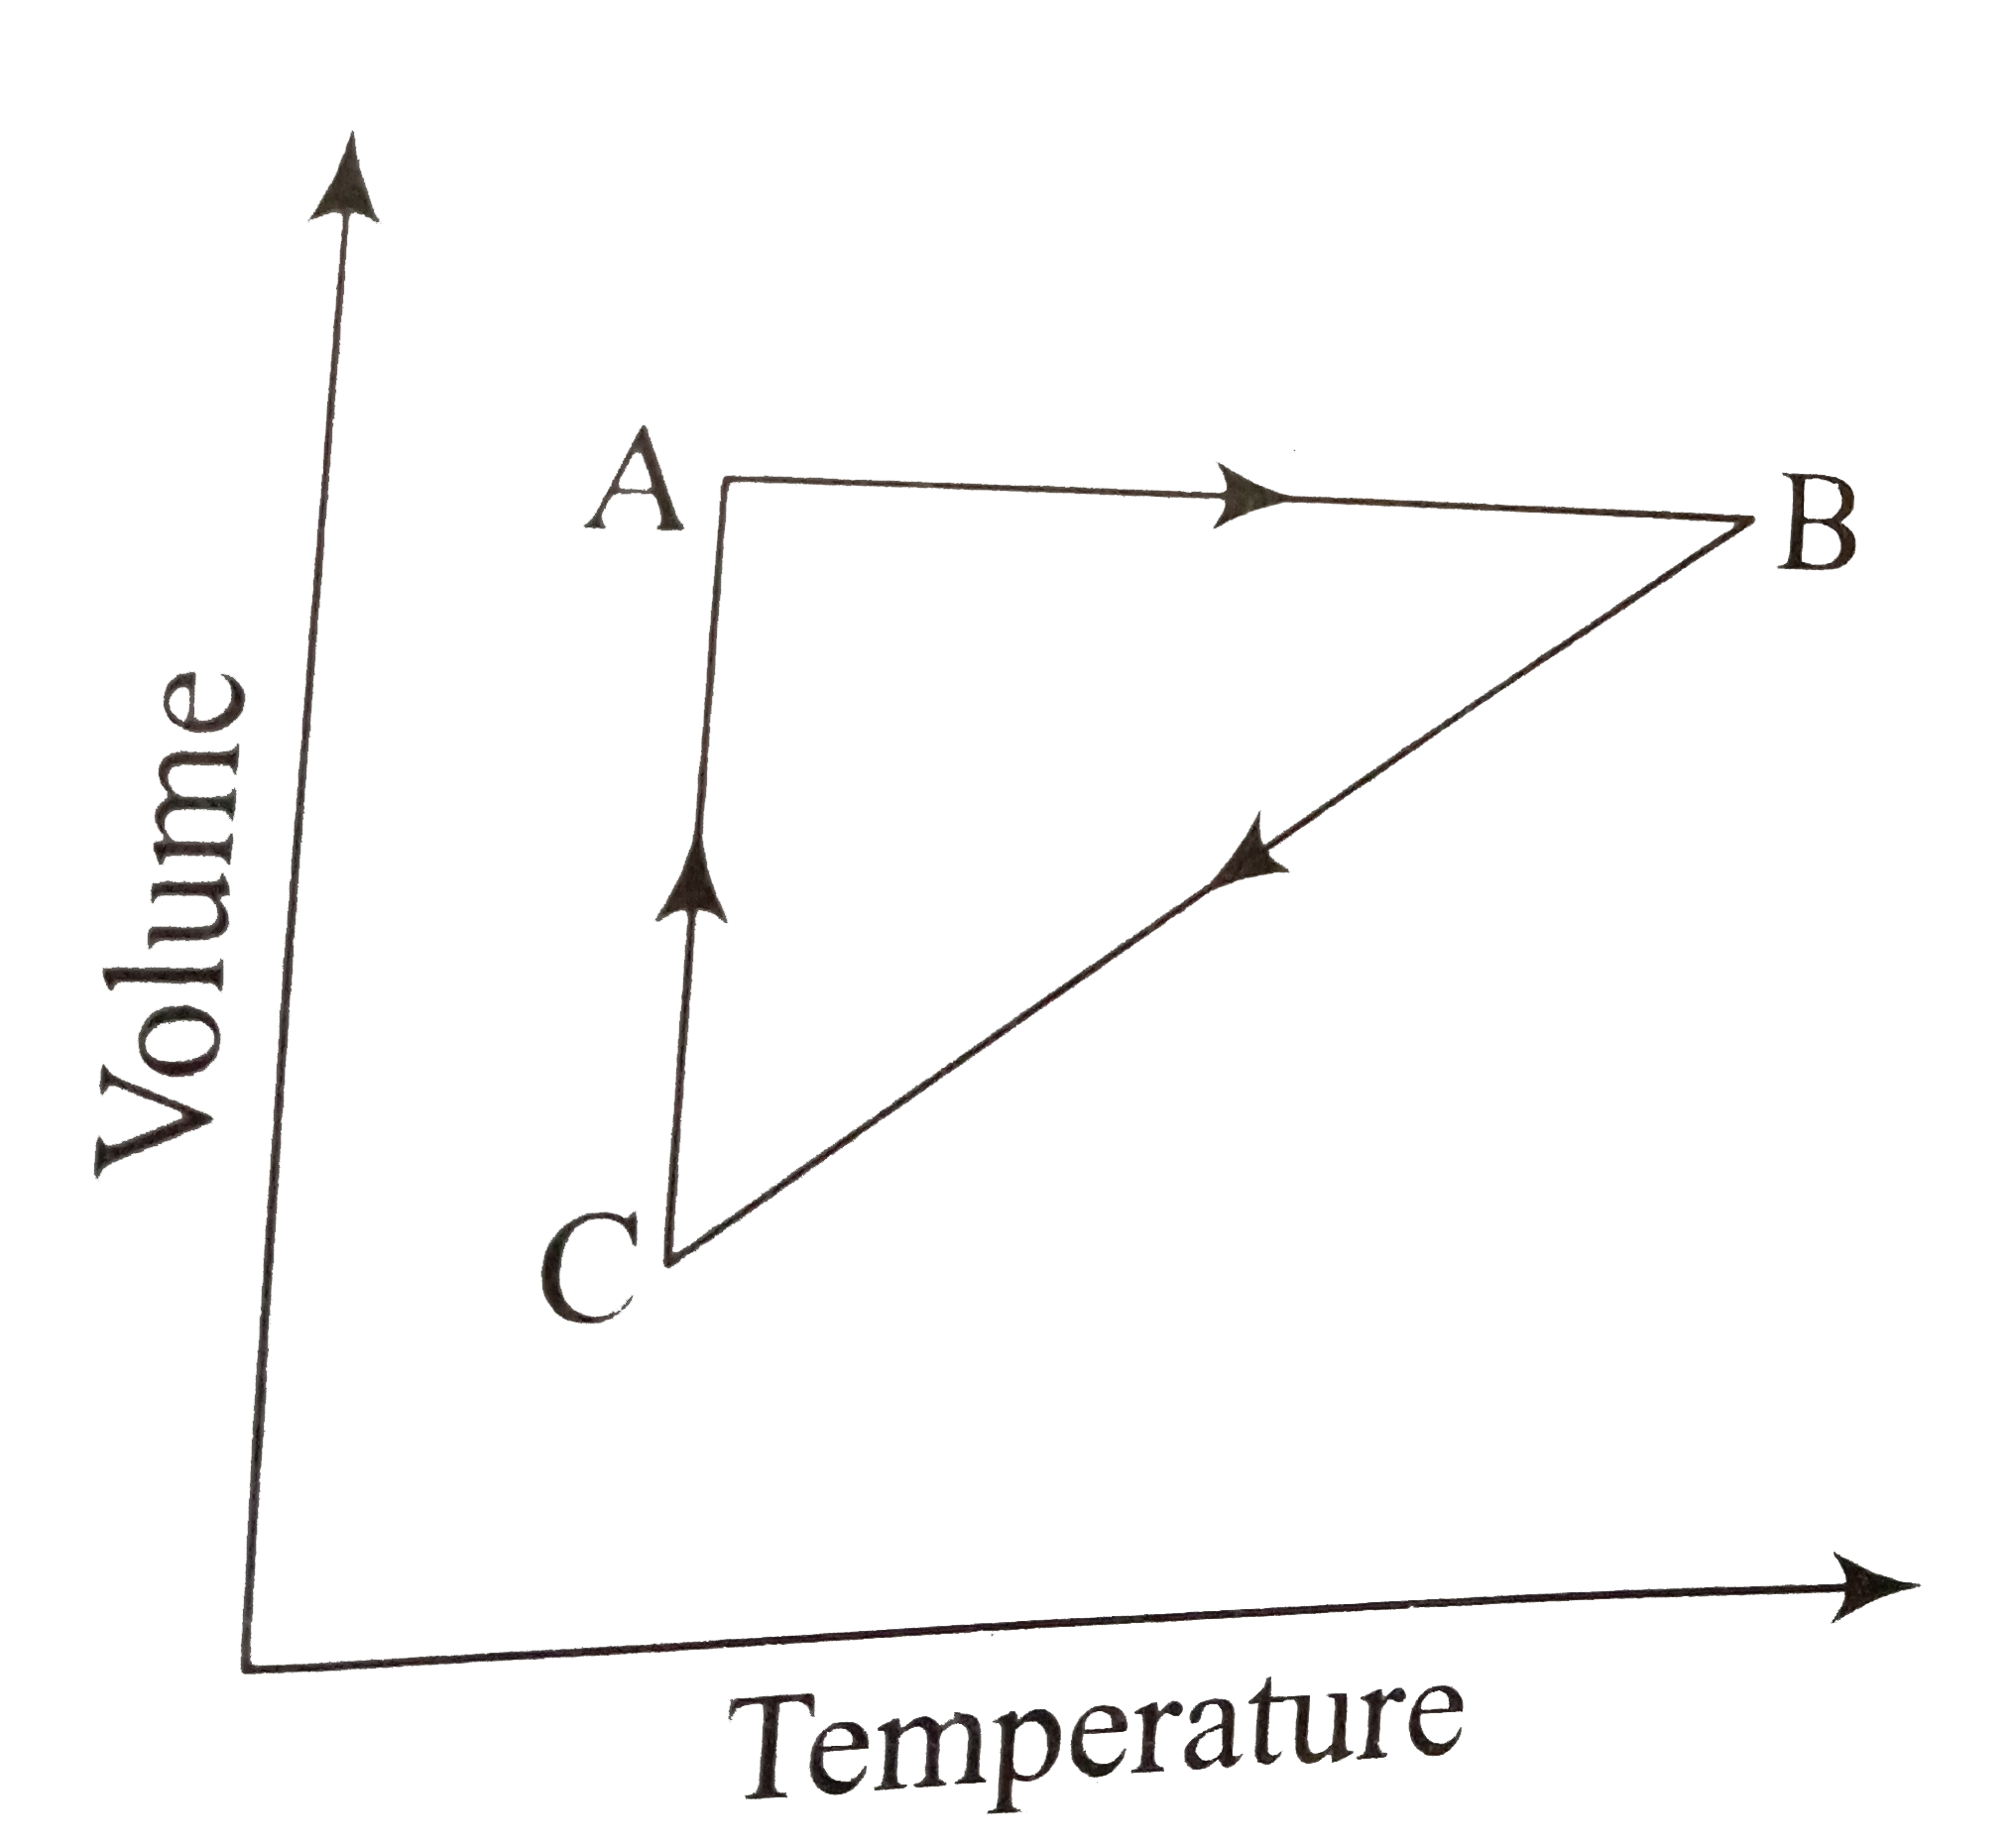
Five mole of a gas put through a series of change as shown below graphically in a cyclic process. The processes A→B,B→C and C→A, respectively, are
 View Solution
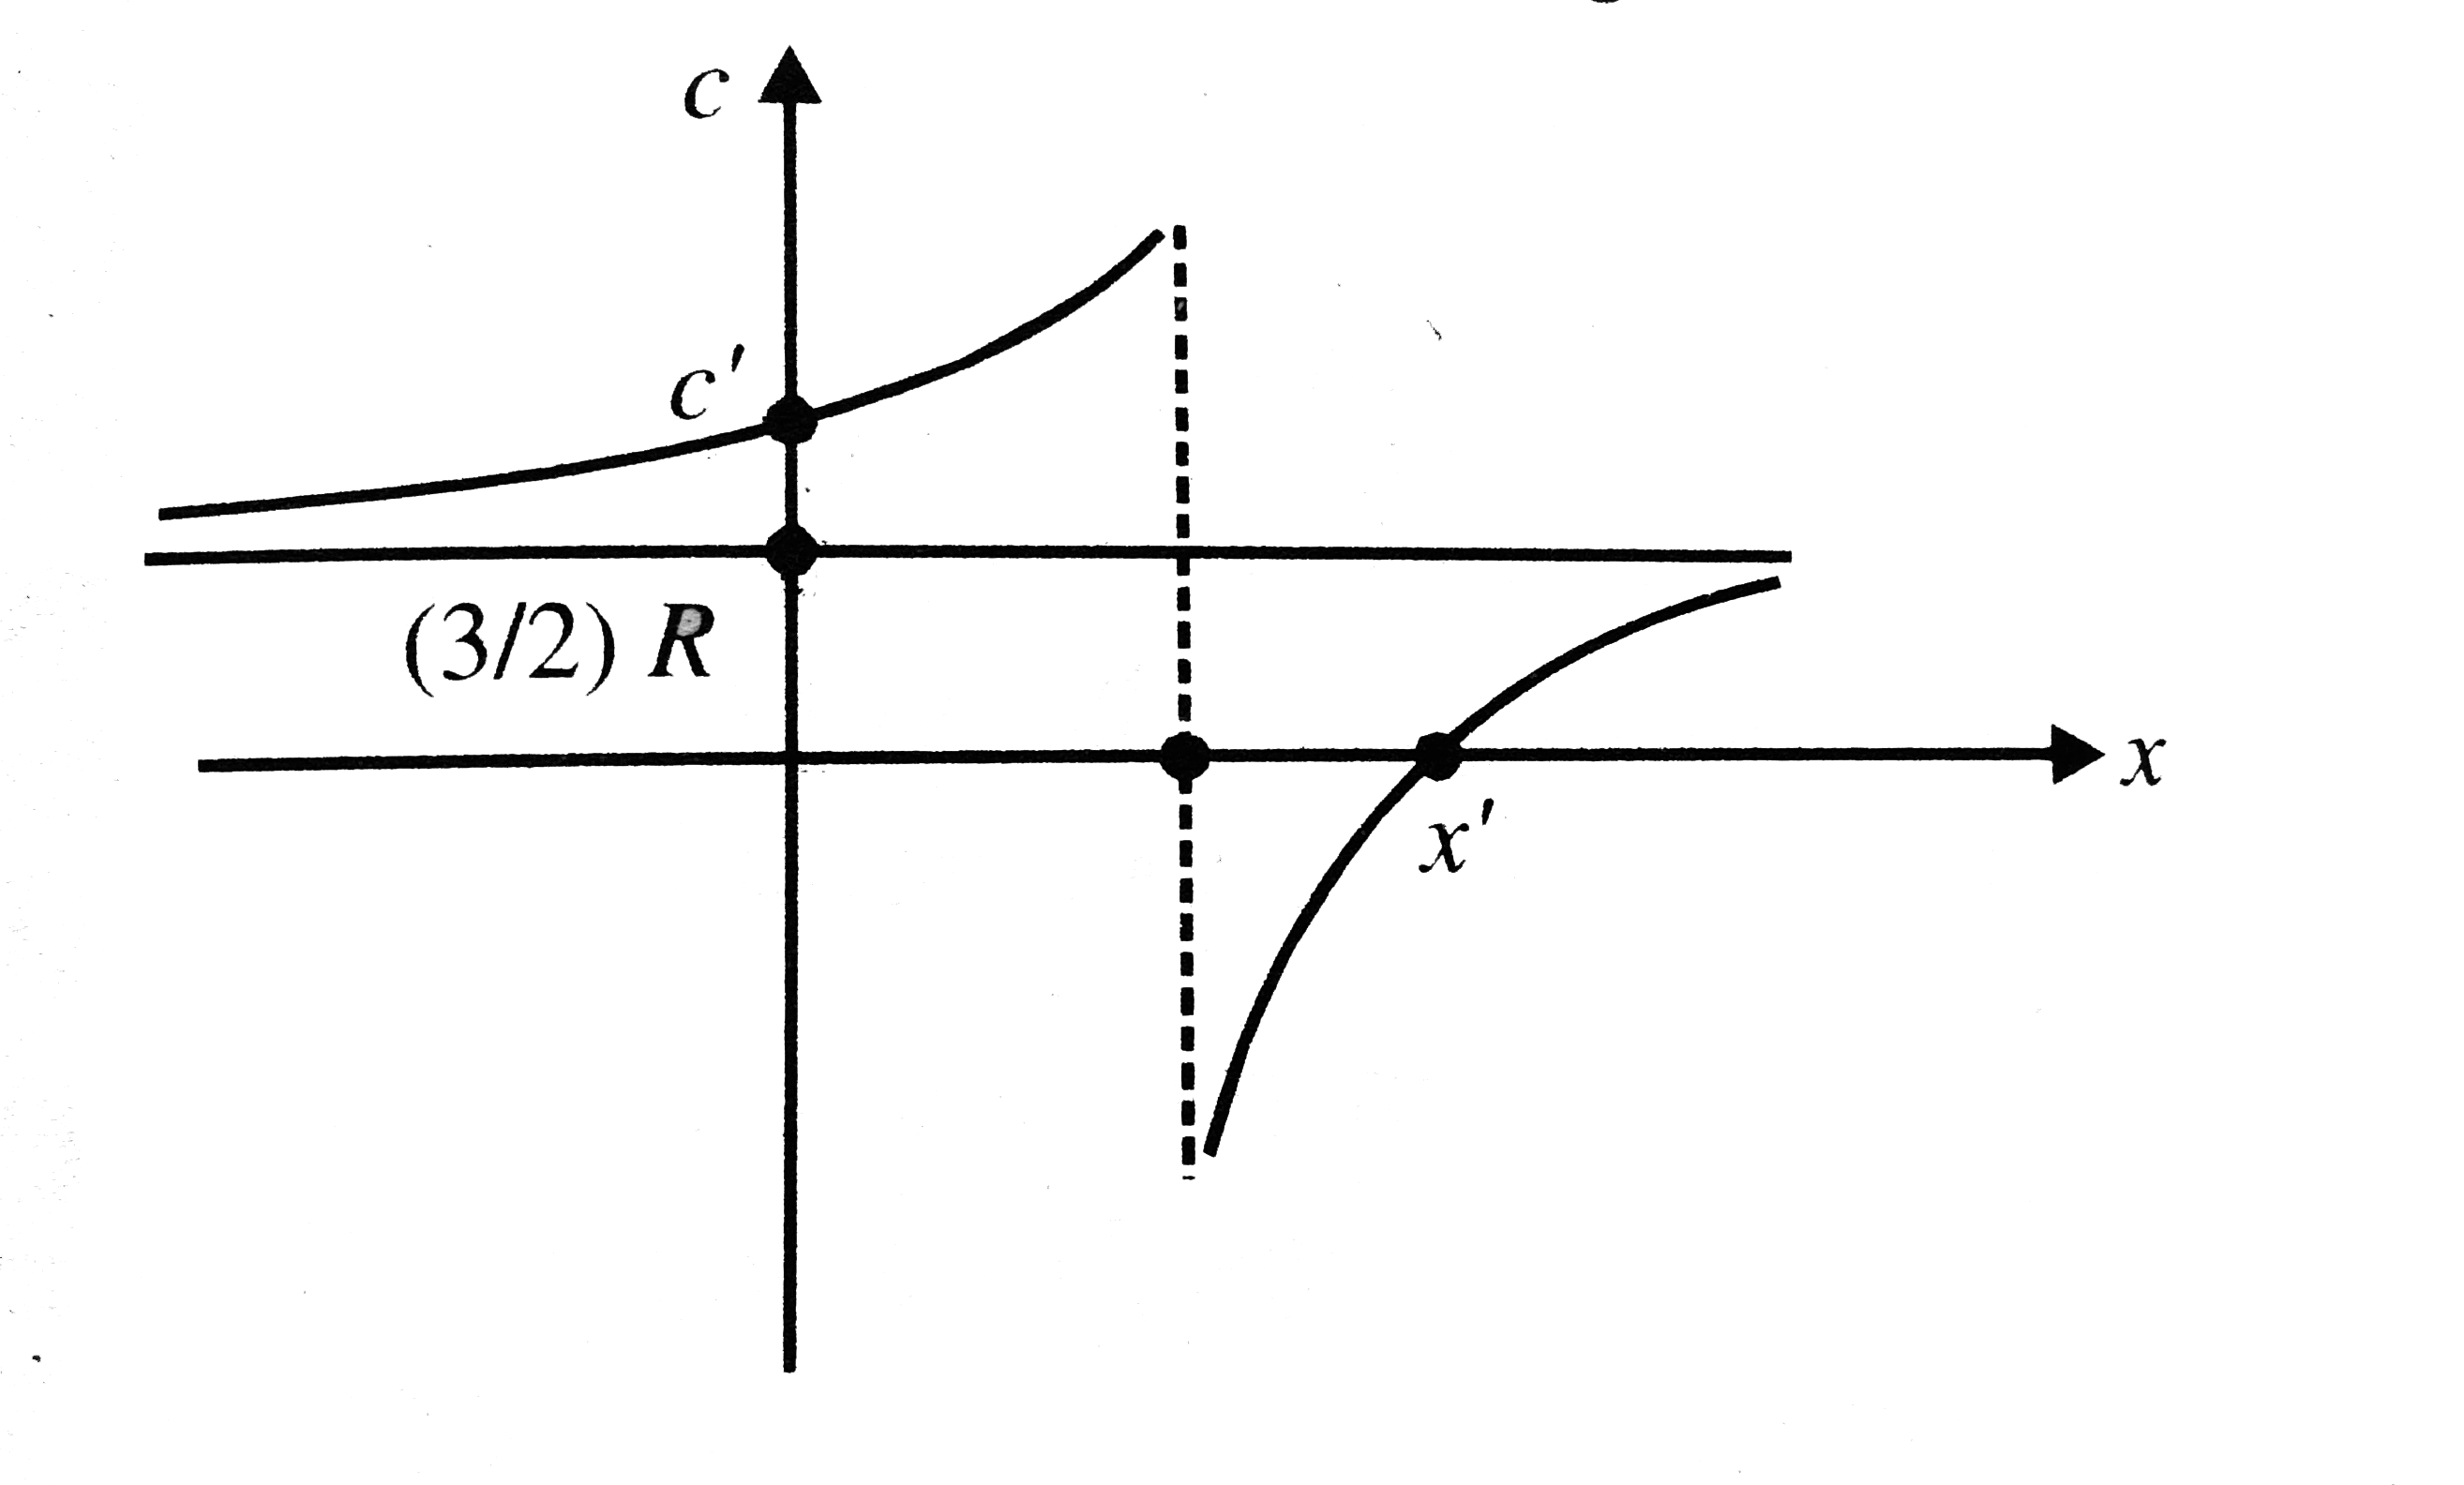
One mole of an ideal gas is taken along the process in which PV'= constant. The graph shown represents the variation of molar heat capacity of such a gas with respect to x. The value of c' and x'c respectively, are given by
 View Solution
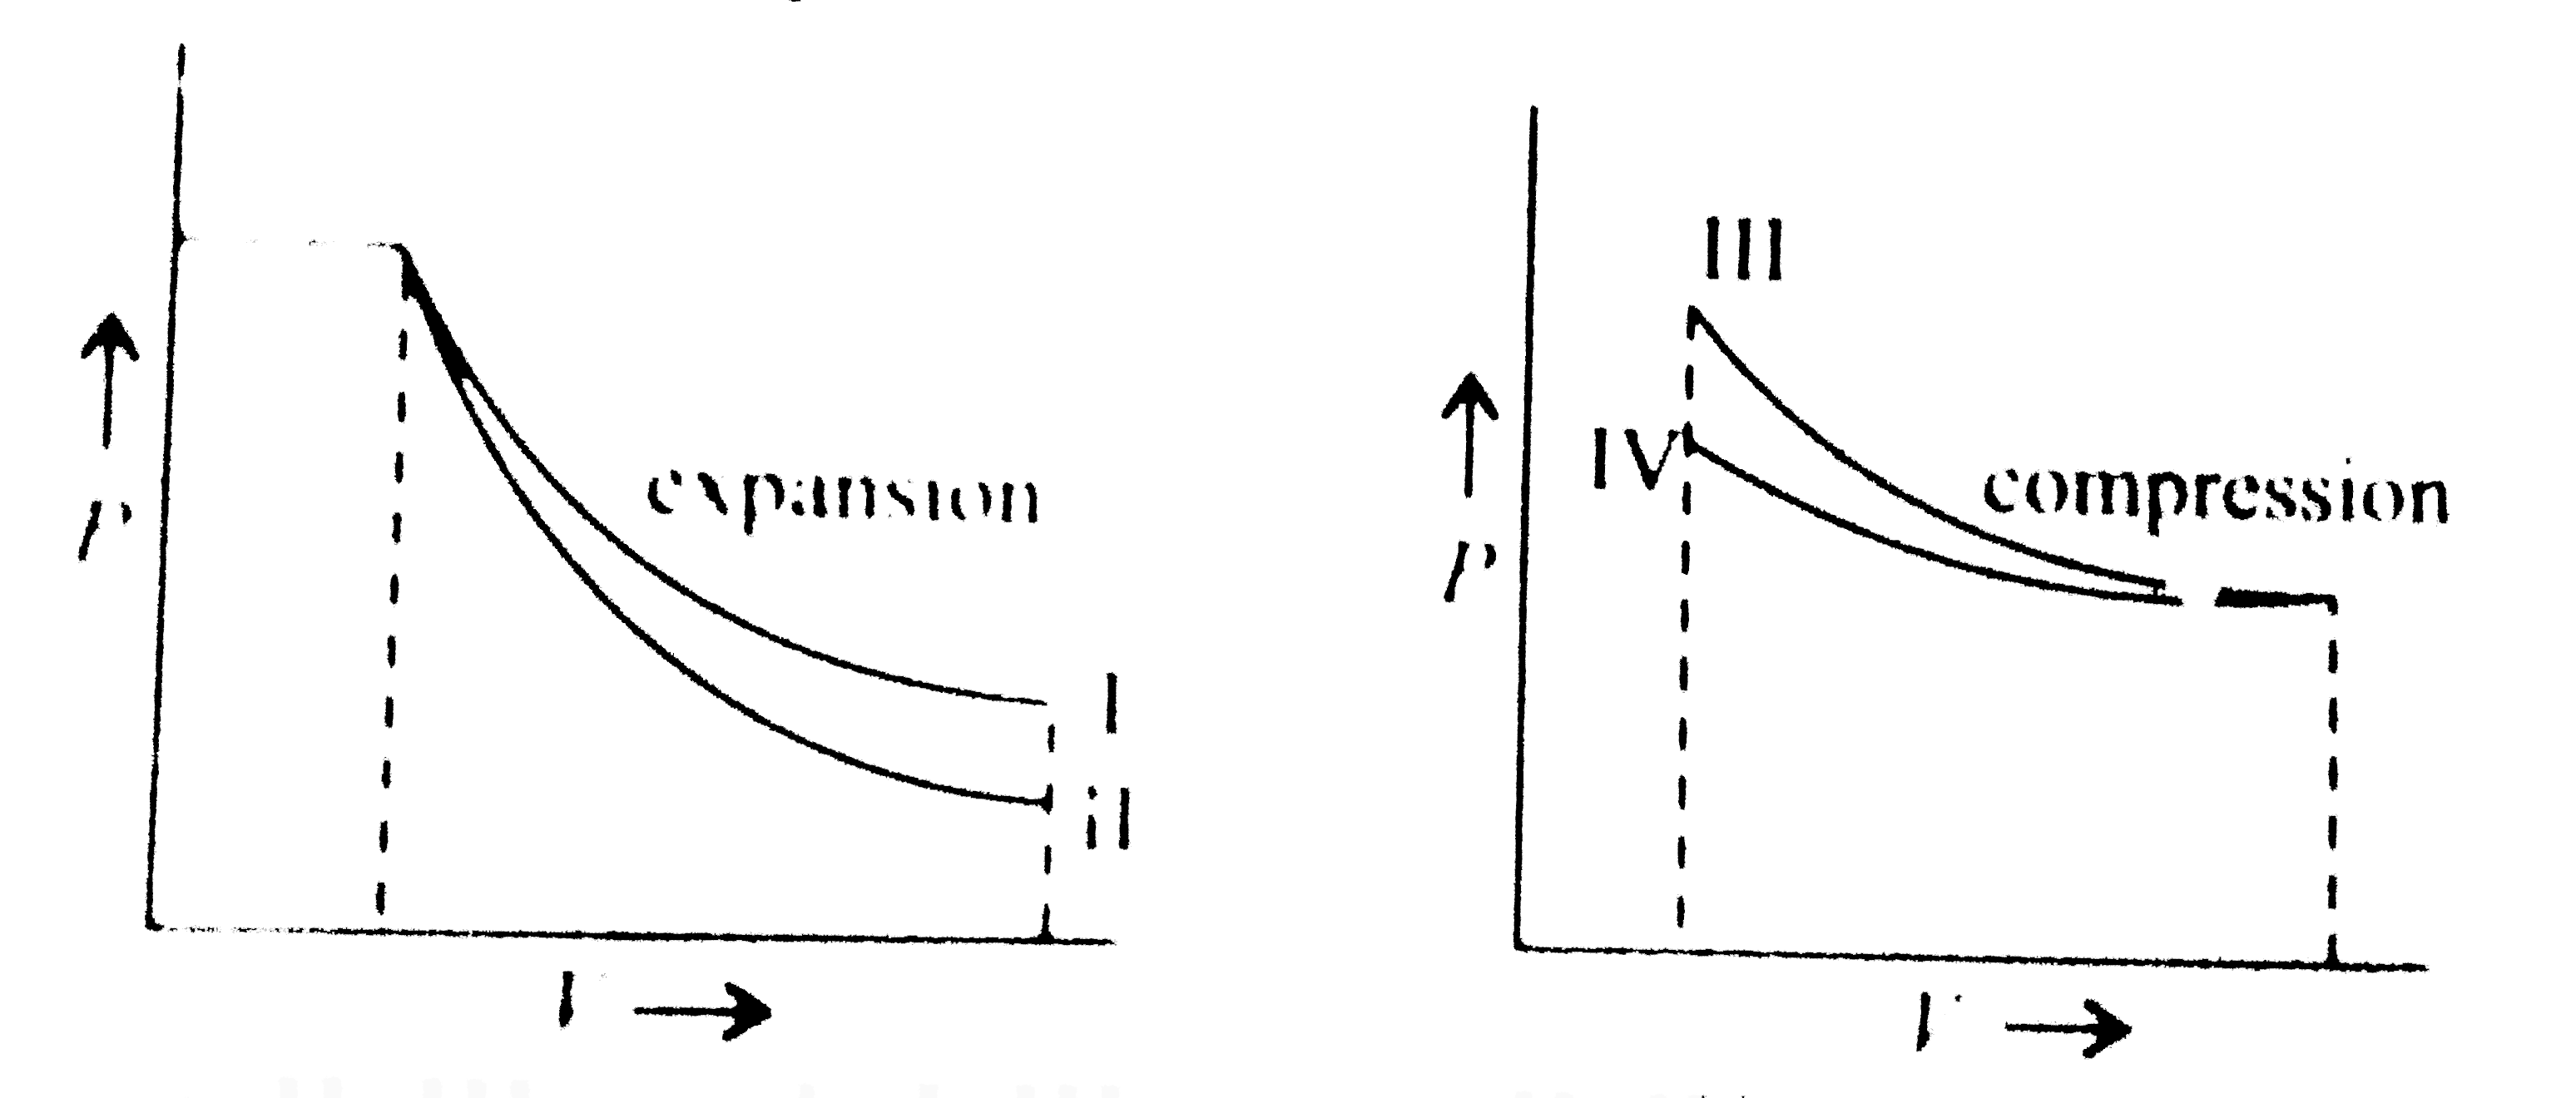
Which of the following graphs given below show (s) adiabatic process?
 View Solution


