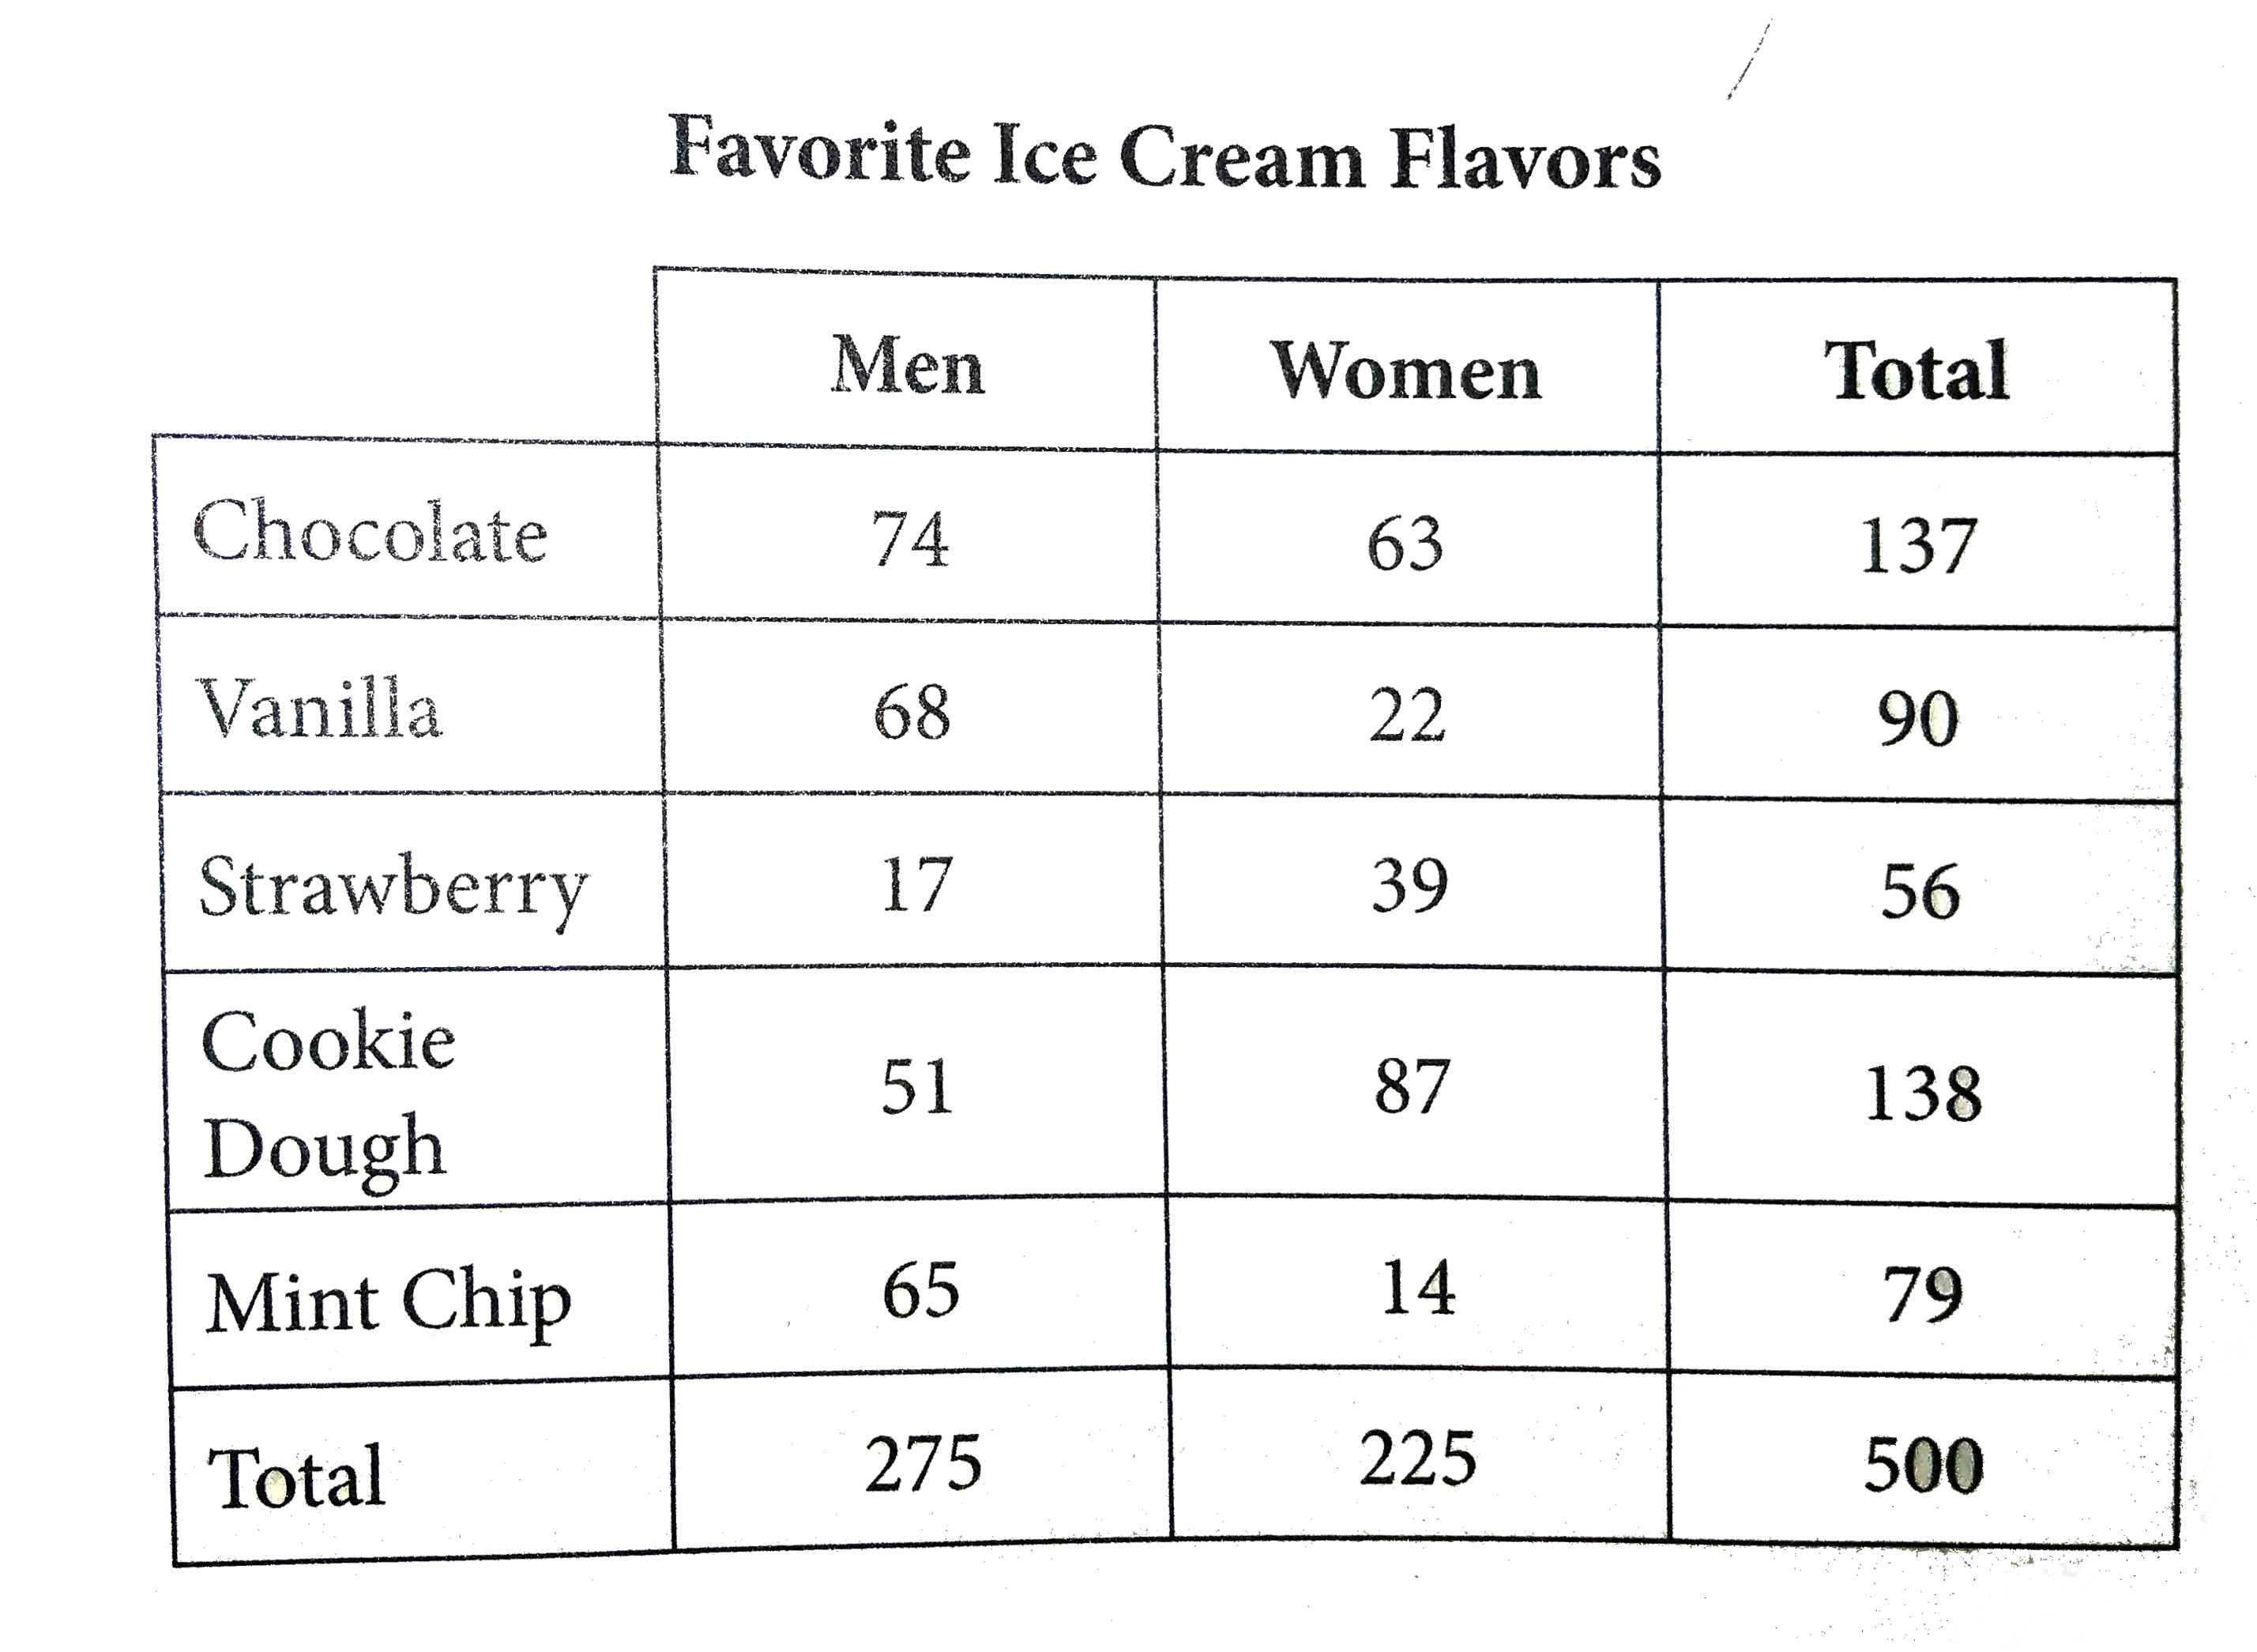
The table above shows the result of a random survey of 500 men and women. Each individual chose a flavor of ice cream that was his or her favorite.
Q. Approximately what percent of the men chose mint chip as their favorite ice cream flavor?
A
0.25
B
0.5
C
0.65
D
0.8
Video Solution
Text Solution
The correct Answer is:A
|
Answer
Step by step video, text & image solution for The table above shows the result of a random survey of 500 men and women. Each individual chose a flavor of ice cream that was his or her favorite. Q. Approximately what percent of the men chose mint chip as their favorite ice cream flavor? by Maths experts to help you in doubts & scoring excellent marks in Class 12 exams.
Updated on:21/07/2023Topper's Solved these Questions
- PROBLEM SETSBook:PRINCETONChapter:PROBLEM SETSExercise:PROBLEM SET 9: EXPONENTS, ROOTS, AND EQUATIONS
Explore 11 Videos
- PROBLEM SETSBook:PRINCETONChapter:PROBLEM SETSExercise:PROBLEM SET 10: LINES, ANGLES, AND COORDINATES
Explore 11 Videos
- PROBLEM SETSBook:PRINCETONChapter:PROBLEM SETSExercise:PROBLEM SET 7: AVERAGES, RATIOS, PROPORTIONS, AND PROBABILITIES
Explore 11 Videos
- PRACTICE TEST 4Book:PRINCETONChapter:PRACTICE TEST 4Exercise:Math Test-Calculator
Explore 38 Videos
- SAT MATH: THE BIG PICTUREBook:PRINCETONChapter:SAT MATH: THE BIG PICTUREExercise:Example
Explore 4 Videos
Knowledge Check

The table above shows the result of a random survey of 500 men and women. Each individual chose a flavor of ice cream that was his or her favorite.
Q. If a woman is chosen at random, what is the probability that her favorite ice cream flavor is strawberry?A0.06B0.09C0.11D0.17
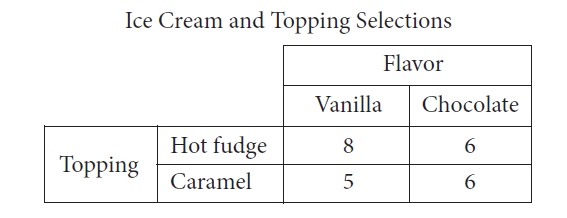
The table above shows the flavors of ice cream and the toppings chosen by the people at a party. Each person chose one flavor of ice cream and one topping. Of the people who chose vanilla ice cream, what fraction chose hot fudge as a topping?A825B513C1325D813
The table above shows the result of a survey of adults over 18. Each person had to pick one of 3 choices : looking forward to a televised game, looking forward to the commercials , or not planning to watch . Based on the table , if a woman was polled at random , what is the probability , as a percent , that she would respond that she was looking forward to the commercials ?A15B30C51D66

