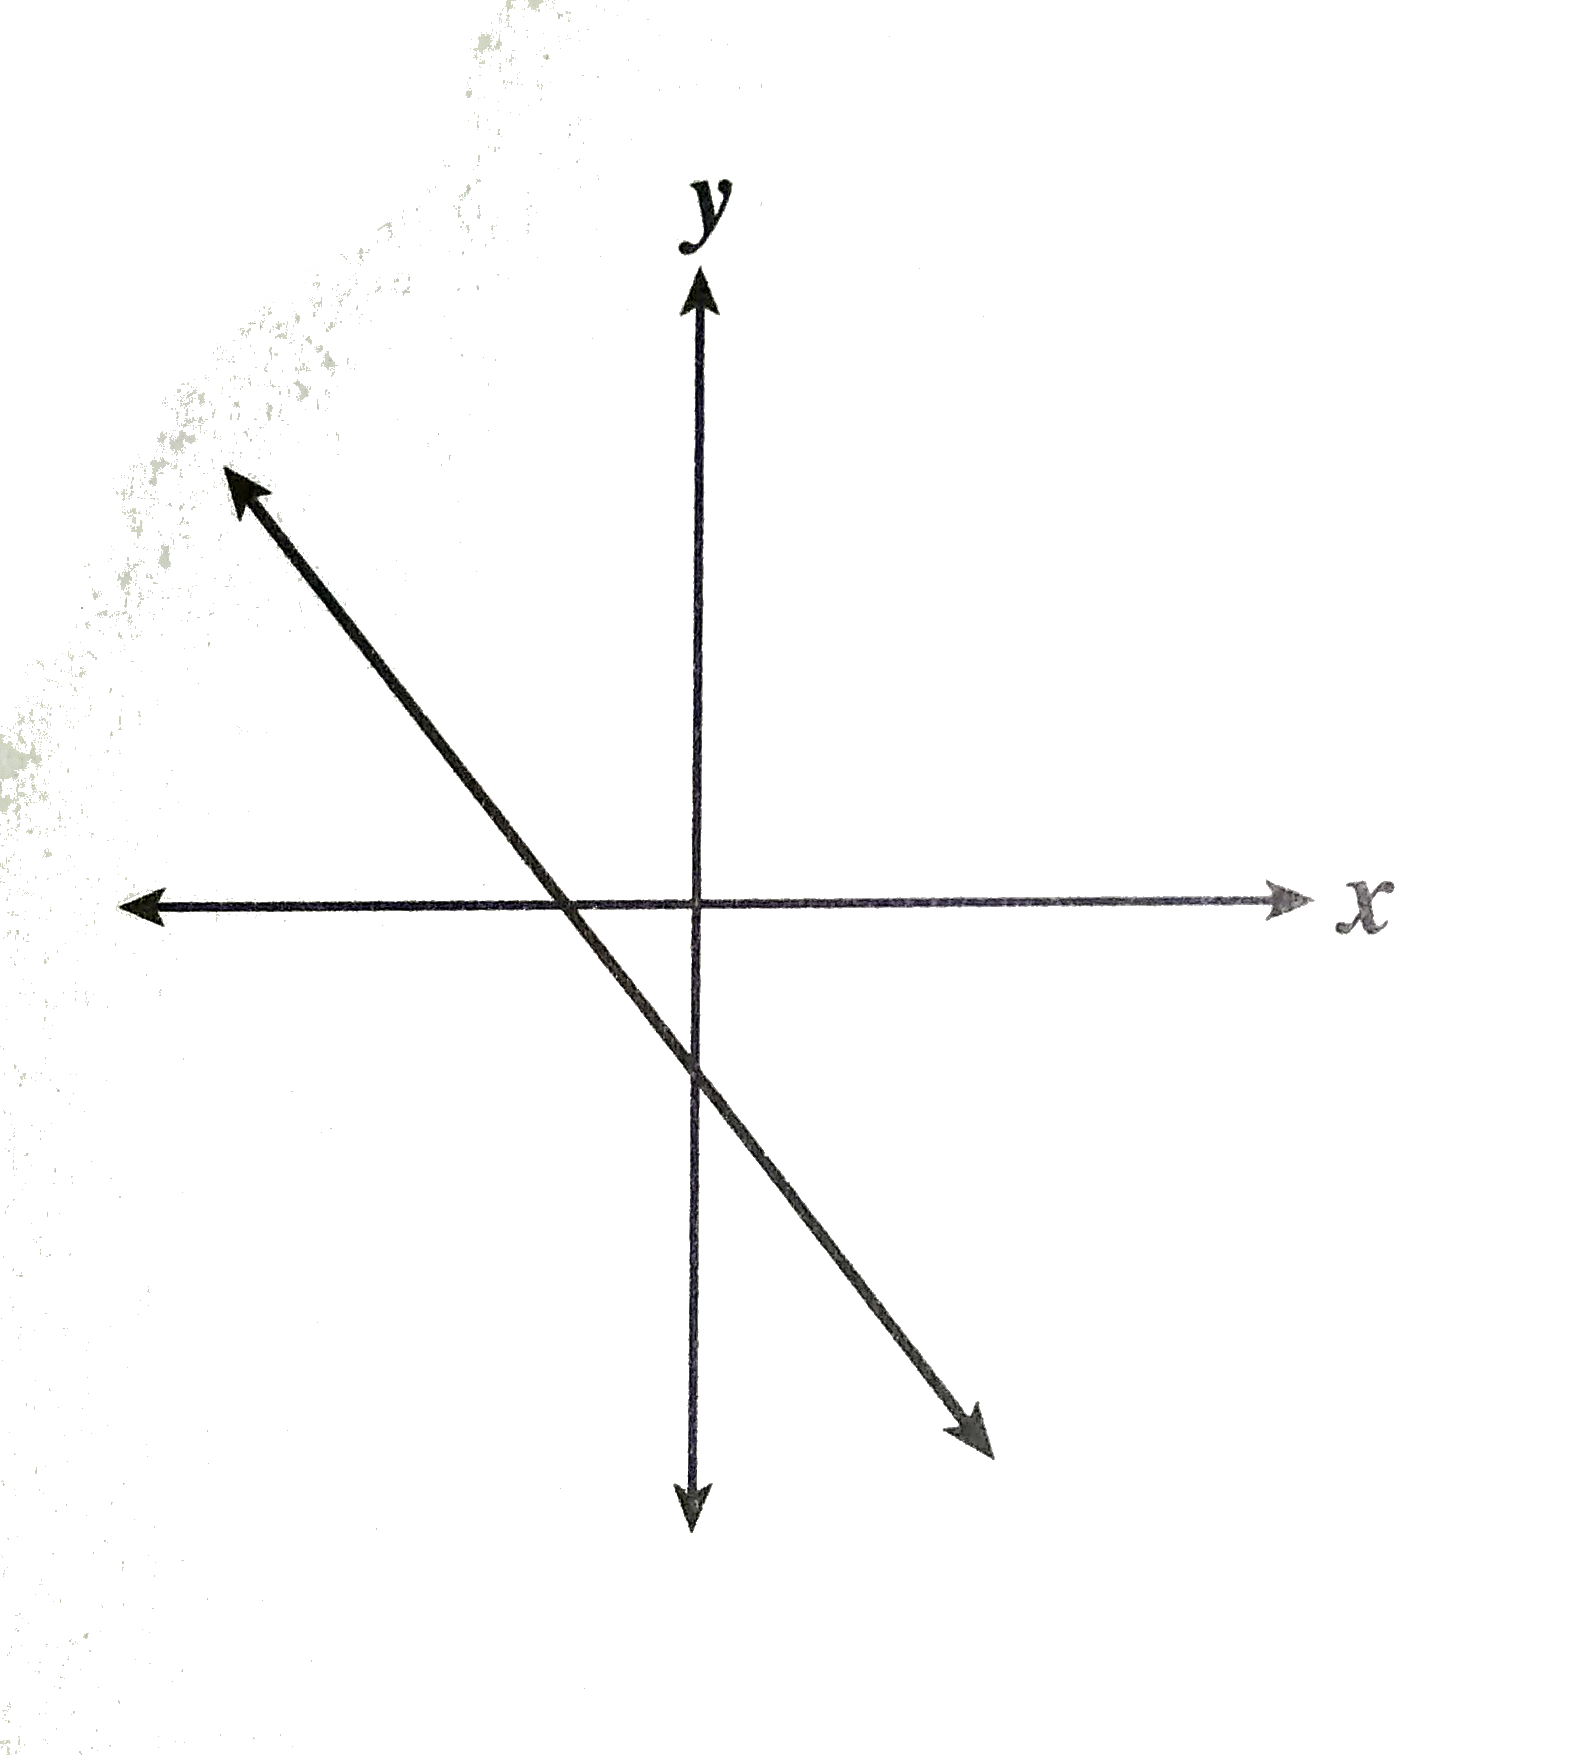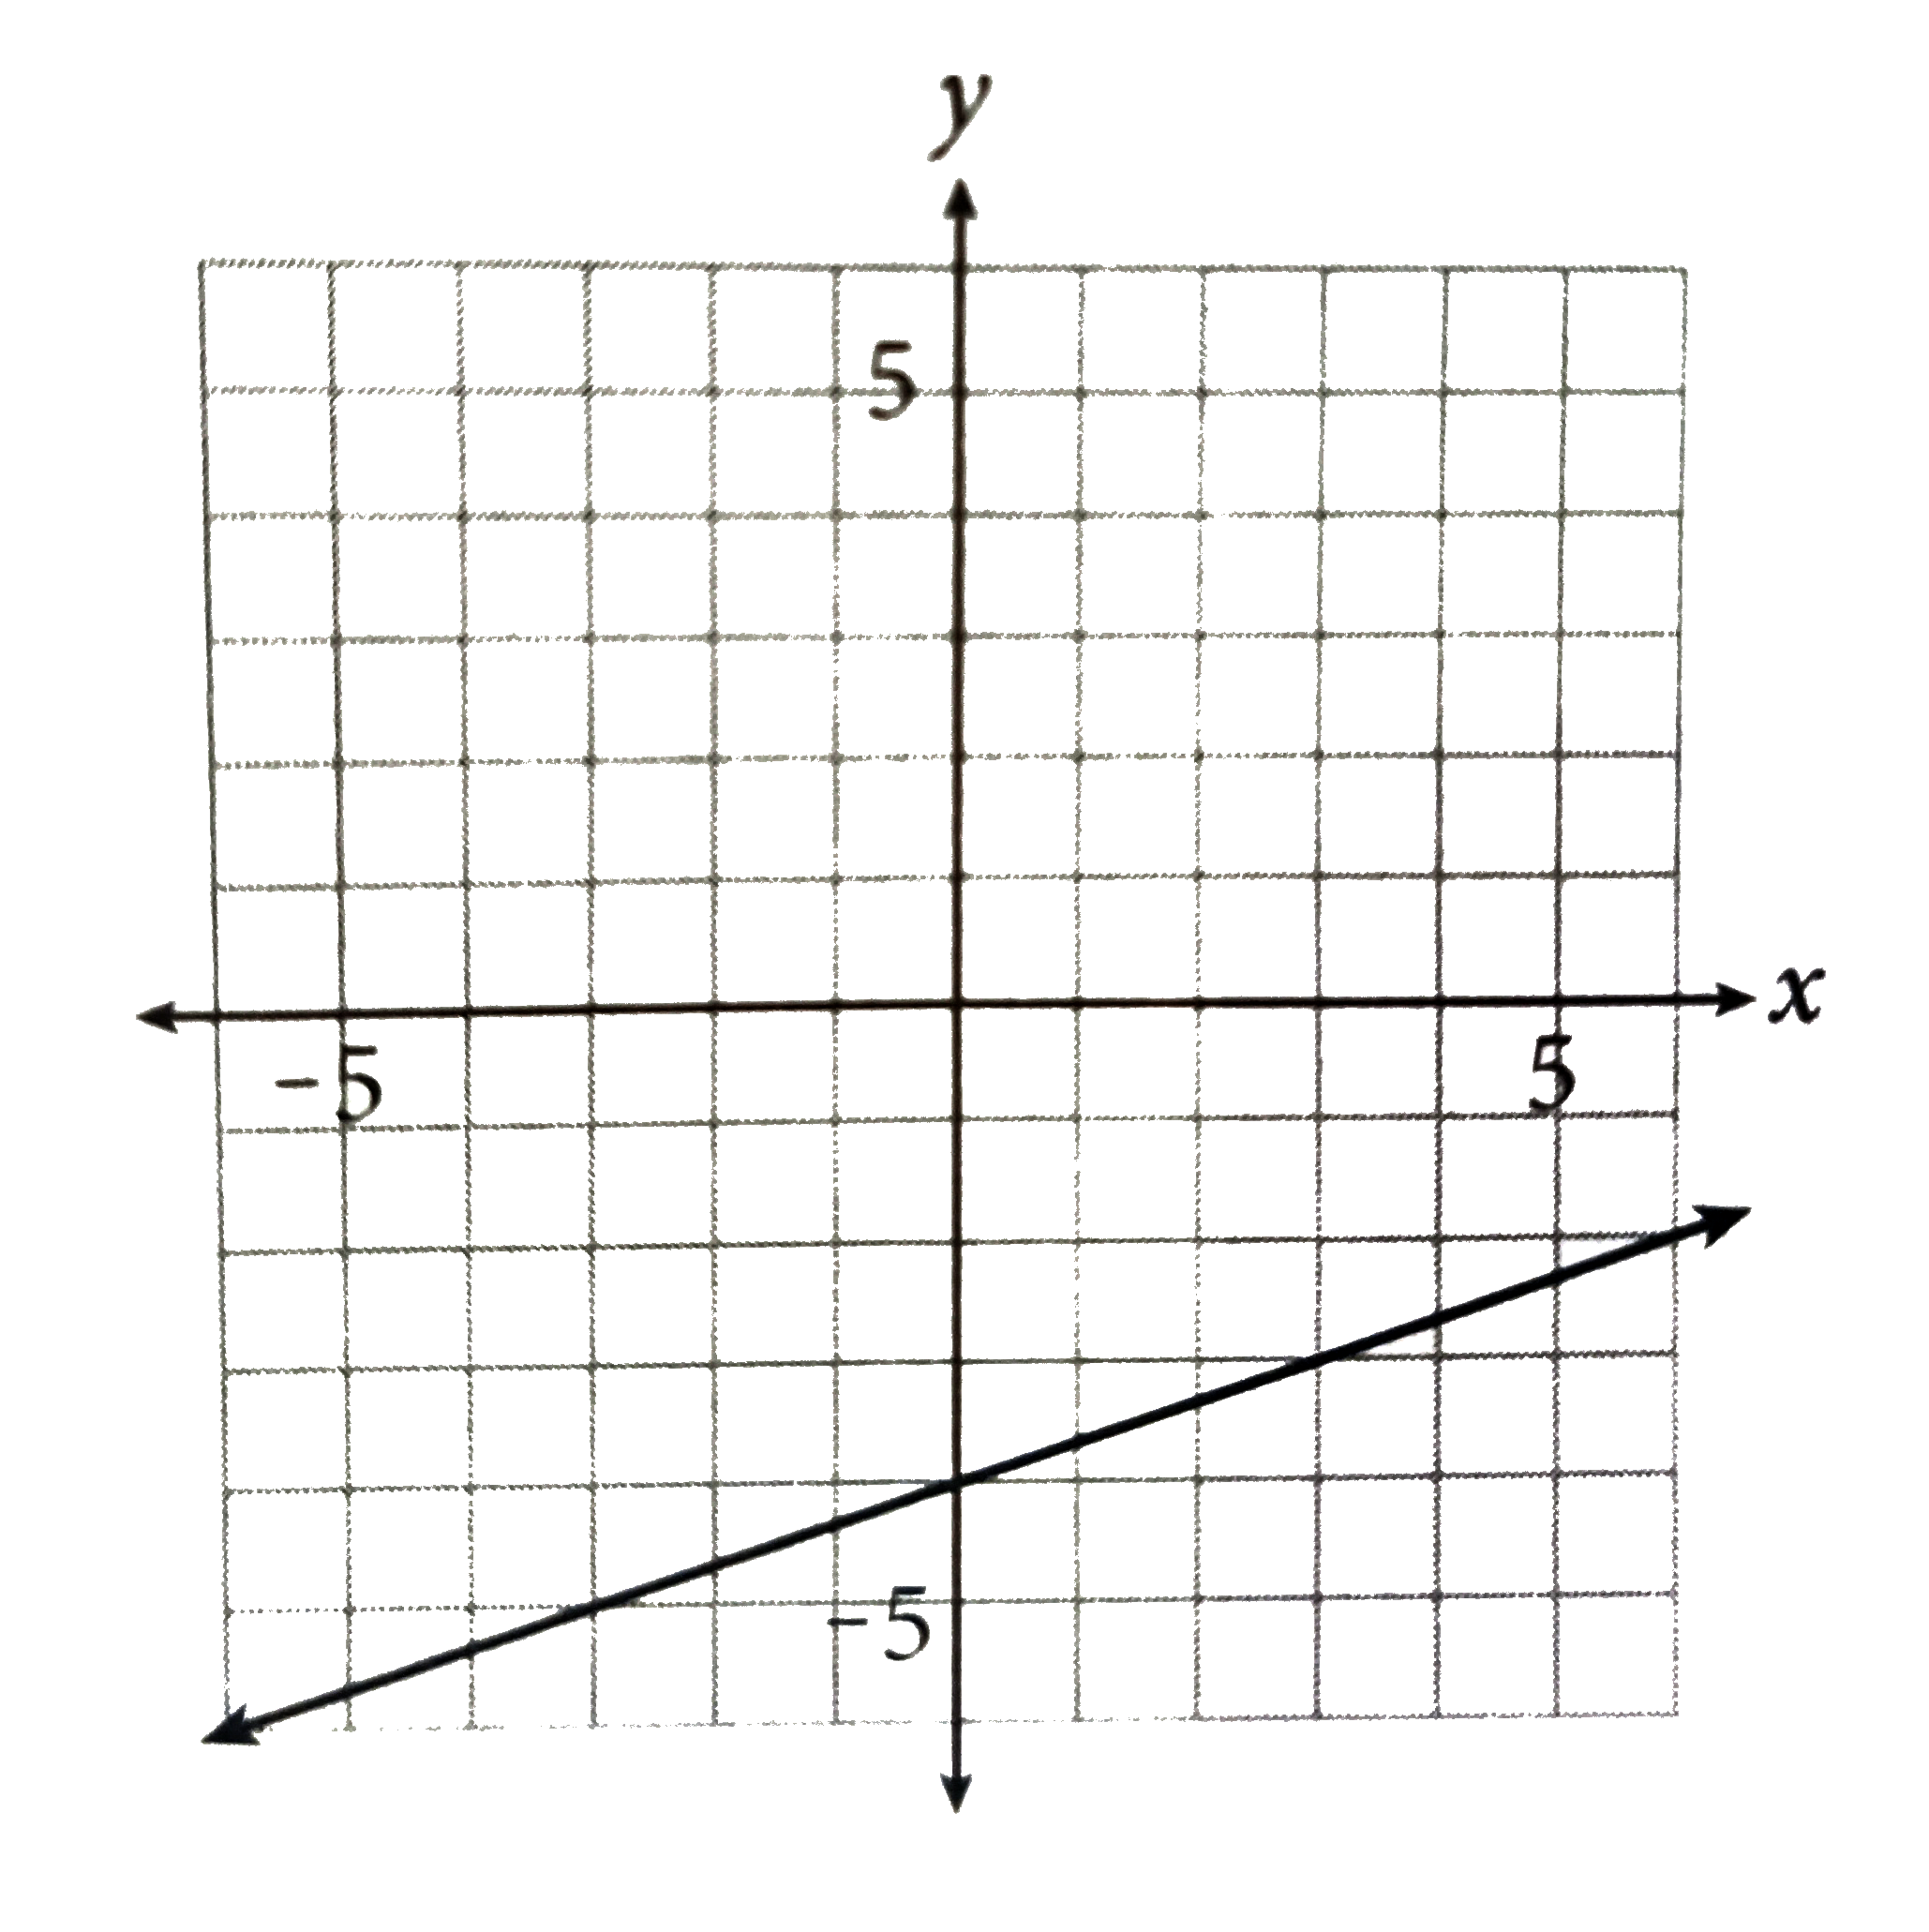
The graph shown represents which of the following equations ?
A
B
C
D
Video Solution
Text Solution
The correct Answer is:C
Use the gaph to identify the y-intercept and the slope of the line and then write an equaton in slope-intercept from, Once you have your equation, look for the answer choice that matches. The lines crosses the y-axis at so the y-intercetp, b, is -4. The line rises 1 unit for every 3 units that it runs to the rifght, so the slope, m, is The equation of the line is which matches (C ).
You could also graph each of the answer choices in your calculator to see which one mathches the given graph, but this is not the most time-efficient strategy. You also have to be very careful when entering fractions-to graph (C).for example, you would enter
|
Topper's Solved these Questions
- LINEAR EQUATIONS AND GRAPHSBook:KAPLANChapter:LINEAR EQUATIONS AND GRAPHSExercise:TRY YOUR OWN
Explore 26 Videos
- LINEAR EQUATIONS AND GRAPHSBook:KAPLANChapter:LINEAR EQUATIONS AND GRAPHSExercise:SOLVING EQUATIONS
Explore 1 Video
- INEQUALITIESBook:KAPLANChapter:INEQUALITIESExercise:MODELING REAL-LIFE SITUATIONS WITH INEQUALITIES
Explore 1 Video
- PAIRED PASSAGES AND PRIMARY SOURCE PASSAGES Book:KAPLANChapter:PAIRED PASSAGES AND PRIMARY SOURCE PASSAGES Exercise:HOW MUCH HAVE YOU LEARNED
Explore 11 Videos
Similar Questions
Knowledge Check
The given acceleration-time graph represents which of the following physical situation?
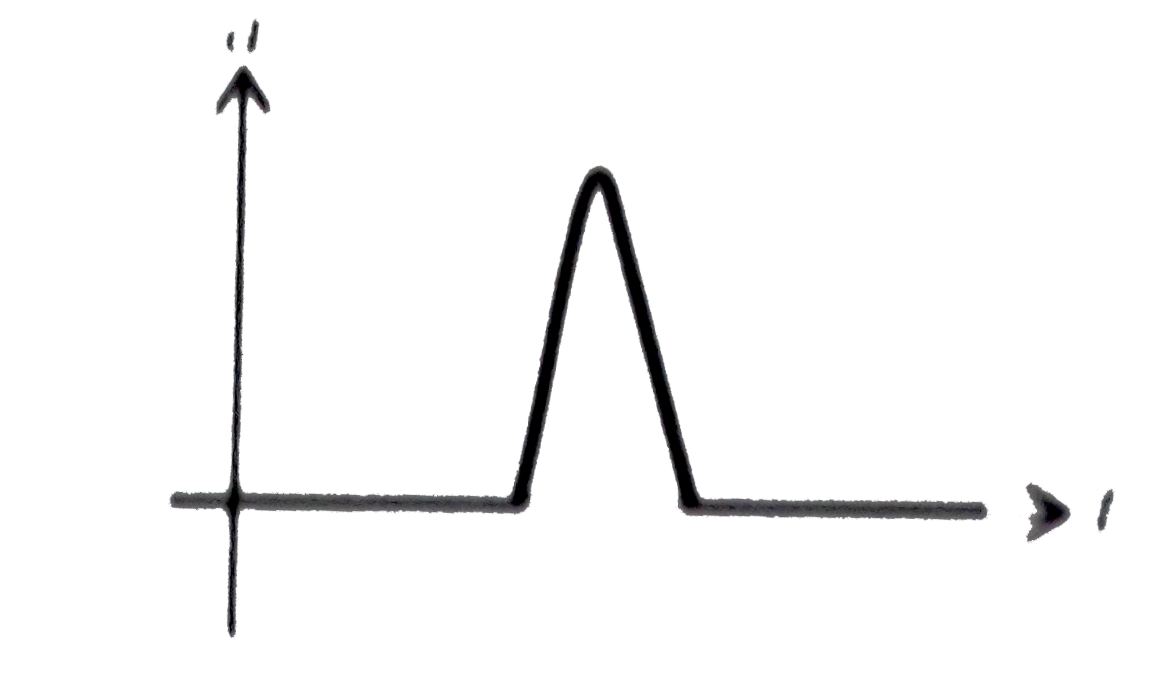 AA cricket ball moving with a uniform speed is hit with a bat for a very short time interval.BA ball is falling freely from the top of a tower.CA car moving with constant velocity on a straight road.DA football is kicked into the air vertically upwards.
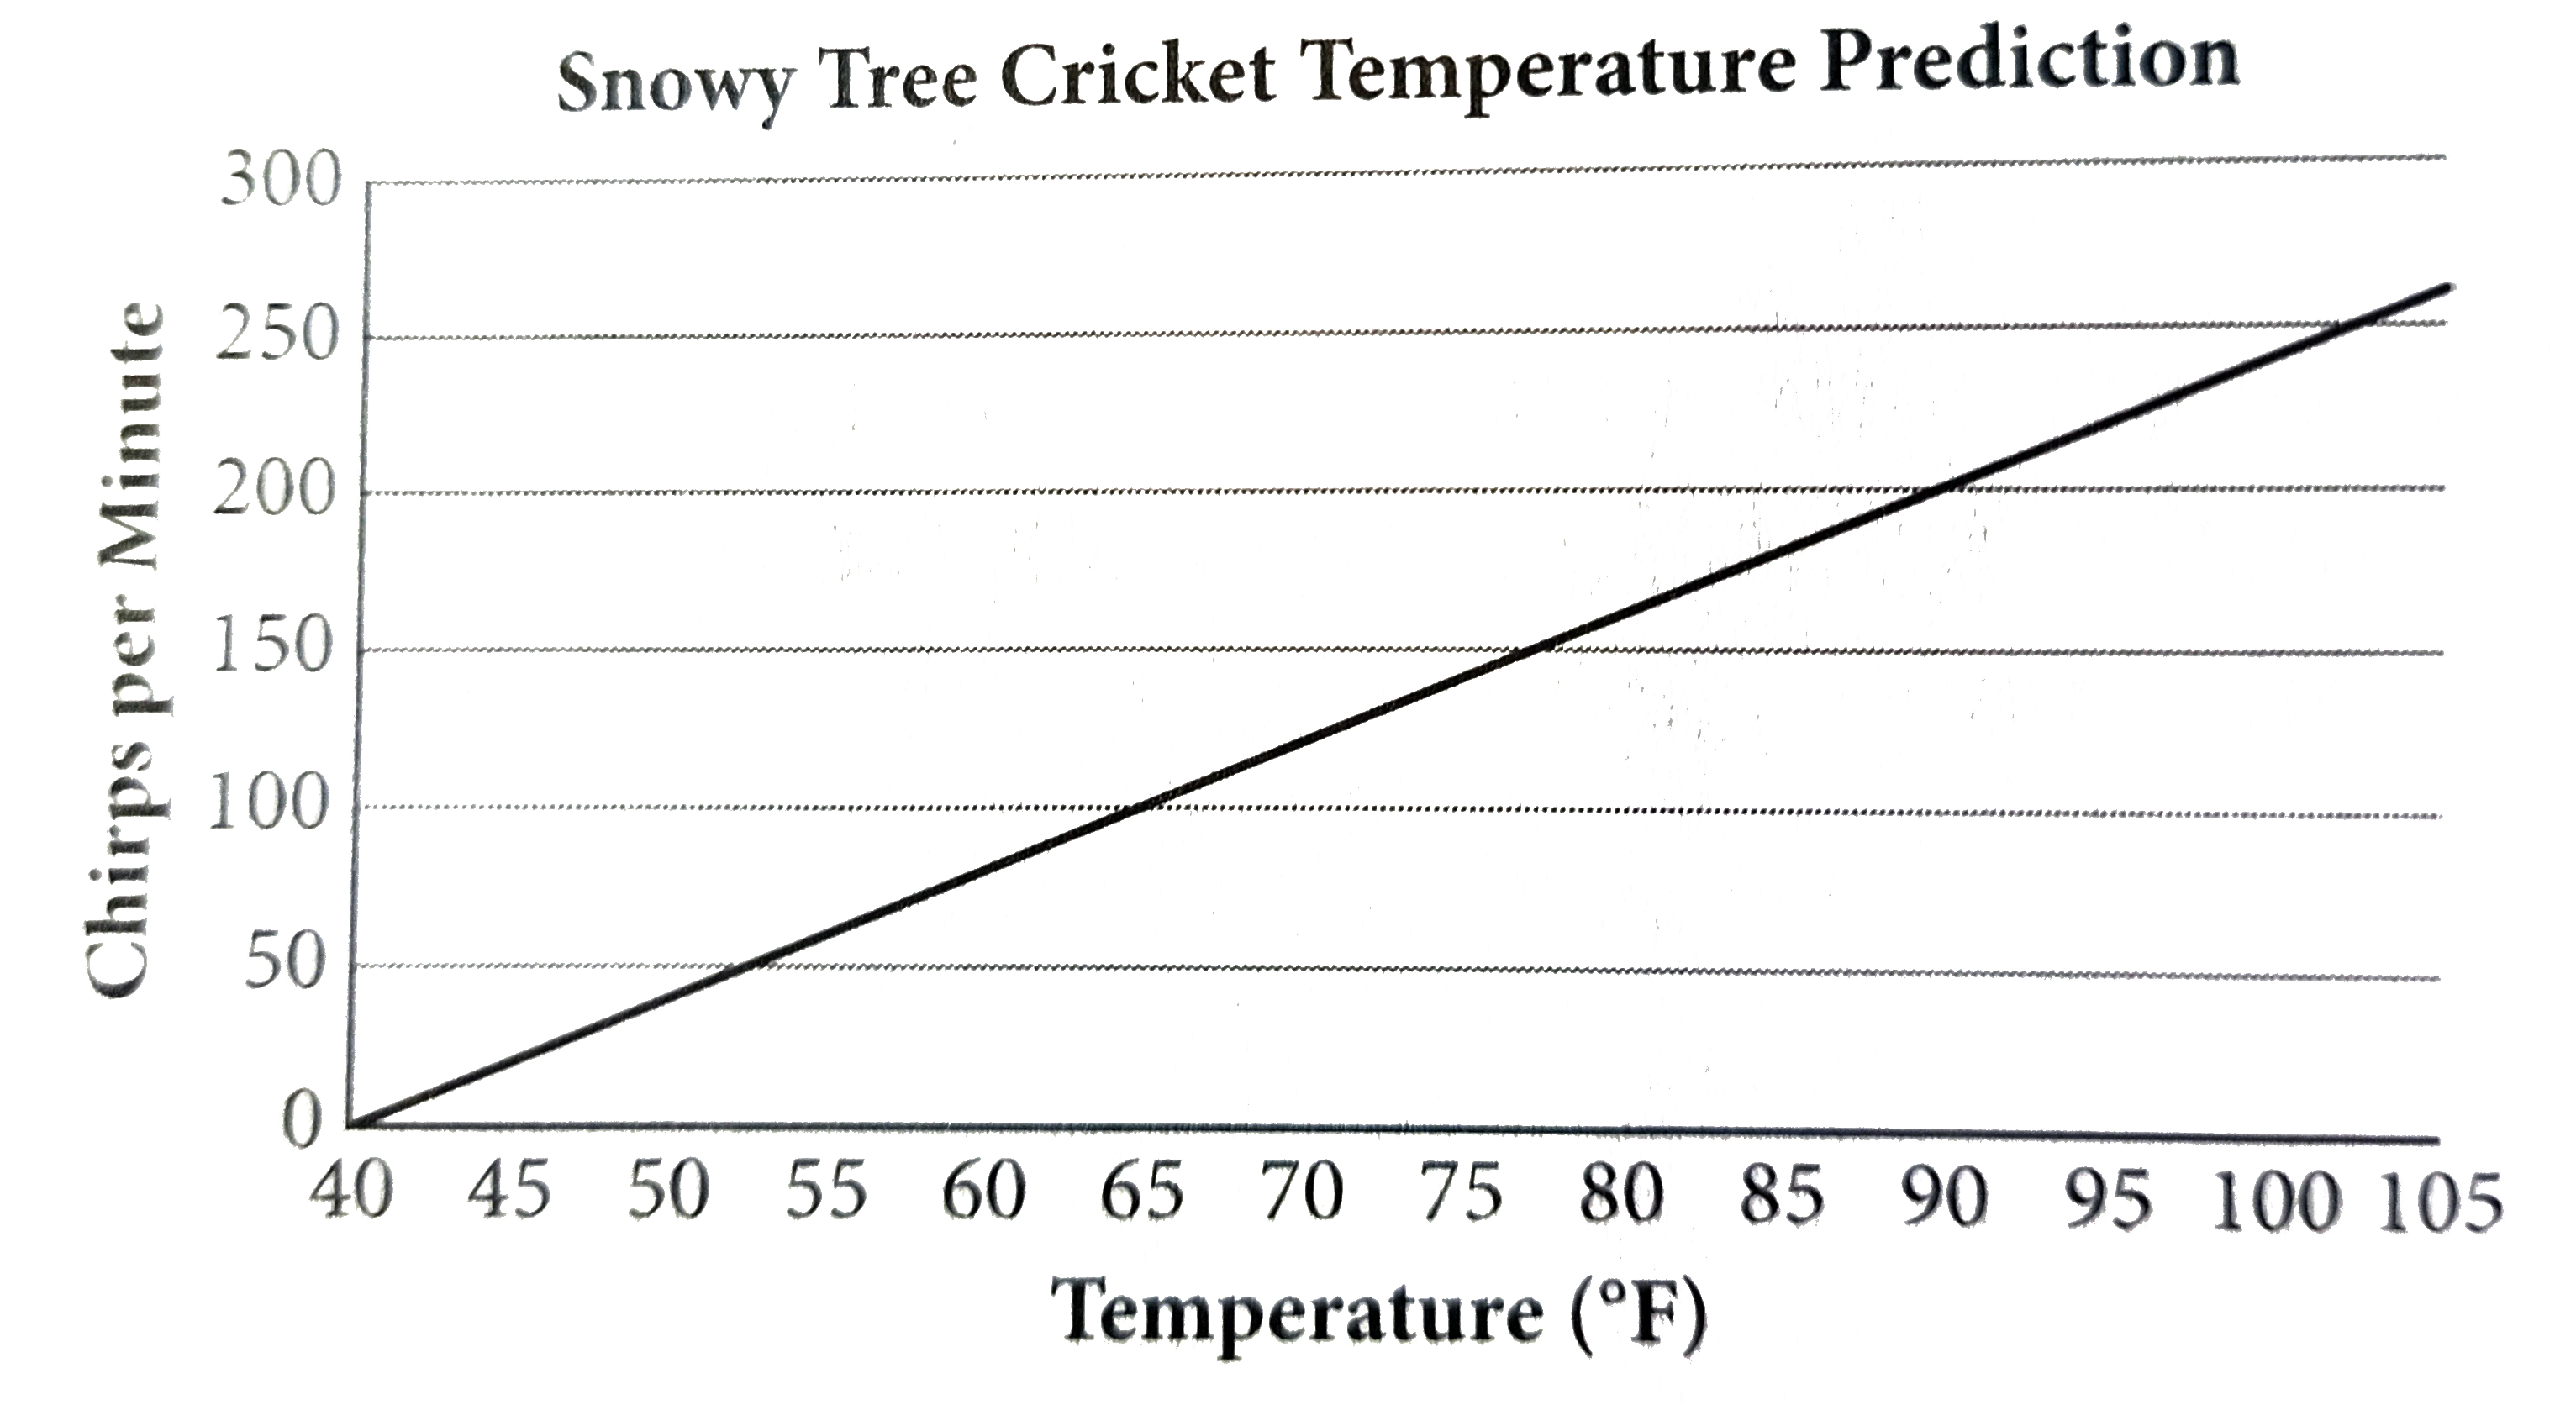
The graph shows the correlation between ambient air temperature, t, in degress Fahrenheit and the number of chirps, c, per minute that a snowy tree cricket makes at that temperature. Which of the following equations represents the line shown in the graph ?Ac=4t−160Bc=14t−160Cc=12t−40Dc=4t+160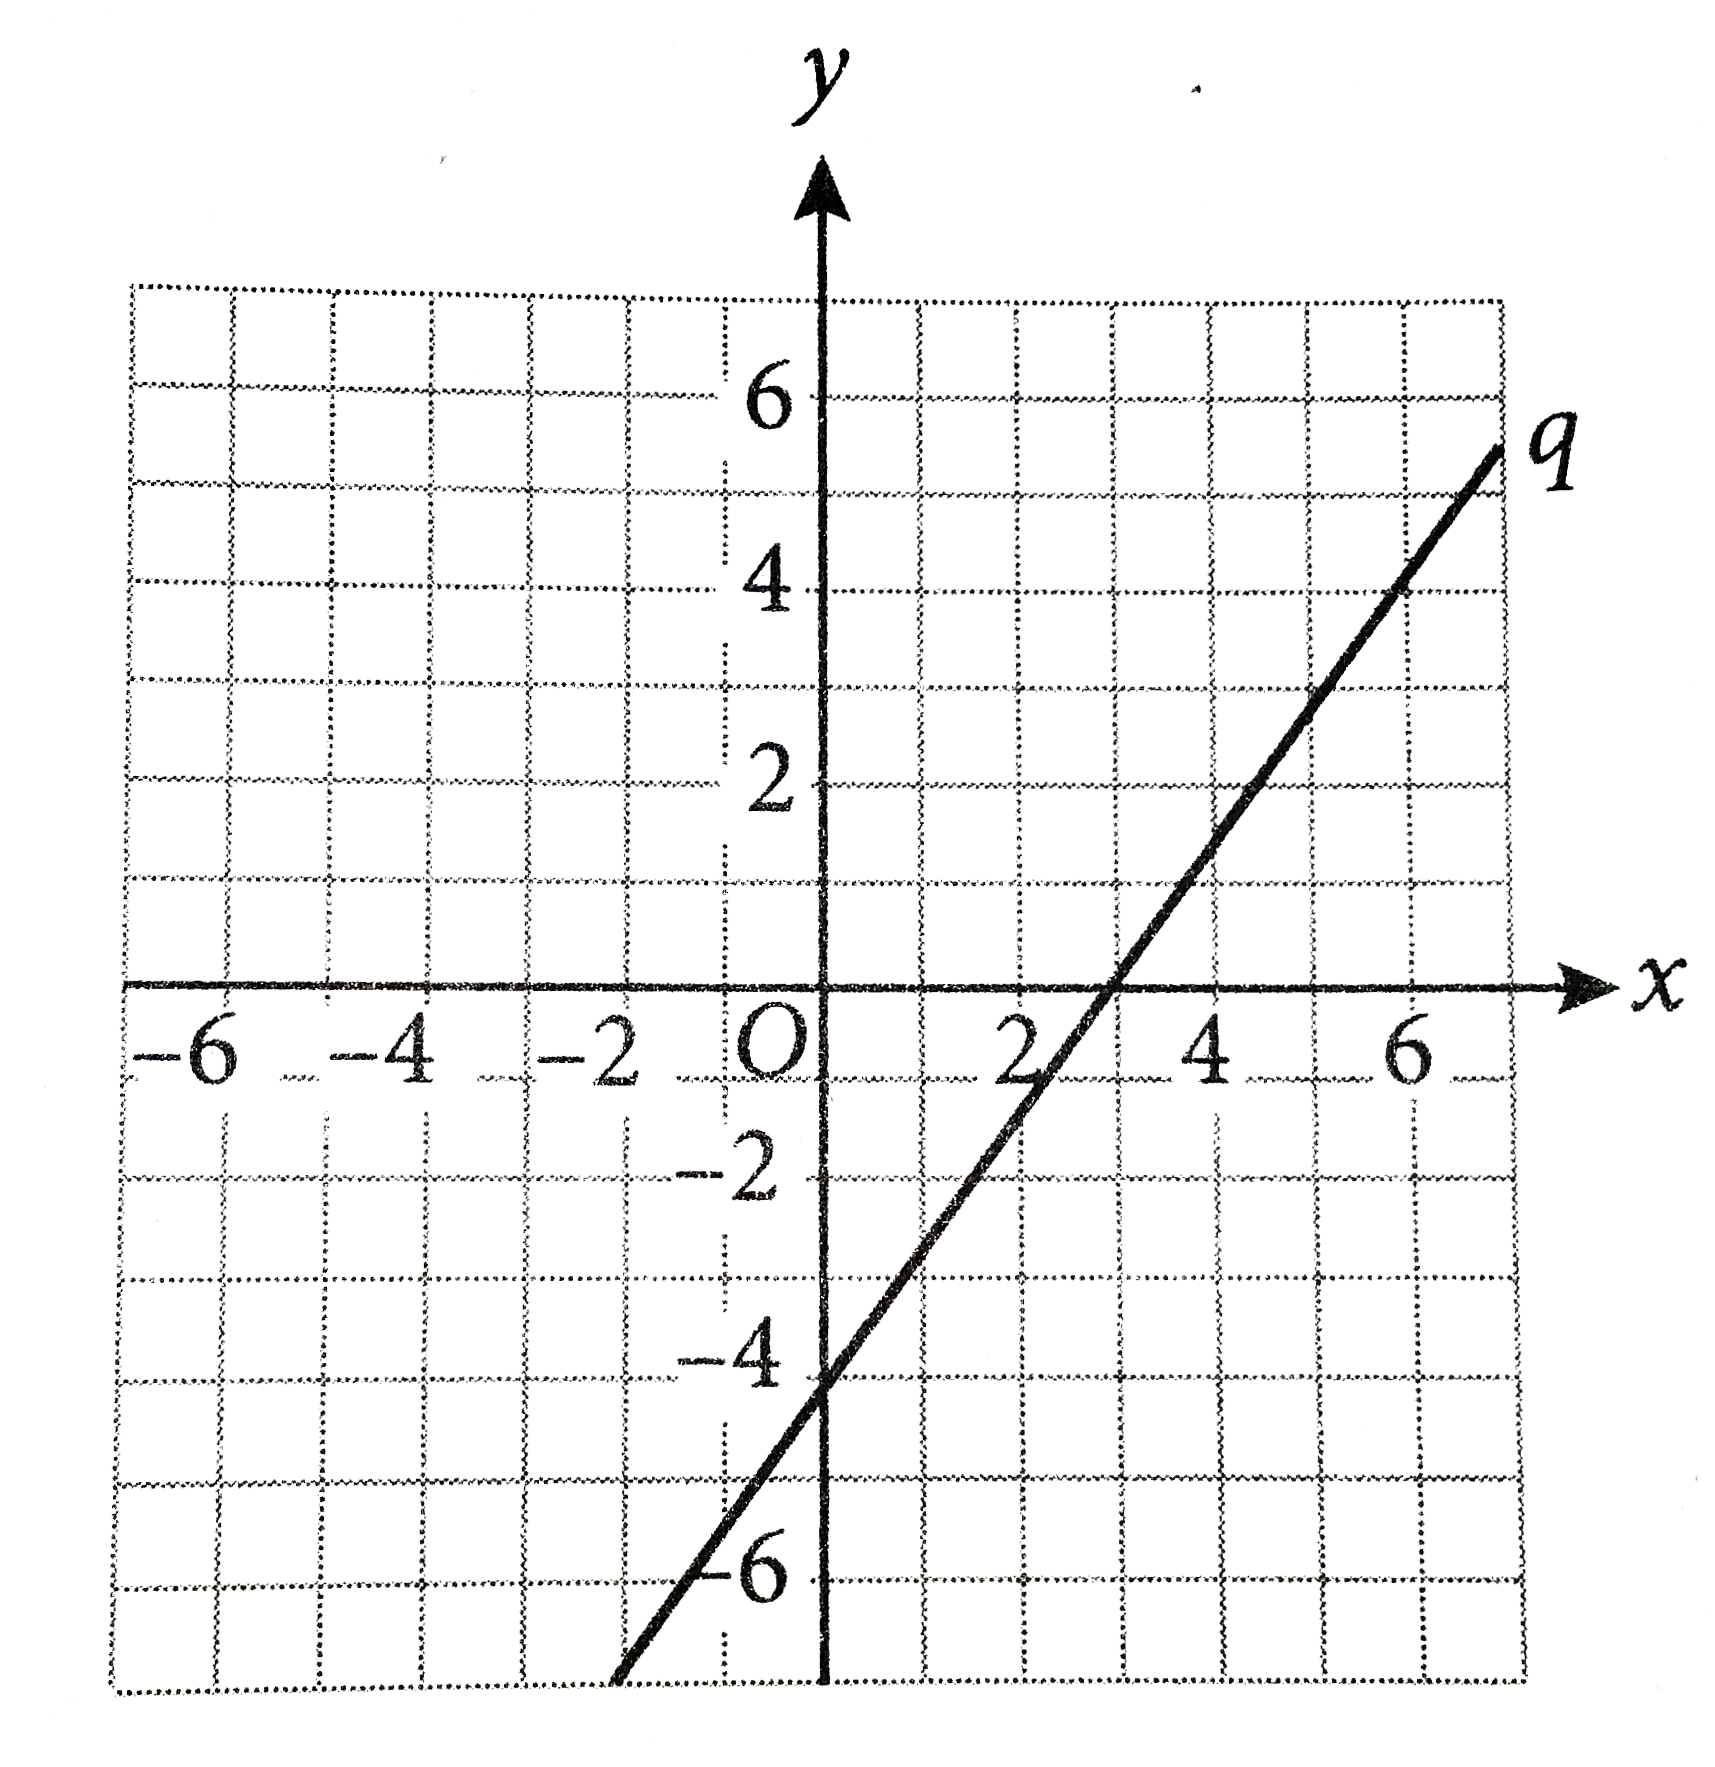
Line p (not shown) is perpendicular to line q shown above and passes through the point (0,4). Which of the following equations could represent line p?Ay=−43x+4By=−34x+4Cy=34x+4Dy=43x+4
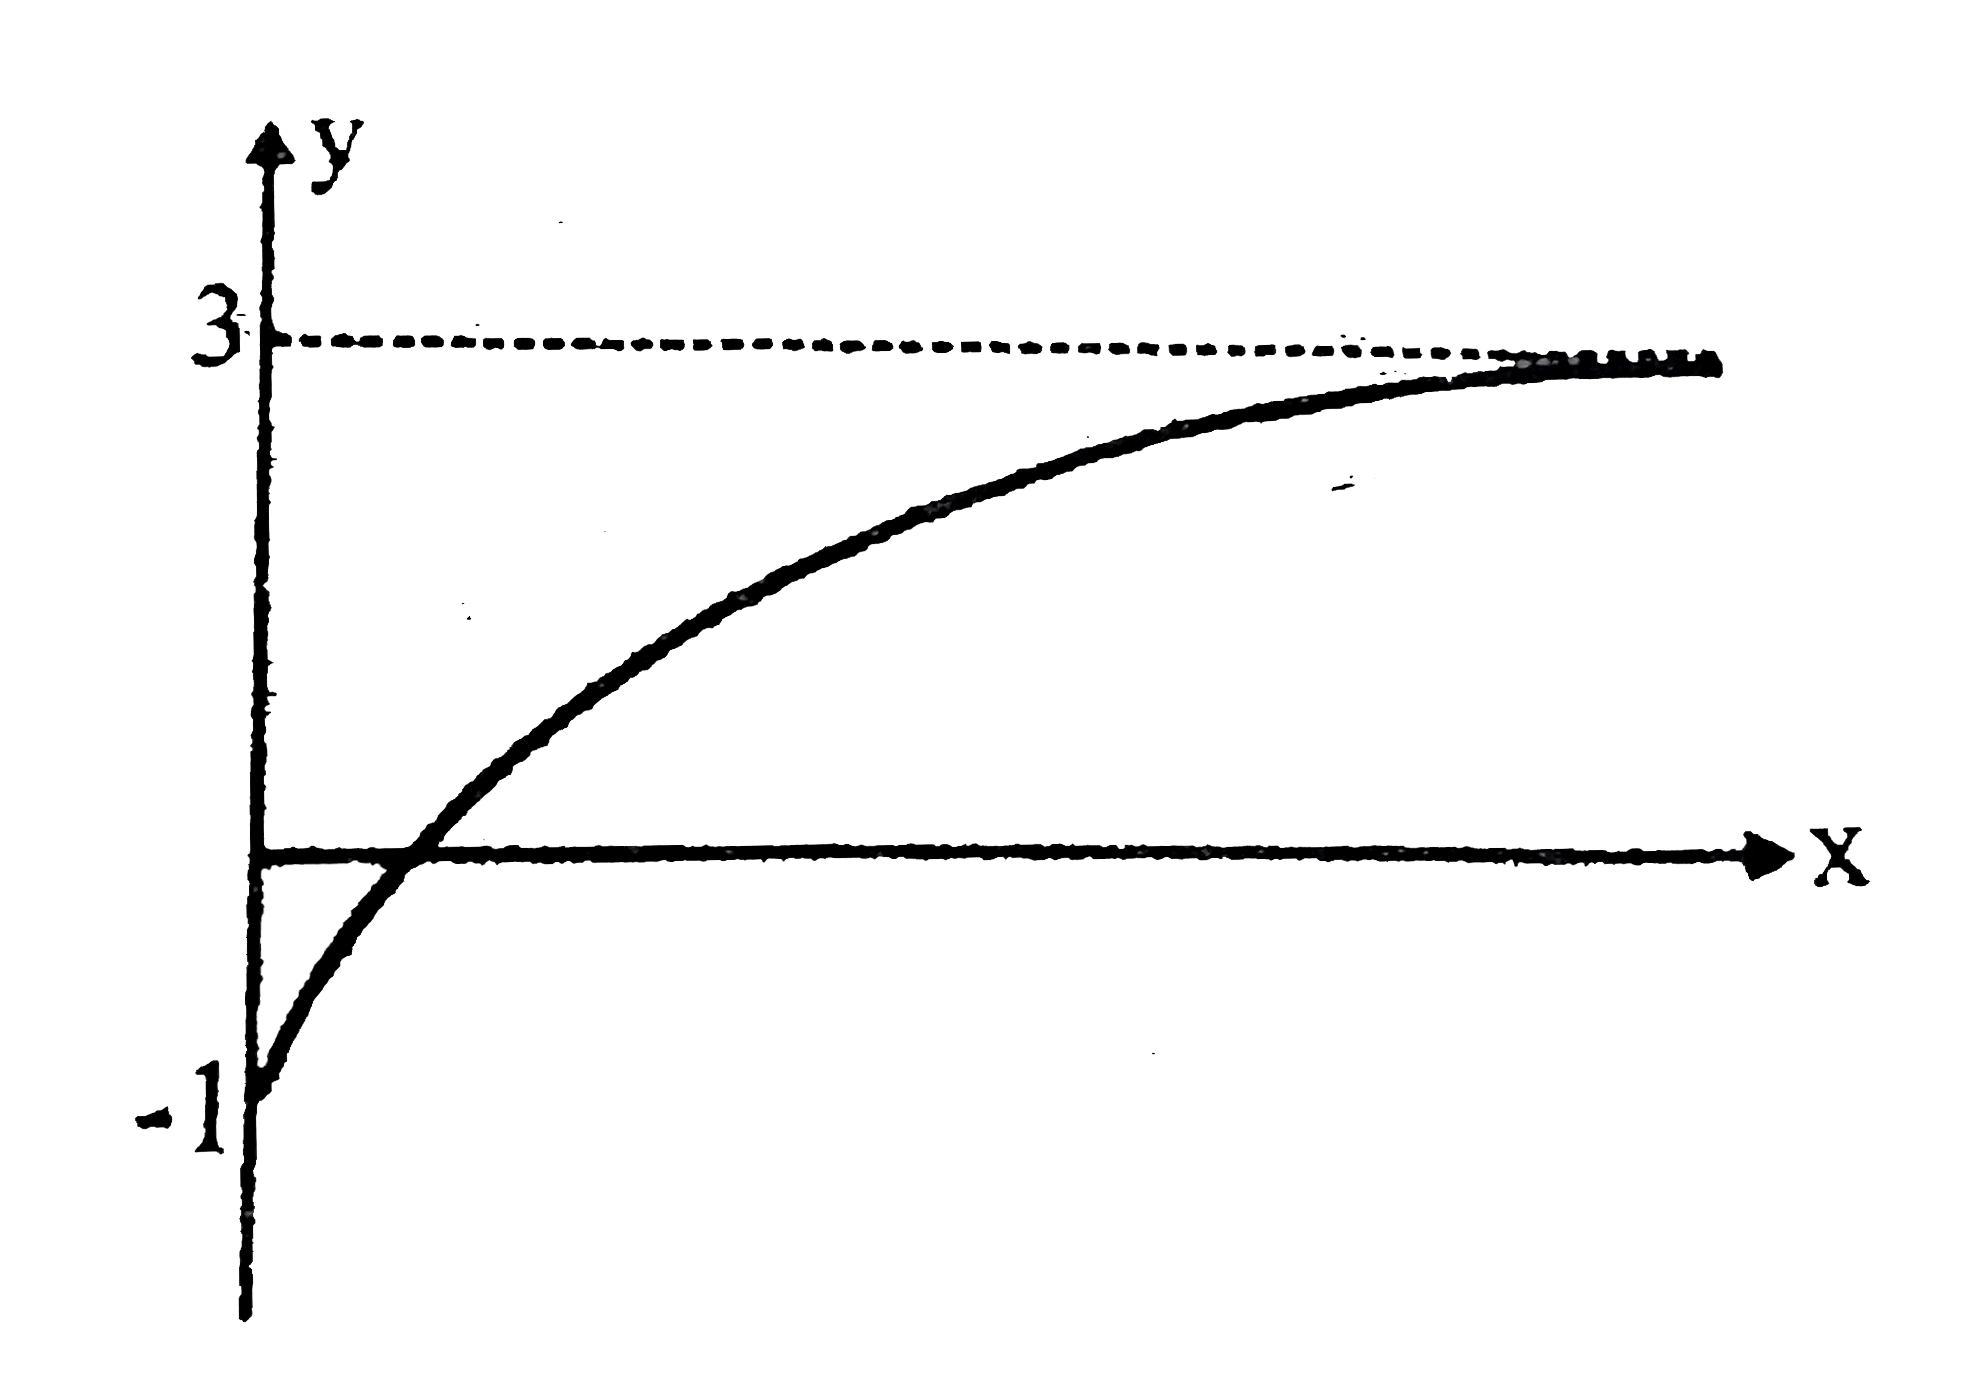
In the given figure is shown a variable y varying exponentially on another variable x. Study the graph carafully. Which of the following equations best suits the show graph?
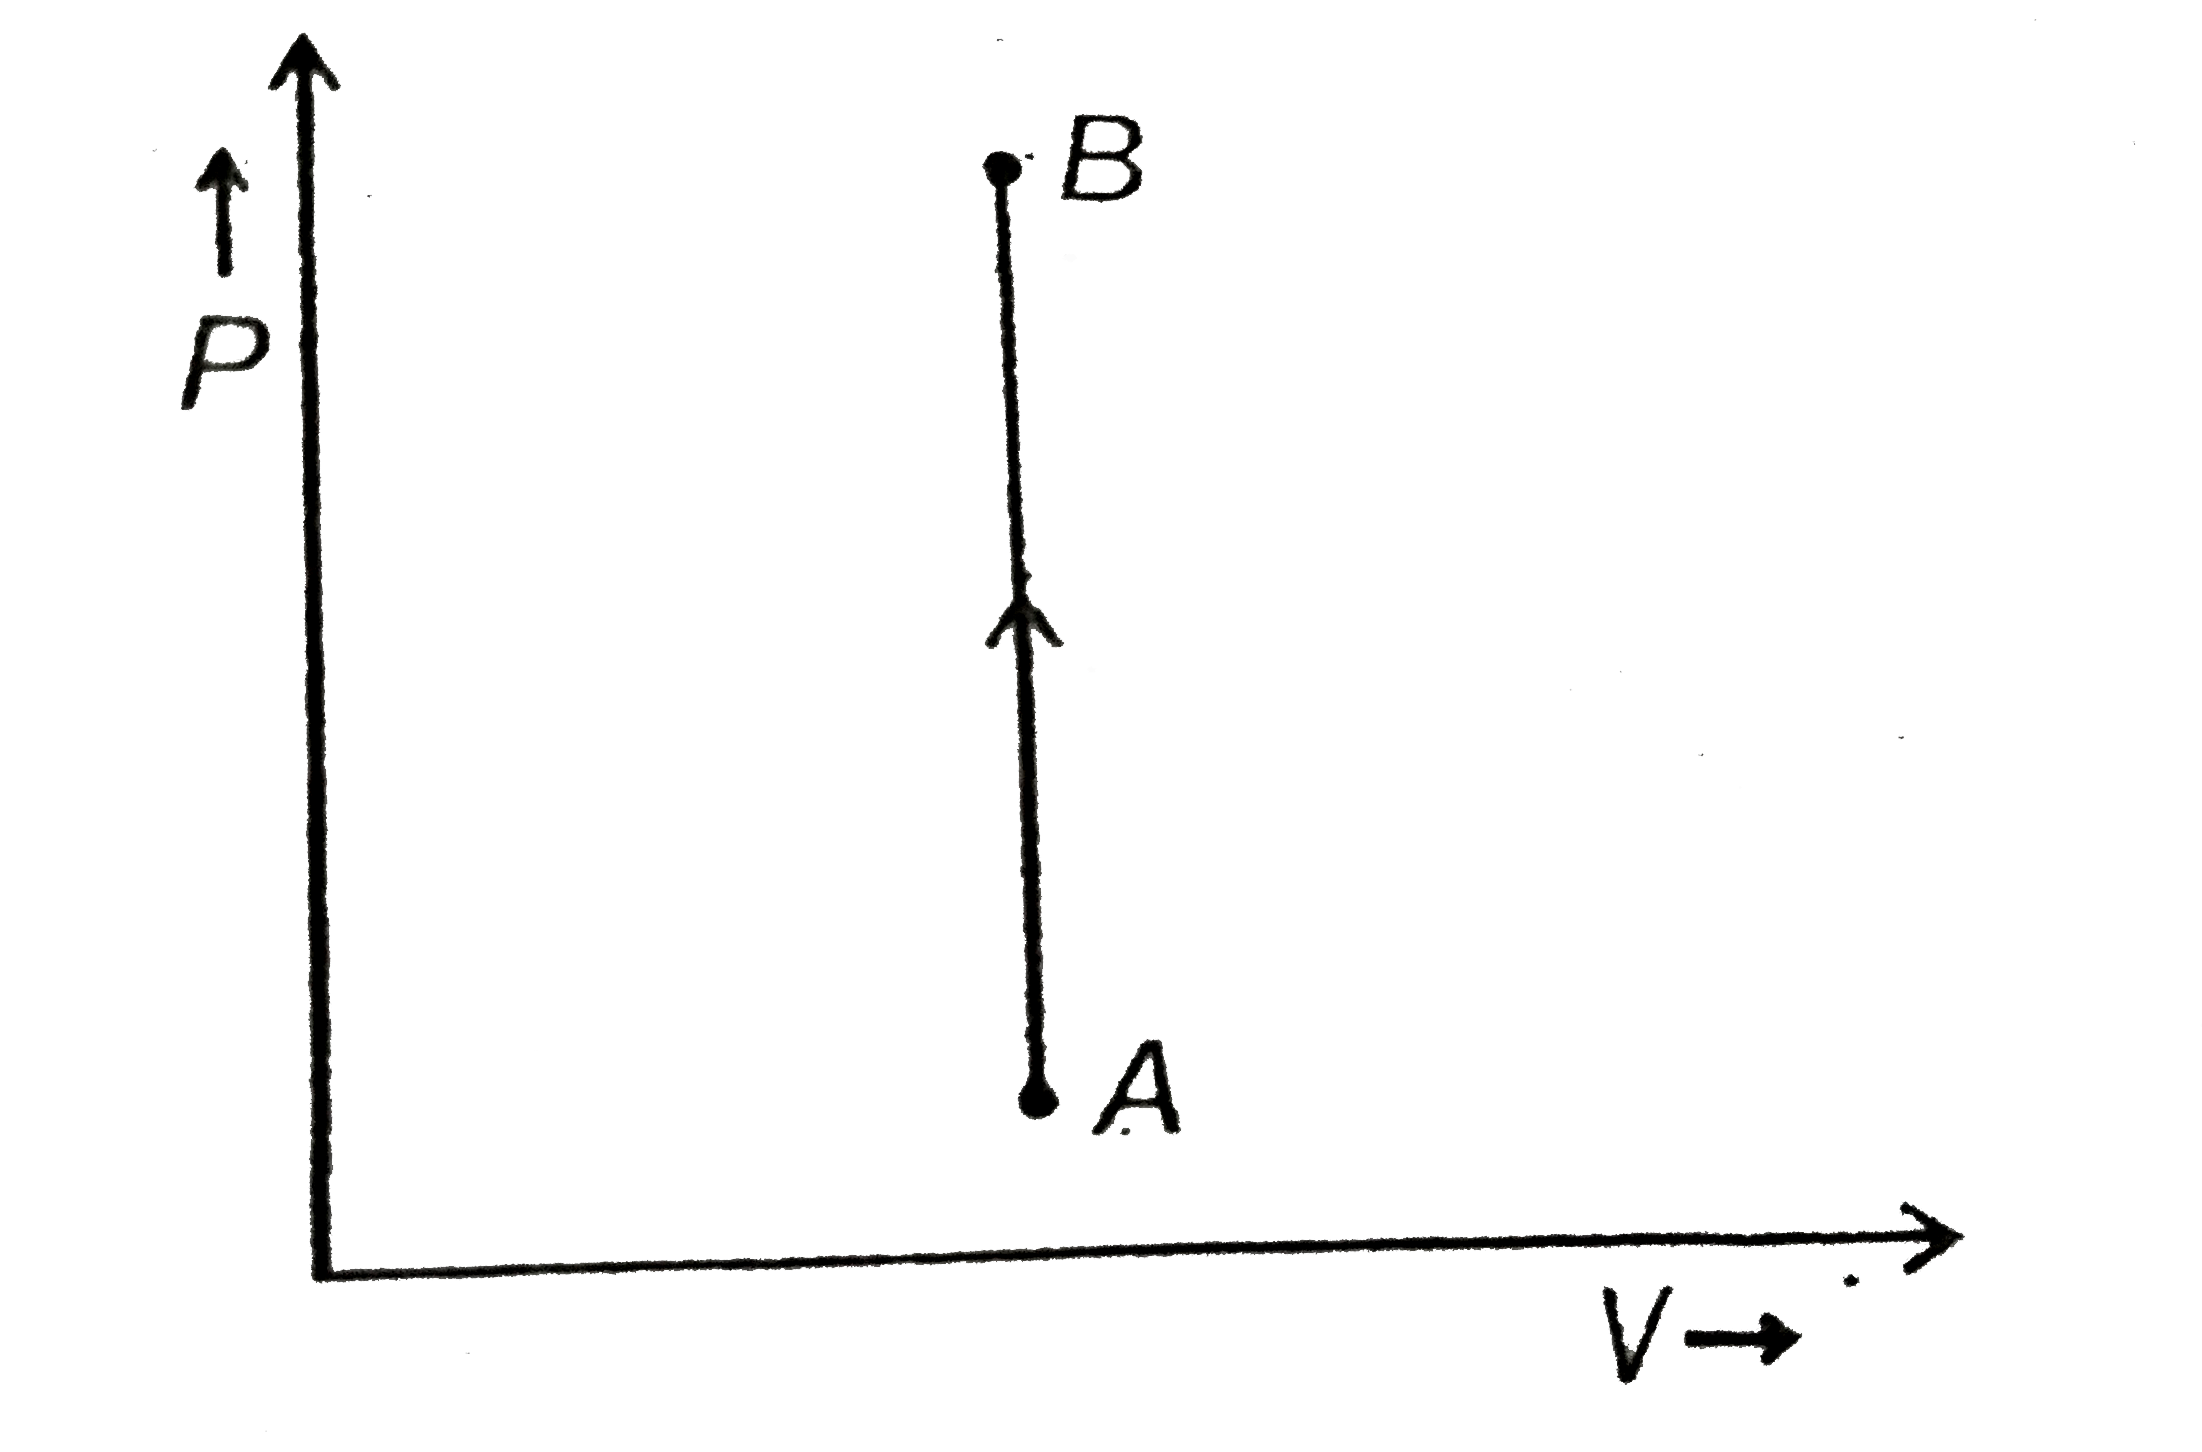
View SolutionThe following graph represents
View SolutionWhen graphed in the standard (x, y) coordinate plane, which of the following equations does NOT represent a line?
View SolutionThe graph of y=f(x) is shown below.
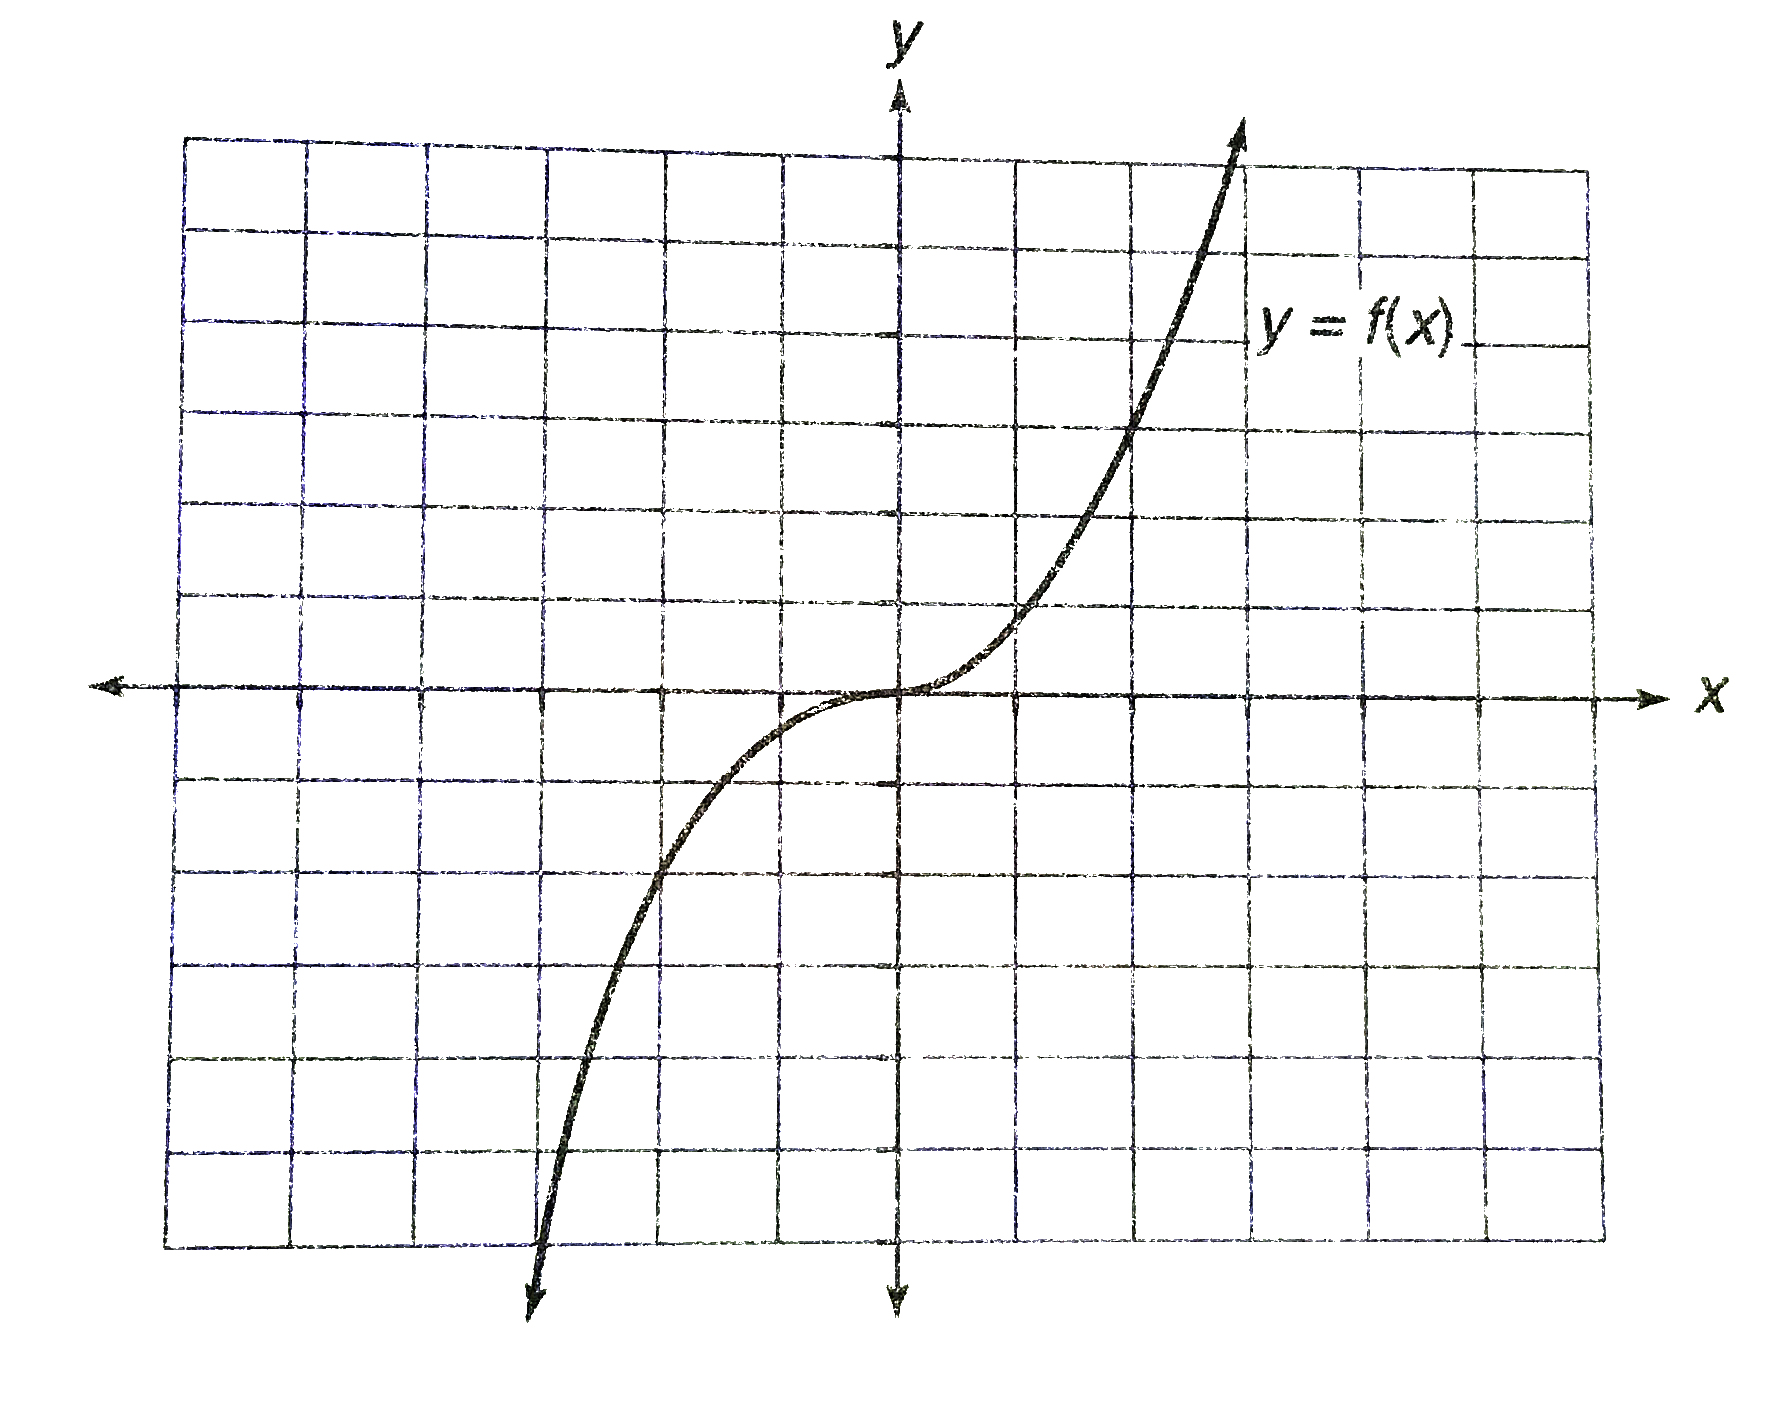
Which of the following could represents the graph of y=f(x−2)+1?
View Solution
The graph of f(x) is shown above , Which of the following represents the graph of f(x-3) ?
View Solution

