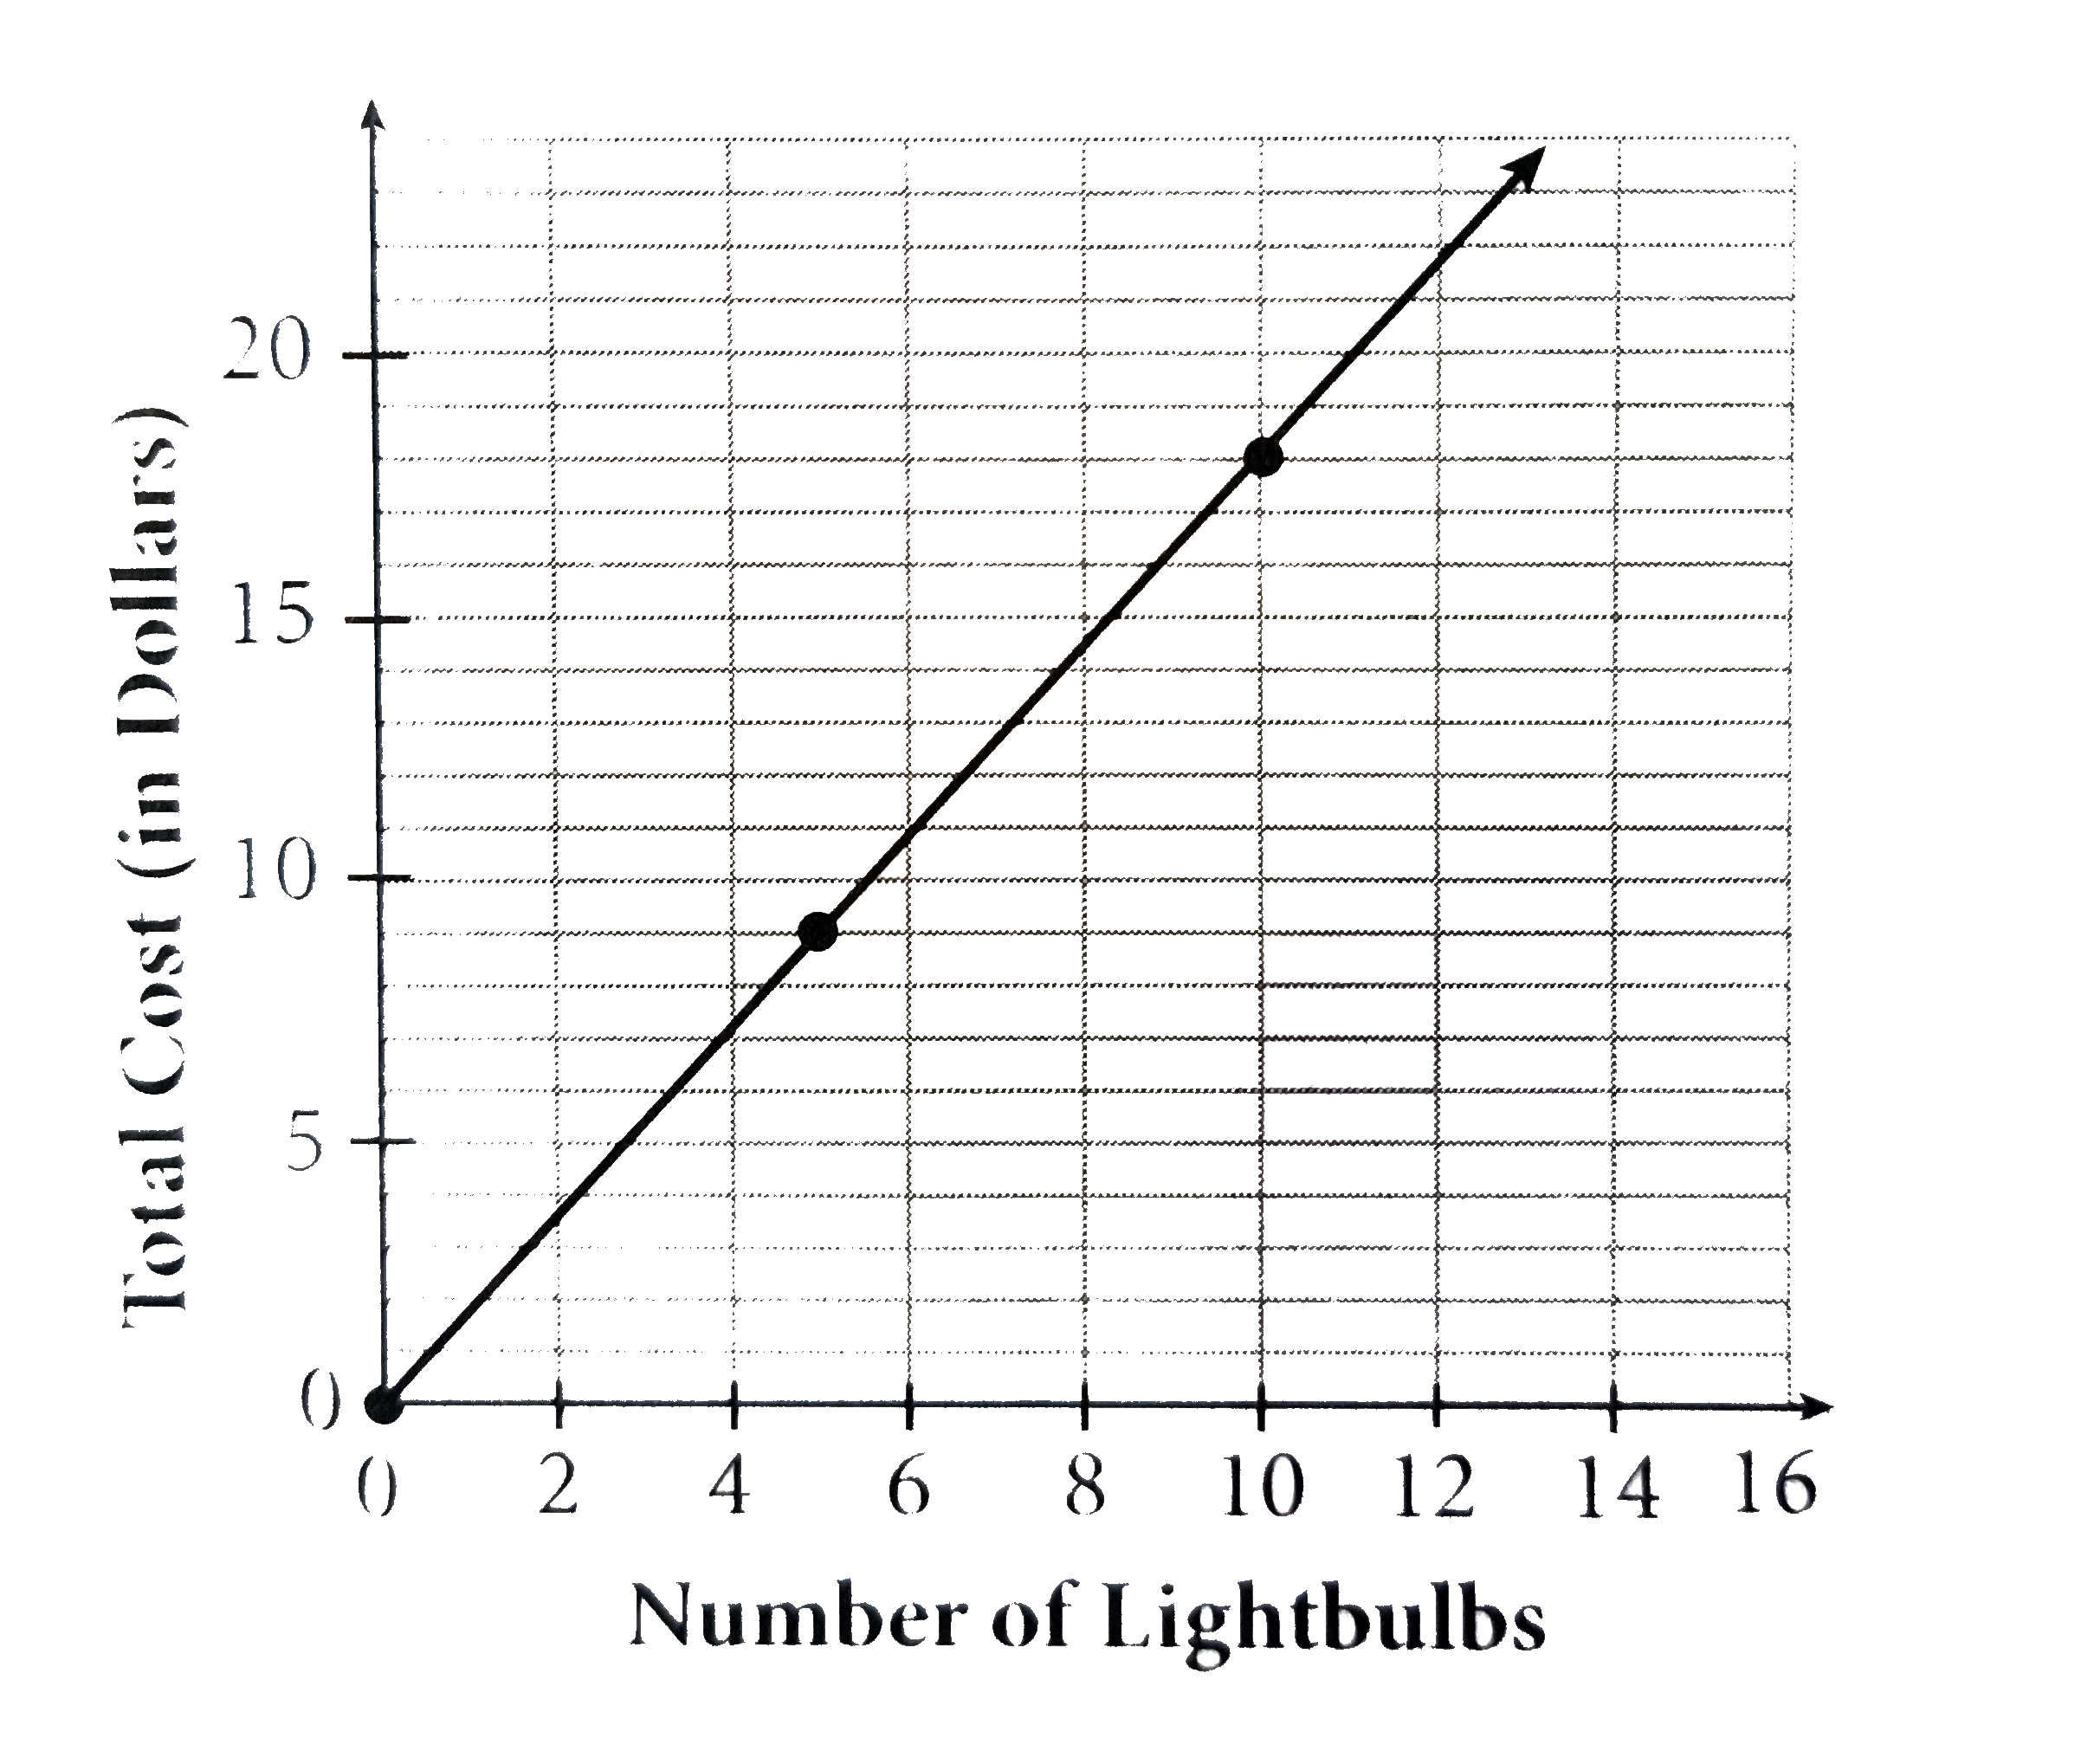
A hardware store sells light bulbs in different quantities. The graph shows the cost of various quantities. According to the graph, what is the cost of a single light bulb ?
$0.56
$1.80
$2.50
$3.60
The correct Answer is:B
The x-axis rrepresents the number of lihgt bulbs, so find 1 on the x-axis and trace up to where it meets the graph of the line. The y-value is somewhere between $1and$2, so the only possible correct answer choice is $1.80.(B) is correct.
You could also find the unit rate by calculating the slope of the line using two of the points shown on the graph: the graph rises 9 units and runs 5 units from one point to the next, so the slope is 95, or 1.8, which confirms that (B) is correct.
Topper's Solved these Questions
- LINEAR EQUATIONS AND GRAPHSBOOK - KAPLANCHAPTER - LINEAR EQUATIONS AND GRAPHSEXERCISE - TRY YOUR OWN
26 Videos
- LINEAR EQUATIONS AND GRAPHSBOOK - KAPLANCHAPTER - LINEAR EQUATIONS AND GRAPHSEXERCISE - SOLVING EQUATIONS
1 Video
- INEQUALITIESBOOK - KAPLANCHAPTER - INEQUALITIESEXERCISE - MODELING REAL-LIFE SITUATIONS WITH INEQUALITIES
1 Video
- PAIRED PASSAGES AND PRIMARY SOURCE PASSAGES BOOK - KAPLANCHAPTER - PAIRED PASSAGES AND PRIMARY SOURCE PASSAGES EXERCISE - HOW MUCH HAVE YOU LEARNED
11 Videos
Similar Questions
The line graphed in the xy-plane below models the total cost, in dollars, for a cab ride, y, in a certain city during nonpeak hours based on the number of miles traveled, x.
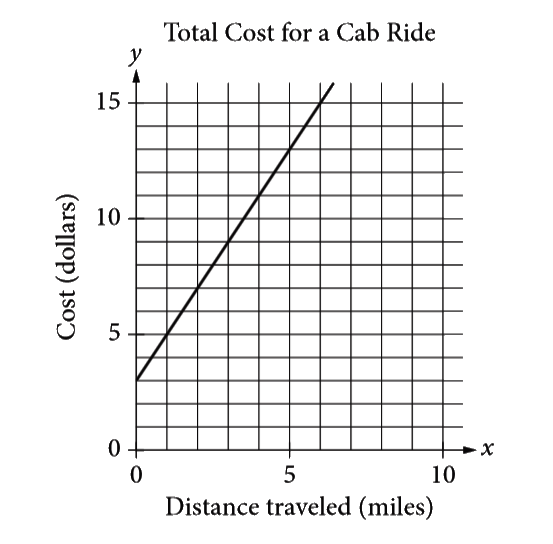
According to the graph, what is the cost for each additional mile traveled, in dollars, of a cab ride?
View SolutionThe graph showing rate of Photosynthesis at different wavelengths of light is called
View Solution
Knowledge Check
The graph shows the number of music CDs sold at various prices. At what price should the CDs be marked to sell the maximum number of CDs?
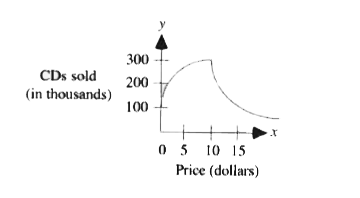 A0B5C10D15
A poor , frustrated artist named Fresco created a plan to make money. He collected trash, repurposed it into sculptures, then asked various celebrities to write and paint on these trash objects, which he then sold on his own as modern high art. The chart below separately shows the cost and revenue of his plan. The linear cost function, C(x) , represents the total money spent to make and market the art , while the linear revenue function, R(x) , shows the amount of money he has made in sculpture sales.
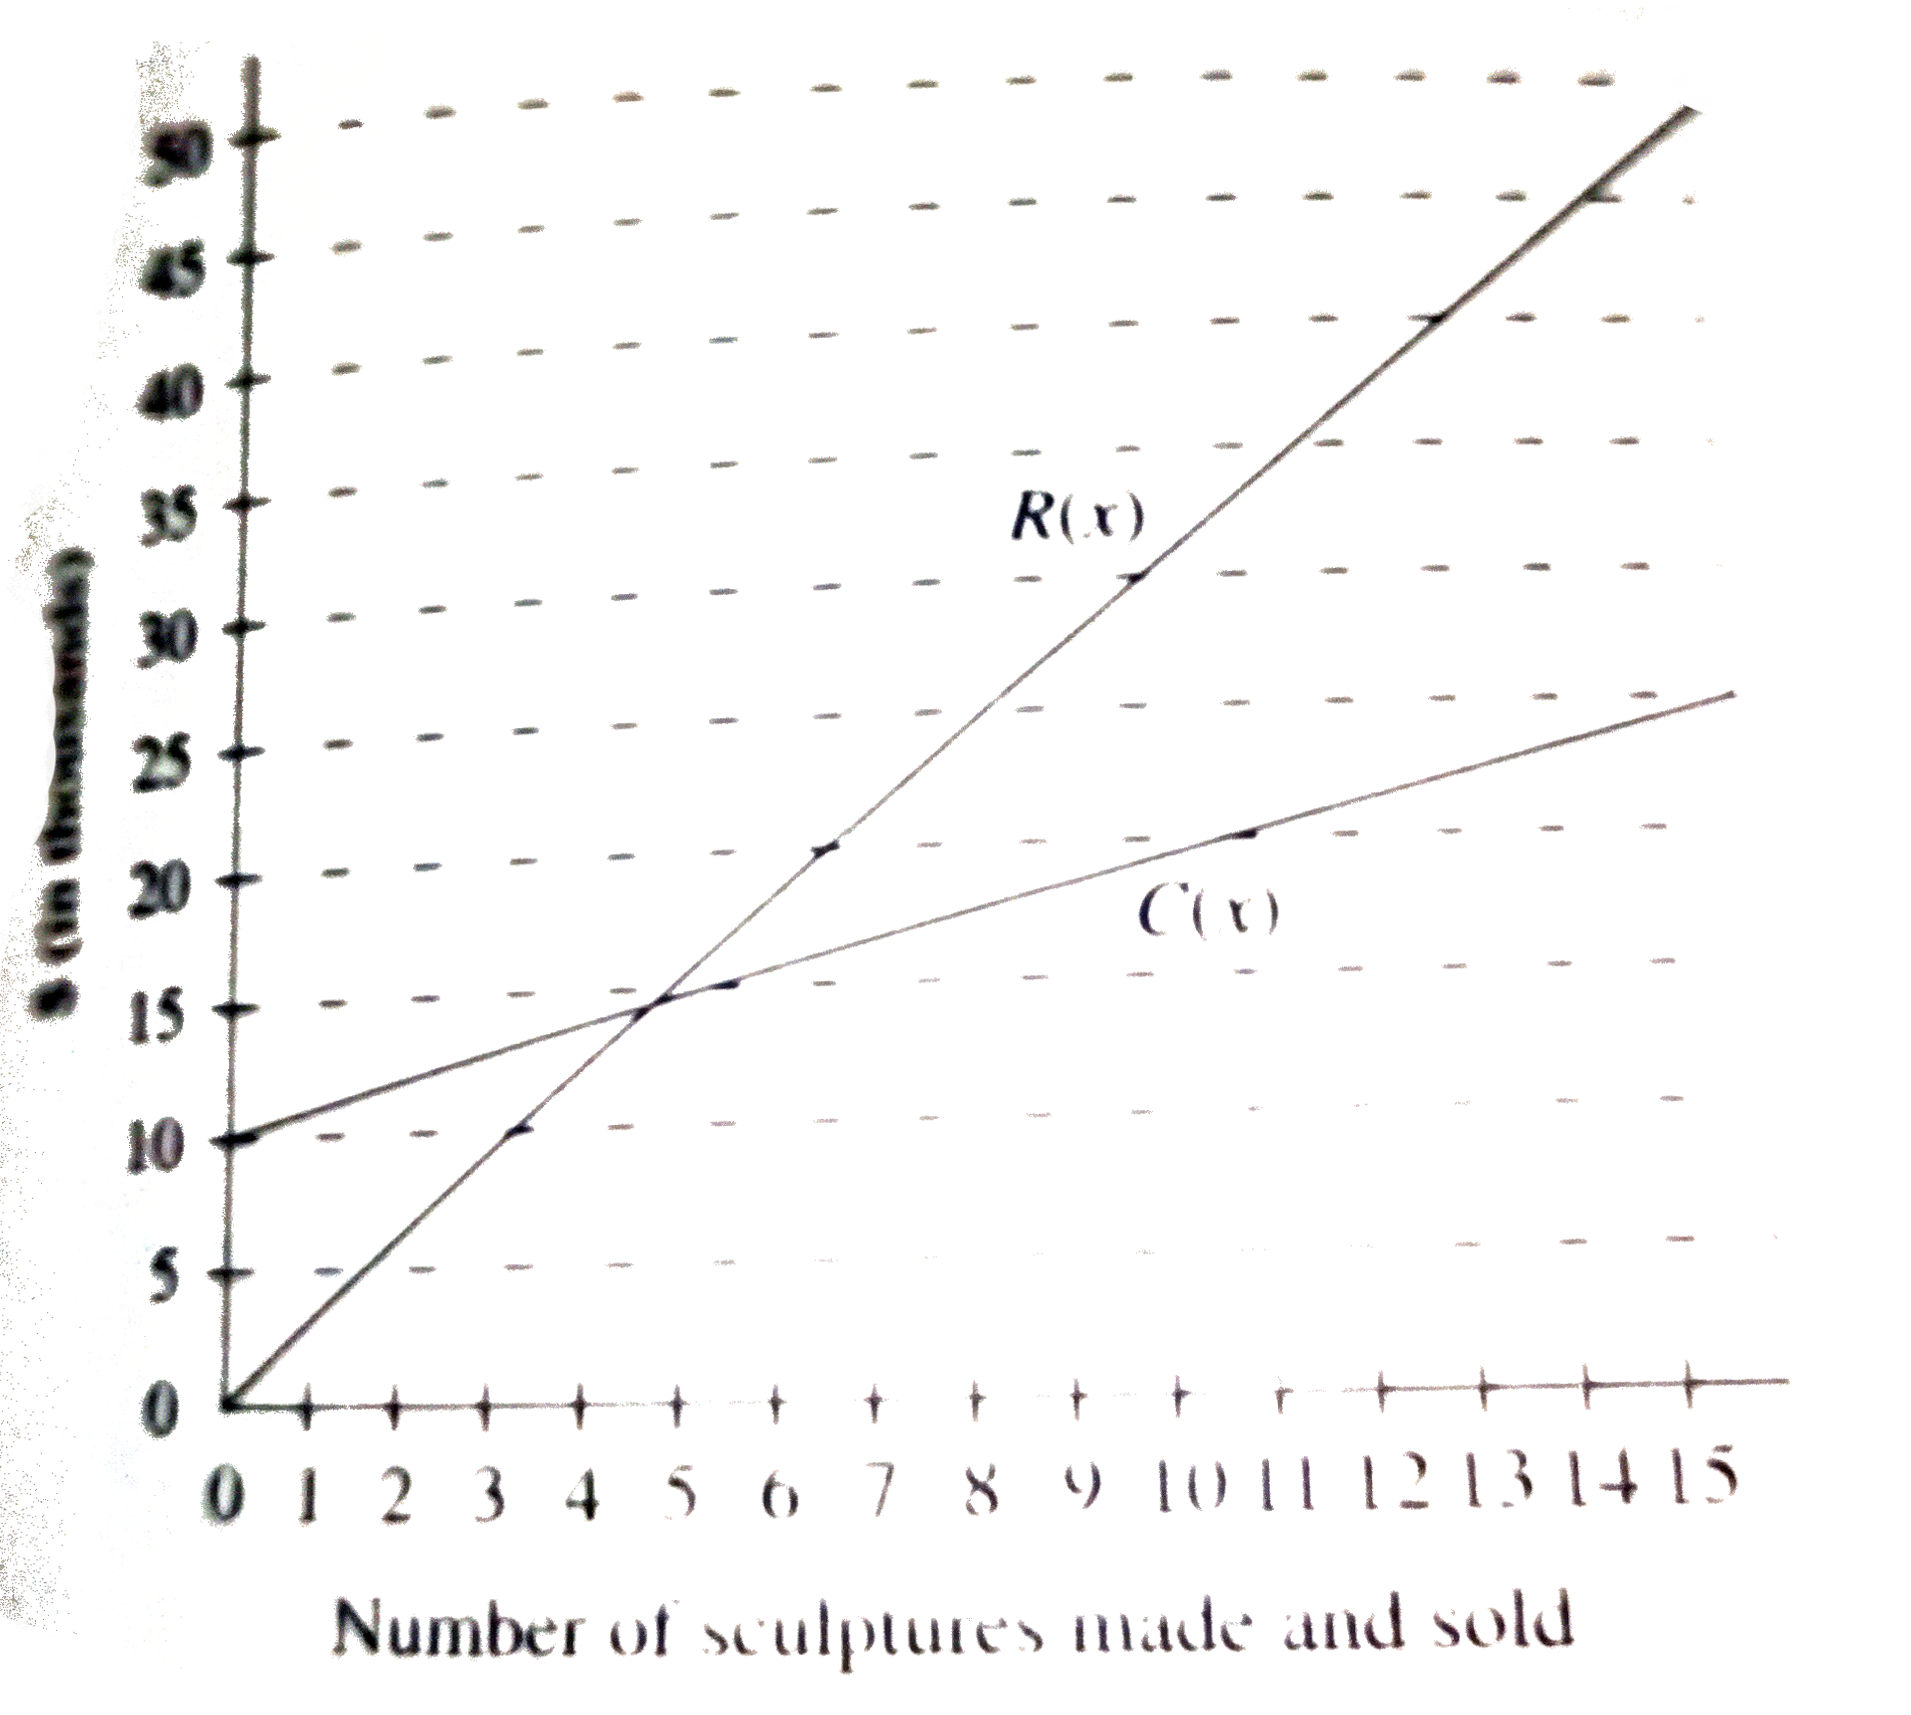
The selling price of each trash sculpture is an integer number of dollars . According to the revenue function , what is the selling price of one trash sculpture ?A$1,000B$1,667C$2,000D$3,000In a batch of 10 light bulbs , 2 are defective . If 3 of the bulbs are chosen at random, what is the probability that at least 1 of the chosen bulbs is defective ?
A815B715C310D14
Consider an ac circuit where an incandescent light bulb is in series with an inductor. If the frequency of generator is increased, what will happen to the brightness of bulb ?
View SolutionAn open tank with a square base and vertical sides is to be constructed form a metal sheet so as to hold a given quantity of water. Show that the cost of material will be least when depth of tank is half its width. If the cost is to be borne by nearby settled lower income families, for whom water will be provided, what kind of value is hidden in the question
View SolutionIn order to determine the value of E0, a scienctist shines photons (''light particles '')of various energies at a cloud of atomic hydrogen. Most of the hydrogen atom occupy transition through that cloud : see figure is a graph of part of the scientist's data, showing the idensity of the transmitted light as a function of the photon energy. A hydrogen atom's electron is likely to obsorb a photon only if the photon gives the electron enough energy to knock it into a higher shell.
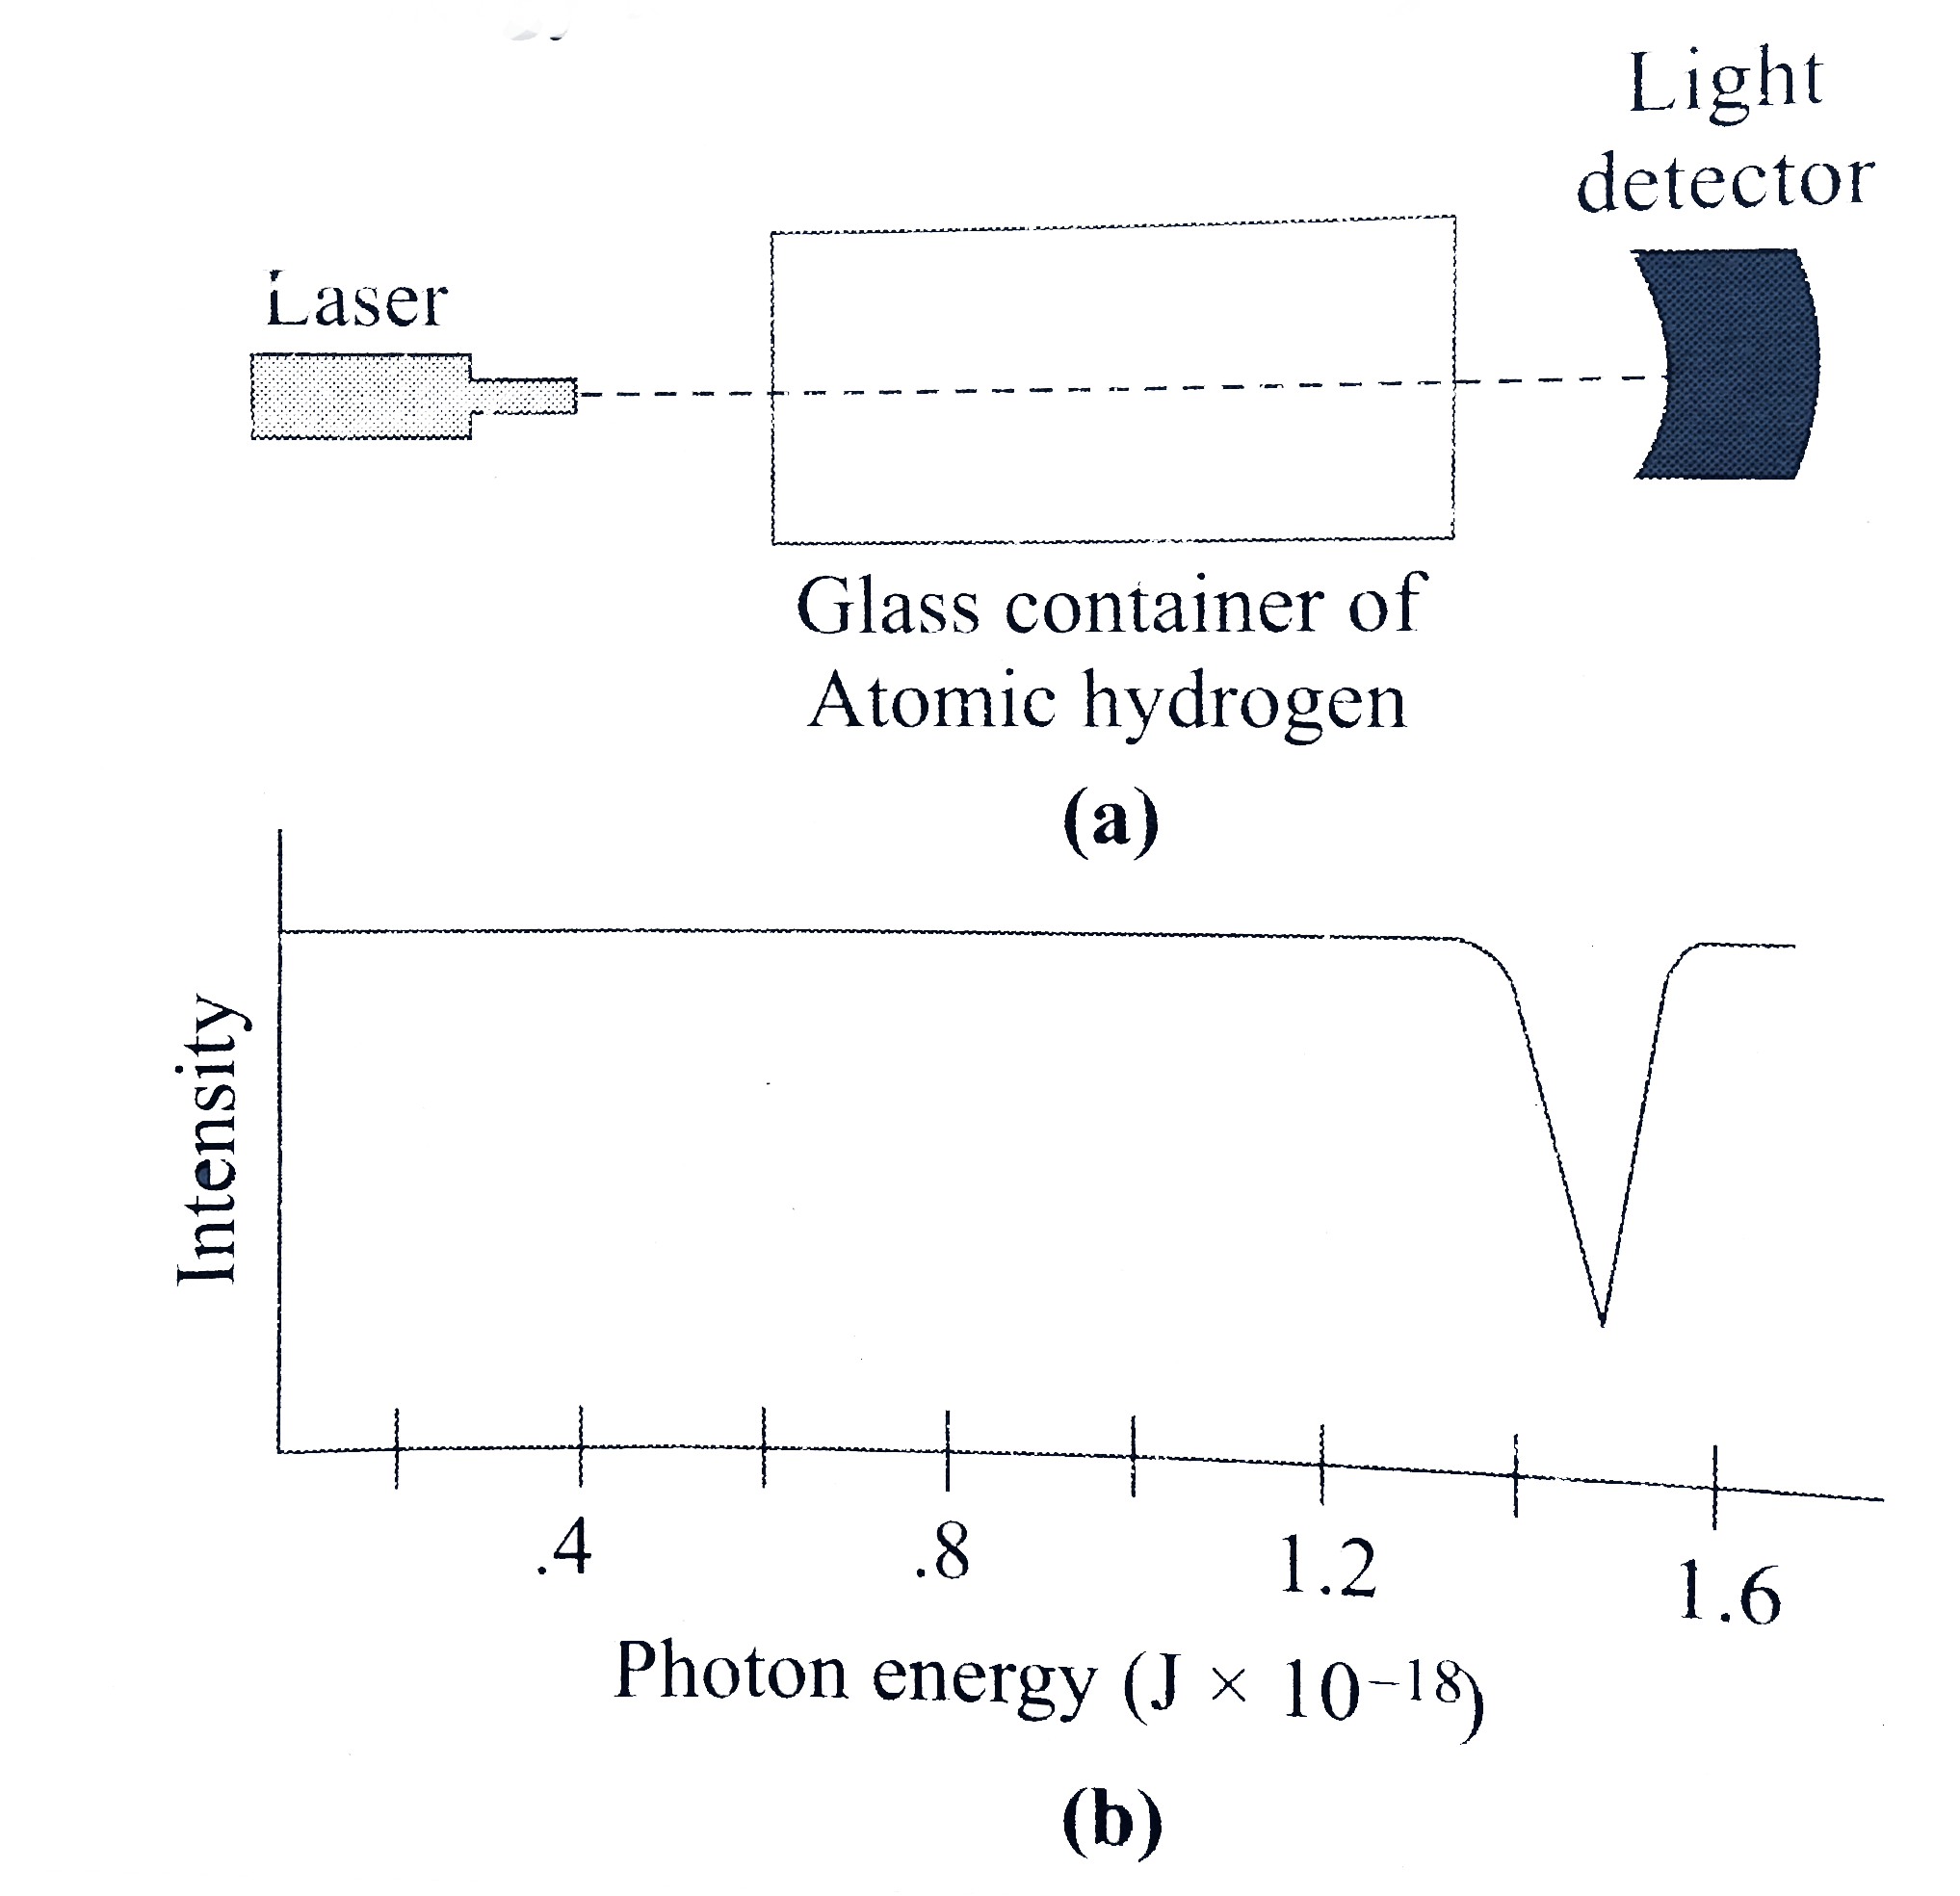
According to this experiment , what is the approximate value of E0?
View SolutionThe cost of manufacturing x articles is Rs. (50+3x). The selling price of x articles is Rs. 4x.
On a graph sheet, with the same axes, and taking suitable scale draw two graphs, first for the cost of manufacturing against no. of articles and the second for the selling price against number of articles.
Use your graph to determine
(i) No. of articles to be manufactured and sold to break even (no profit and no loss),
(ii) The profit or loss made when a. 30 b. 60 articles are manufactured and sold.
View SolutionWhen two plants L and M were exposed to different light intensities and temperature they showed changes in their rates of photosynthesis. Which have been represented in the following graph.
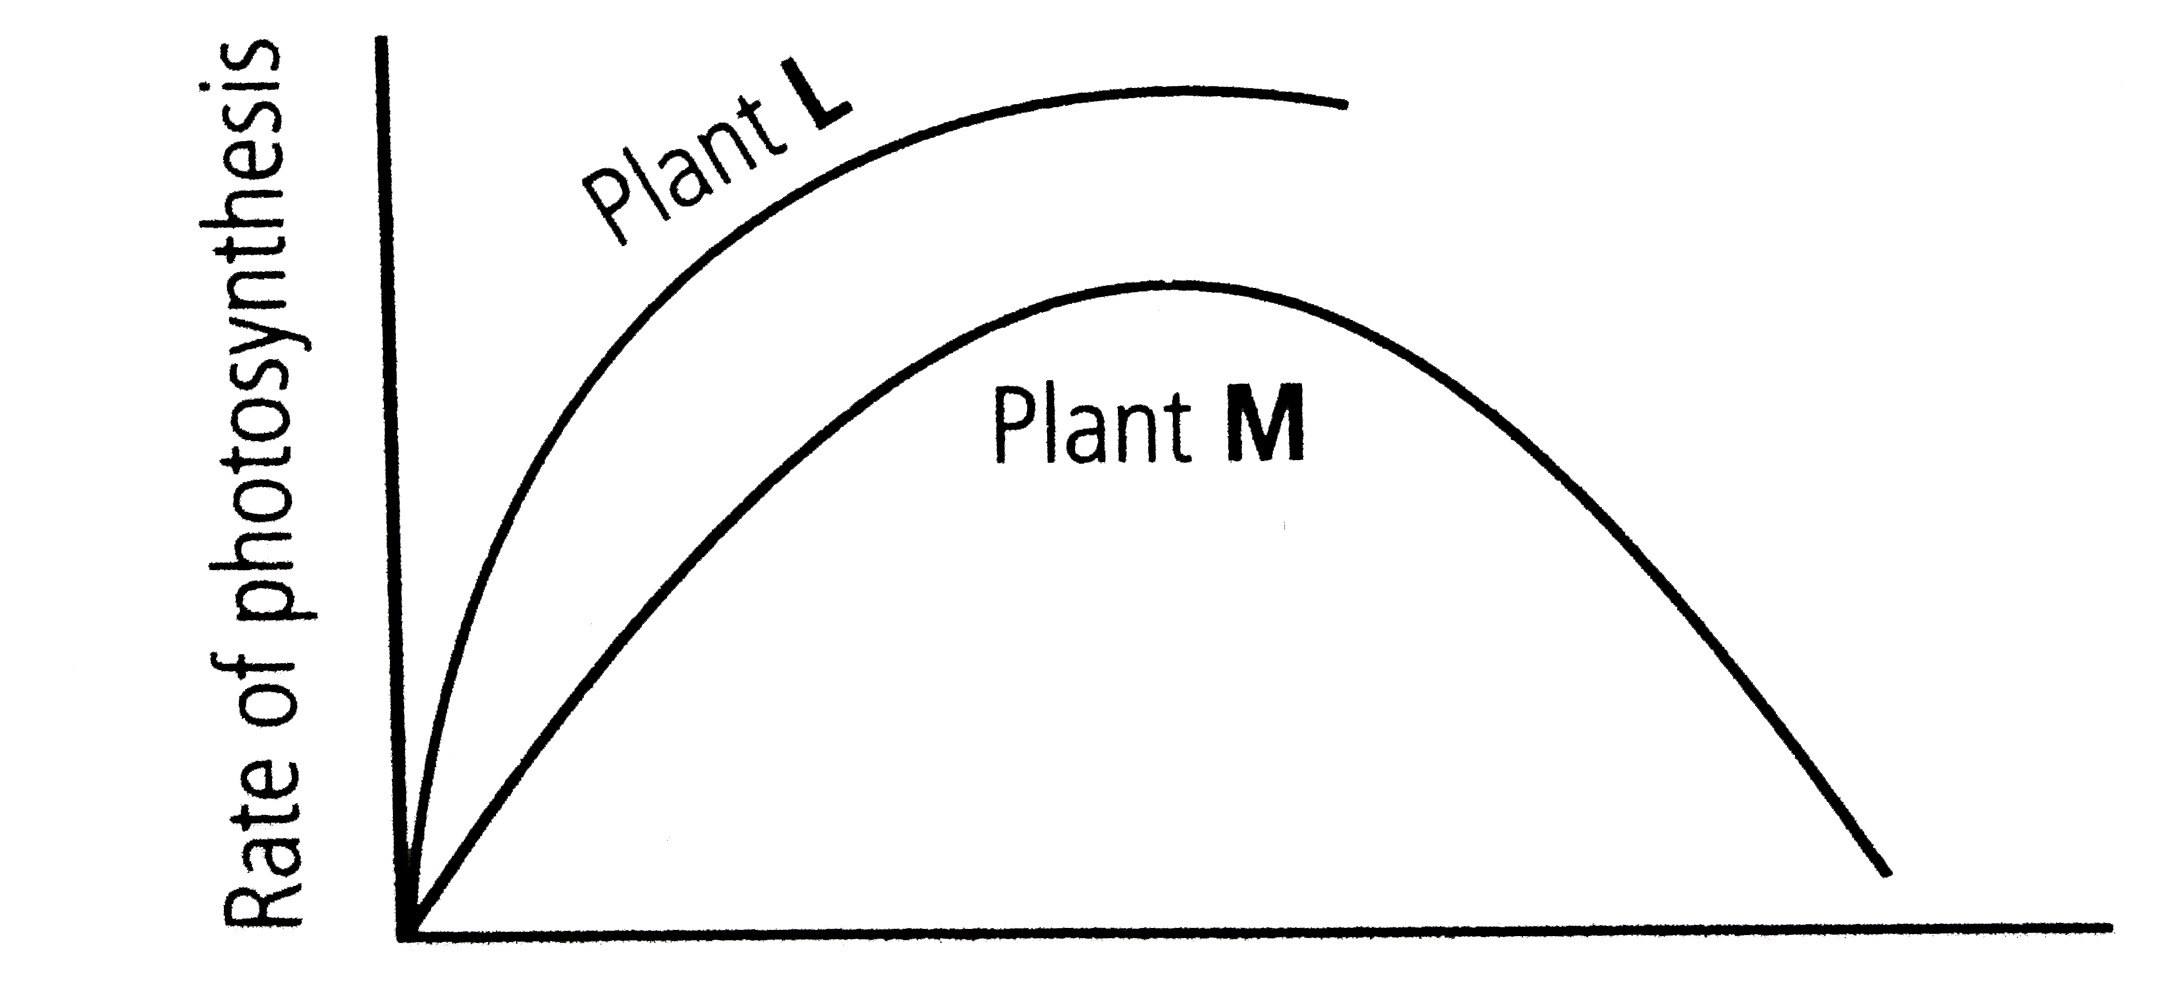
The graph indicates that
View Solution
