Lother Meyer drew a graph showing the relation between
atomic number and atomic weight
atomic number and atomic size
atomic weight and atomic volume
atomic weight and atomic size
Lothar Meyer drew a graph showing the relation between atomic weight and atomic volume.
Topper's Solved these Questions
Similar Questions
Knowledge Check
Lother Meyer drew a graph showing the relation between
Aatomic number and atomic weightBatomic number and atomic sizeCatomic weight and atomic volumeDatomic weight and atomic sizeThe correct graph showing the relation between the height of water column in a capillary tube and the capillary tube and the capillary radius is shown by
A B
B C
C D
D
In a photoelectric experiment, the reciprocal of the slope of the straight line graph giving the relation between the stopping potential and the frequency of incident radiation gives
AhBeCheDeh
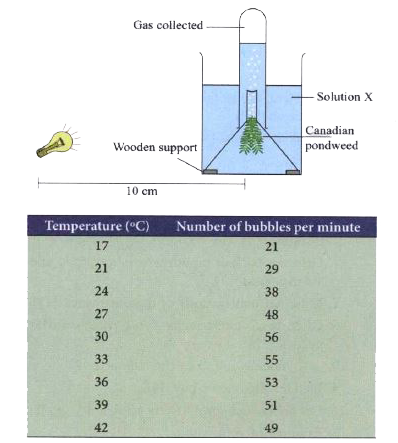
Diagram below depicts an experiment to find the effect of temperature on the rate of photosynthesis. The average number of bubbles per minute at each temperature is given in the table.

Plot a graph to show the relation between the rate of photosynthesis and temperature.
View SolutionChoose the graph showing the correct relationship between the stopping potential V0 and the frequency v of light for potassium and tungsten.
View SolutionWhich of the following graphs shows the relationship between the rate of an enzymatic activity and substrate concentration (S) ?
View SolutionIf P to T are second period p-block elements then which of the following graph show corrrect relation between valence electrons in P2→T2
View SolutionIf P to T are second period p-block elements then which of the following graph show corrrect relation between valence electrons in P2→T2
View Solution


