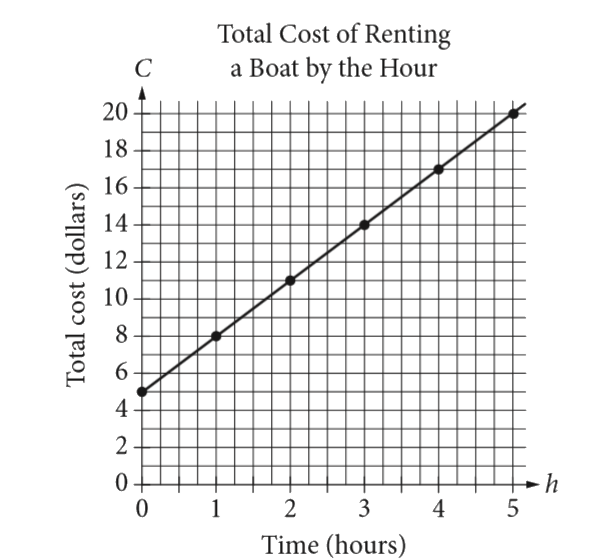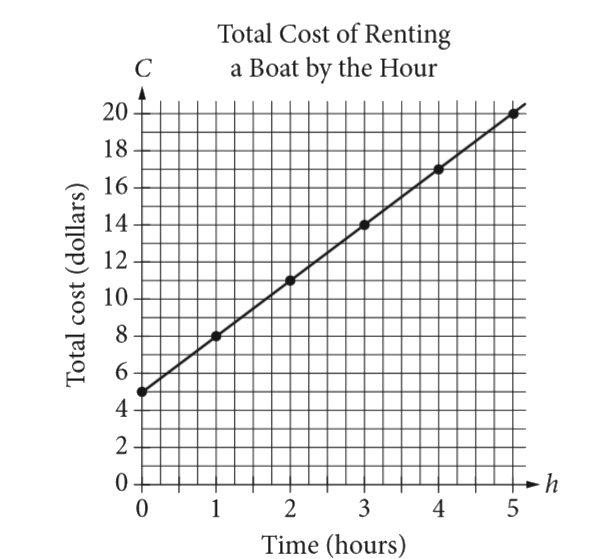
The graph above displays the total cost C, in dollars, of renting a boat for h hours.
Which of the following represents the relationship between h and C ?
C=5h
C=34h+5
C=3h+5
h=3C
The correct Answer is:C
Step by step video, text & image solution for The graph above displays the total cost C, in dollars, of renting a boat for h hours. Which of the following represents the relationship between h and C ? by Maths experts to help you in doubts & scoring excellent marks in Class 12 exams.
Updated on:21/07/2023Similar Questions
The inequation that best describes the graph given below is _________
View SolutionThe inequation that best describes the following graph is _________
View SolutionWhich inequations represent the shaded region in the given figure
View SolutionFrom the following figure, the correct observation is :- ltimg src="https://d10lpgp6xz60nq.cloudfront.net/physics_images/ALN_PHY_R03_E08_015_Q01.png" width="80%"gt
View SolutionMatch the followings (column I with column II)
ltimg src="https://d10lpgp6xz60nq.cloudfront.net/physics_images/NCERT_BIO_XI_C03_E01_011_Q01.png" width="80%"gt
View Solution
The graph above displays the total cost C, in dollars, of renting a boat for h hours.
What does the C-intercept represent in the graph?
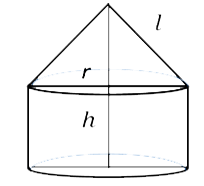
View SolutionThe total surface area of the given solid figure is _______________.

View Solution
