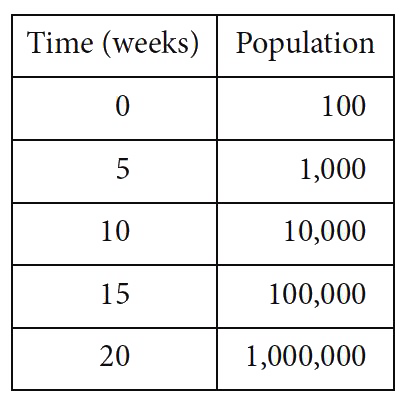
The population of mosquitoes in a swamp is estimated over the course of twenty weeks, as shown in the table.

Which of the following best describes the relationship between time and the estimated population of mosquitoes during the twenty weeks?
Increasing linear
Decreasing linear
Exponential growth
Exponential decay
The correct Answer is:C
The mosquito population starts at 100 in week 0 and then is multiplied by a factor of 10 every 5 weeks. Thus, if P(t) is the mosquito population after t weeks, then based on the table, P(t)=100(10)t5 which indicates an exponential growth relationship.
Choices A, B, and D are incorrect and may be the result of an incorrect interpretation of the relationship or errors in modeling the relationship.
Similar Questions
The inequation that best describes the following graph is _________
View SolutionWhich inequations represent the shaded region in the given figure
View SolutionThe equation of straight line shown in figure is :
ltimg src="https://d10lpgp6xz60nq.cloudfront.net/physics_images/ALN_PHY_R04_E01_020_Q01.png" width="80%"gt
View SolutionWhat is the distance OA for the square shown in figure :- ltimg src="https://d10lpgp6xz60nq.cloudfront.net/physics_images/ALN_PHY_R05_E01_015_Q01.png" width="80%"gt
View SolutionWhich of the following best describes the diagram below of a molecular orbital?
ltimg src="https://d10lpgp6xz60nq.cloudfront.net/physics_images/JM_18_CHE_P1_E02_029_Q01.png" width="80%"gt
View SolutionWhat is the distance OA for the square shown in figure :- ltimg src="https://d10lpgp6xz60nq.cloudfront.net/physics_images/ALN_PHY_R05_E01_015_Q01.png" width="80%"gt
View SolutionFor shown situation find angleBCA :- ltimg src="https://d10lpgp6xz60nq.cloudfront.net/physics_images/ALN_PHY_R05_E01_035_Q01.png" width="80%"gt
View Solution
