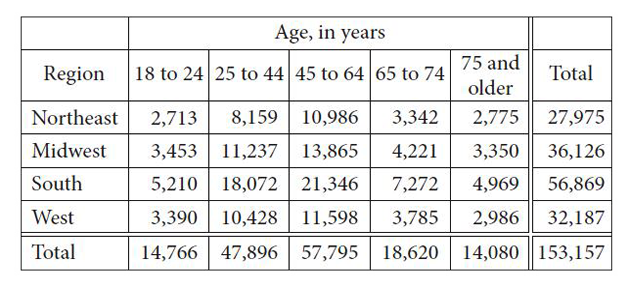
Number of Registered Voters
in the United States in 2012, in Thousands

The table above shows the number of registered voters in 2012, in thousands, in four geographic regions and five age groups. Based on the table, if a registered voter who was 18 to 44 years old in 2012 is chosen at random, which of the following is closest to the probability that the registered voter was from the Midwest region?
A
0.1
B
0.25
C
0.4
D
0.75
Video Solution
Text Solution
The correct Answer is:B
According to the table, in 2012 there was a total of 14,766 + 47,896 = 62,662 registered voters between 18 and 44 years old, and 3,453 + 11,237 = 14,690 of them were from the Midwest region. Therefore, the probability that a randomly chosen registered voter who was between 18 and 44 years old in 2012 was from Midwest region is 14,69062,662≈0.234. Of the given choices, 0.25 is closest to this value.
Choices A, C, and D are incorrect and may be the result of errors in selecting the correct proportion or in calculating the correct value.
|
Similar Questions
The inequation that best describes the graph given below is _________
View SolutionThe inequation that best describes the following graph is _________
View SolutionWhich inequations represent the shaded region in the given figure
View SolutionMatch the followings (column I with column II)
ltimg src="https://d10lpgp6xz60nq.cloudfront.net/physics_images/NCERT_BIO_XI_C03_E01_011_Q01.png" width="80%"gt
View Solution'A' is the portion of adenophypophysis which secrets different hormones 'A' is____
View SolutionIdentify A,B,C and D,E
View SolutionConsider the following reactions.
View Solution
