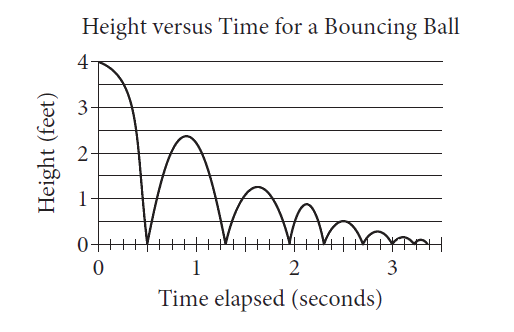
As part of an experiment, a ball was dropped and allowed to bounce repeatedly off the ground until it came to rest. The graph above represents the relationship between the time elapsed after the ball was dropped and the height of the ball above the ground. After it was dropped, how many times was the ball at a height of 2 feet?
1
2
3
4
The correct Answer is:C
Since the graph shows the height of the ball above the ground after it was dropped, the number of times the ball was at a height of 2 feet is equal to the number of times the graph crosses the horizontal grid line that corresponds to a height of 2 feet. The graph crosses this grid line three times.
Choices A, B, and D are incorrect. According to the graph, the ball was at a height of 2 feet three times, not one, two, or four times.
Similar Questions
दो गेंदे भिन्न-भिन्न क्षणों पर भिन्न- भिन्न ऊँचाईयों से गिराई जाती हैं। दूसरी गेंद को पहली गेंद गिराने के 2 s पश्चात गिराया जाता है। यदि पहली गेंद को गिराने के 5s पश्चात दोनों गेंद एक साथ जमीन पर पहुँचती हैं, तो दोनों गेंदों की प्रारम्भिक ऊँचाइयों में अंतर होगा :
05:34View Solution1 kg द्रव्यमान की एक गेंद को 9.8m की ऊँचाई से गिराया जाता है तो यह जमीन से टकराकर वापस 4.9 m की ऊँचाई तक उछलती है। यदि गेंद व जमीन के मध्य सम्पर्क समय 0.1 s हो तो आवेग तथा गेंद पर औसत बल ज्ञात कीजिए।
04:26View SolutionTwo balls are dropped to the ground from different heights. One ball is dropped 2s after the other, but both strike the ground at the same time 5s after the Ist is dropped. a) What is the difference in the heights from which they were dropped ? b) From what height was the first ball dropped?
02:44View SolutionTwo balls are dropped to the ground from different heights. One ball is dropped 2s after the other, but both strike the ground at the same time 5s after the Ist is dropped. a) What is the difference in the heights from which they were dropped? b) From what height was the first ball dropped?
View SolutionTwo balls are dropped to the ground from different heights. One ball is dropped 2s after the other, but both strike the ground at the same time 5s after the Ist is dropped. a) What is the difference in the heights from which they were dropped? b) From what height was the first ball dropped?
View Solutionएक गेंद को 10 m ऊँचाई से गिराया जाता है। यदि भूमि तल से टकराने के बाद गेंद की ऊर्जा 40% कम हो जाती है, तो गेंद वापस कितनी ऊँचाई तक उछलेगी?
02:07View SolutionTwo balls are dropped to the ground from different height . One ball is dropped 2.0s after the other, but both strike the ground at the same time 5.0 s after the 1 st is dropped.
a) What is the different in the heights from which they were dropped ?
b) From what height was the first ball dropped ?View SolutionA ball which is at rest. It is dropped from a height. After hitting the ground, it bounces above 80% velocity when it collides. Then the height obtained by the ball is
04:04View Solution


