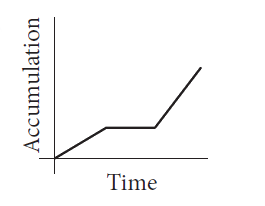
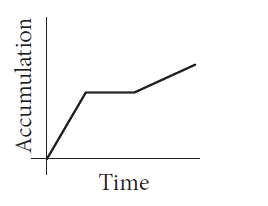
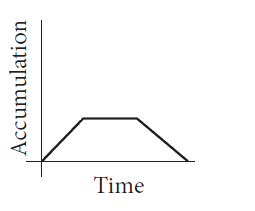
Snow fell and then stopped for a time. When the snow began to fall again, it fell at a faster rate than it had initially. Assuming that none of the snow melted during the time indicated, which of the following graphs could model the total accumulation of snow versus time?


The correct Answer is:A
To solve the problem of modeling the total accumulation of snow versus time given the conditions in the question, we can break down the situation step by step.
1. Understanding the Situation:
- Initially, snow falls and accumulates over time.
- After a certain period, the snow stops falling, leading to a period of no accumulation.
- When the snow begins to fall again, it does so at a faster rate than the initial snowfall.
2. Graphing the Accumulation:
- First Phase (Snow Falling): During the initial snowfall, the accumulation of snow increases over time. This would be represented by a curve that rises steadily.
- Second Phase (Snow Stops): After the snow stops falling, the accumulation remains constant. This means the graph will have a horizontal line (constant accumulation) for the duration of this phase.
- Third Phase (Snow Falls Faster): When the snow resumes falling at a faster rate, the accumulation will increase again, but at a steeper slope than the initial phase. This means the graph will show a steeper upward curve.
3. Identifying the Correct Graph:
- We need to look for a graph that shows:
- An initial upward slope (snow falling).
- A flat line (snow stopped).
- A steeper upward slope (snow falling faster).
- Based on the description, the graph that meets these criteria would be the one that shows these three distinct phases.
4. Evaluating the Options:
- Option A: Matches the described behavior with the three phases.
- Option B: Shows an initial faster accumulation, which contradicts the problem statement.
- Option C: Indicates a decrease in accumulation, which is not possible as per the problem.
- Option D: Shows a constant rate of accumulation, which does not reflect the faster snowfall later.
5. Conclusion:
- The correct graph that models the total accumulation of snow versus time is Option A.
- Initially, snow falls and accumulates over time.
- After a certain period, the snow stops falling, leading to a period of no accumulation.
- When the snow begins to fall again, it does so at a faster rate than the initial snowfall.
- First Phase (Snow Falling): During the initial snowfall, the accumulation of snow increases over time. This would be represented by a curve that rises steadily.
- Second Phase (Snow Stops): After the snow stops falling, the accumulation remains constant. This means the graph will have a horizontal line (constant accumulation) for the duration of this phase.
- Third Phase (Snow Falls Faster): When the snow resumes falling at a faster rate, the accumulation will increase again, but at a steeper slope than the initial phase. This means the graph will show a steeper upward curve.
- We need to look for a graph that shows:
- An initial upward slope (snow falling).
- A flat line (snow stopped).
- A steeper upward slope (snow falling faster).
- Based on the description, the graph that meets these criteria would be the one that shows these three distinct phases.
- Option A: Matches the described behavior with the three phases.
- Option B: Shows an initial faster accumulation, which contradicts the problem statement.
- Option C: Indicates a decrease in accumulation, which is not possible as per the problem.
- Option D: Shows a constant rate of accumulation, which does not reflect the faster snowfall later.
- The correct graph that models the total accumulation of snow versus time is Option A.
Similar Questions
हिमोजाइन है एक-
04:35View Solutionबर्फ का गलन है
02:17View Solutionनिम्नलिखित कथन के विलोम लिखिए:
यदि बर्फ गिर रही है, तो मौसम ठण्डा होगा।02:04View SolutionDuring thaw (melting of snow ) the atmosphere gets:
01:21View SolutionDirty snow melts very slowly
01:25View SolutionExplain why,snow shoes stop you from sinking into snow.
03:28View SolutionWhen does snow and hialstones fall ?
05:56View Solutionकम्बल से ढकने पर बर्फ नहीं पिघलती
View Solution

