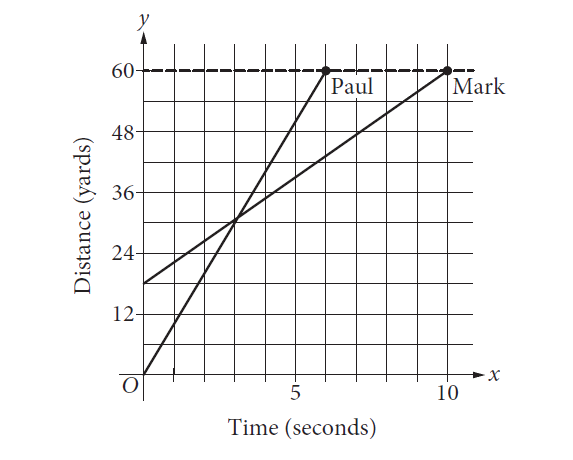
The graph above shows the positions of Paul and Mark during a race. Paul and Mark each ran at a constant rate, and Mark was given a head start to shorten the distance he needed to run. Paul finished the race in 6 seconds, and Mark finished the race in 10 seconds. According to the graph, Mark was given a head start of how many yards?
A
3
B
12
C
18
D
24
Video Solution
Text Solution
The correct Answer is:C
The lines shown on the graph give the positions of Paul and Mark during the race. At the start of the race, 0 seconds have elapsed, so the y-intercept of the line that represents Mark’s position during the race represents the number of yards Mark was from Paul’s position (at 0 yards) at the start of the race. Because the y-intercept of the line that represents Mark’s position is at the grid line that is halfway between 12 and 24, Mark had a head start of 18 yards.
Choices A, B, and D are incorrect. The y-intercept of the line that represents Mark’s position shows that he was 18 yards from Paul’s position at the start of the race, so he did not have a head start of 3, 12, or 24 yards.
|
Similar Questions
Find the area of the figure given below.

View SolutionCalculate the volume of the given solid.
ltimg src="https://d10lpgp6xz60nq.cloudfront.net/physics_images/PS_MATH_VII_C06_E03_002_Q01.png" width="80%"gt
View SolutionThe area of the shaded part in the figure given below is ______.

View SolutionThe inequation represented by the graph given below is :
View SolutionThe inequation that best describes the graph given below is _________
View SolutionThe inequation that best describes the following graph is _________
View SolutionWhich inequations represent the shaded region in the given figure
View SolutionMatch the items given in column A and B: ltimg src="https://d10lpgp6xz60nq.cloudfront.net/physics_images/NCERT_BIO_XII_C16_E01_004_Q01.png" width="80%"gt
View Solution
