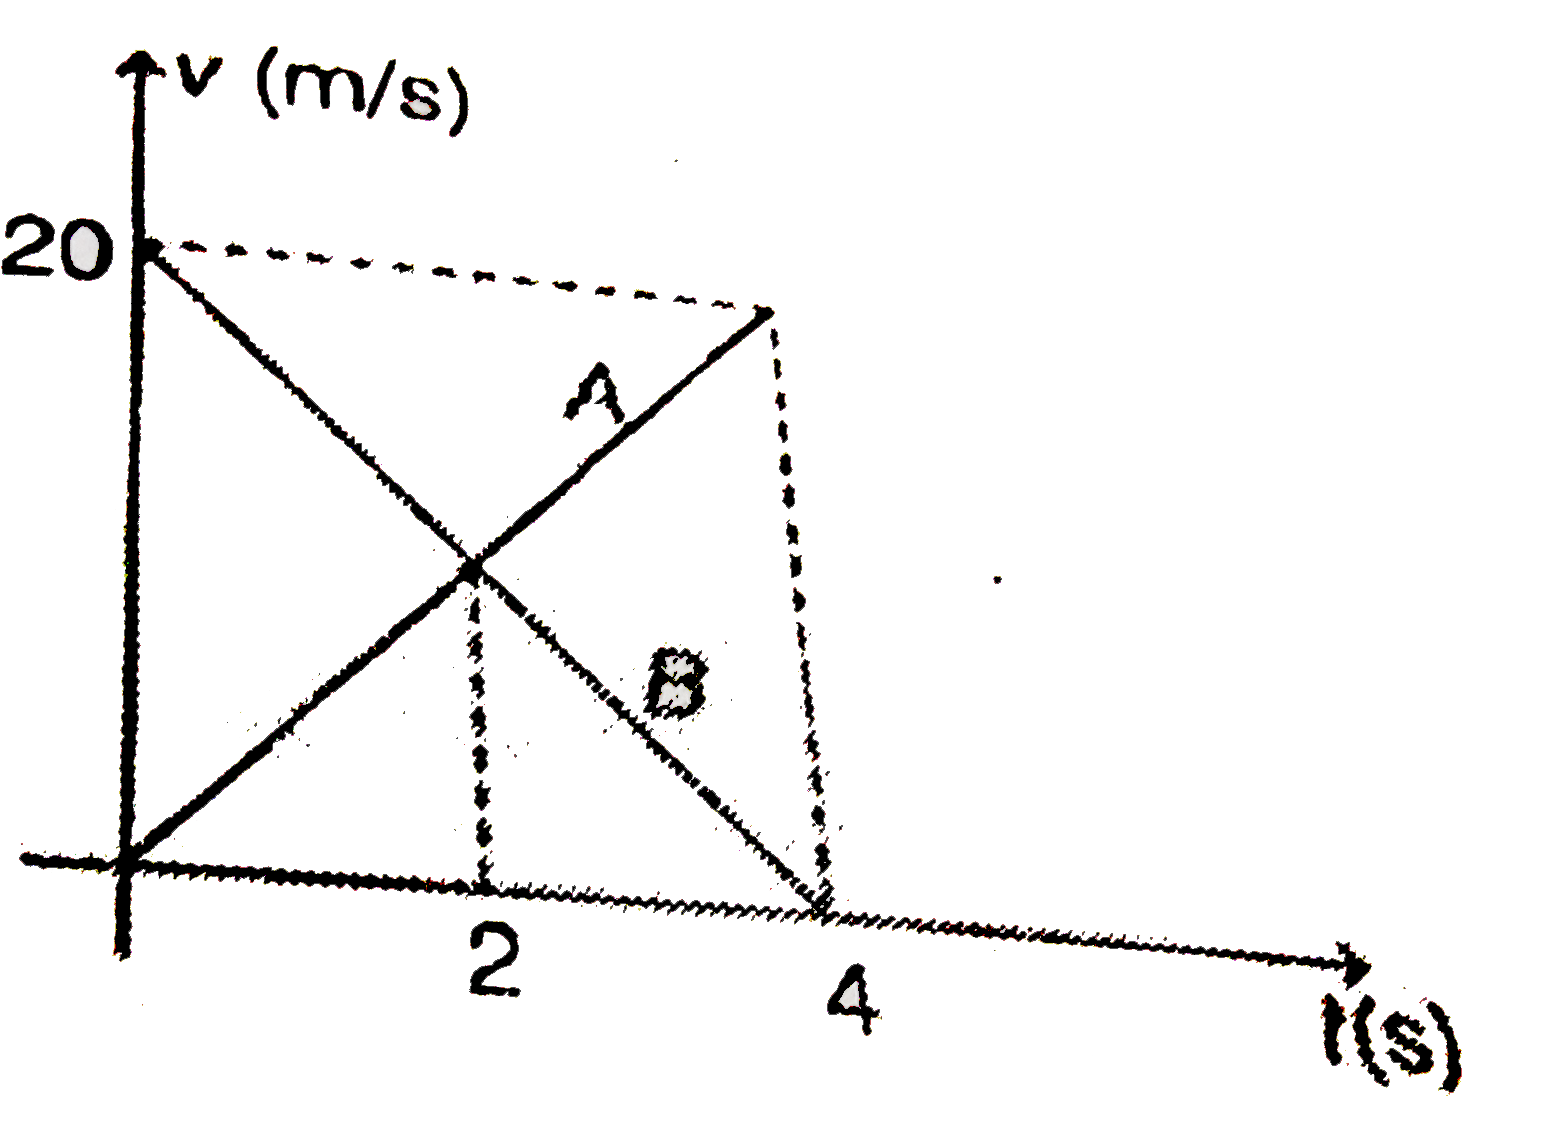
Speed time graph of two cars A and B approaching towards each other is shown in figure. Initial distance between them is 60m. The two cars will cross each other after t secons. Find value of it t.

The correct Answer is:3
Step by step video, text & image solution for Speed time graph of two cars A and B approaching towards each other is shown in figure. Initial distance between them is 60m. The two cars will cross each other after t secons. Find value of it t. by Physics experts to help you in doubts & scoring excellent marks in Class 11 exams.
Updated on:21/07/2023Topper's Solved these Questions
Similar Questions
Knowledge Check
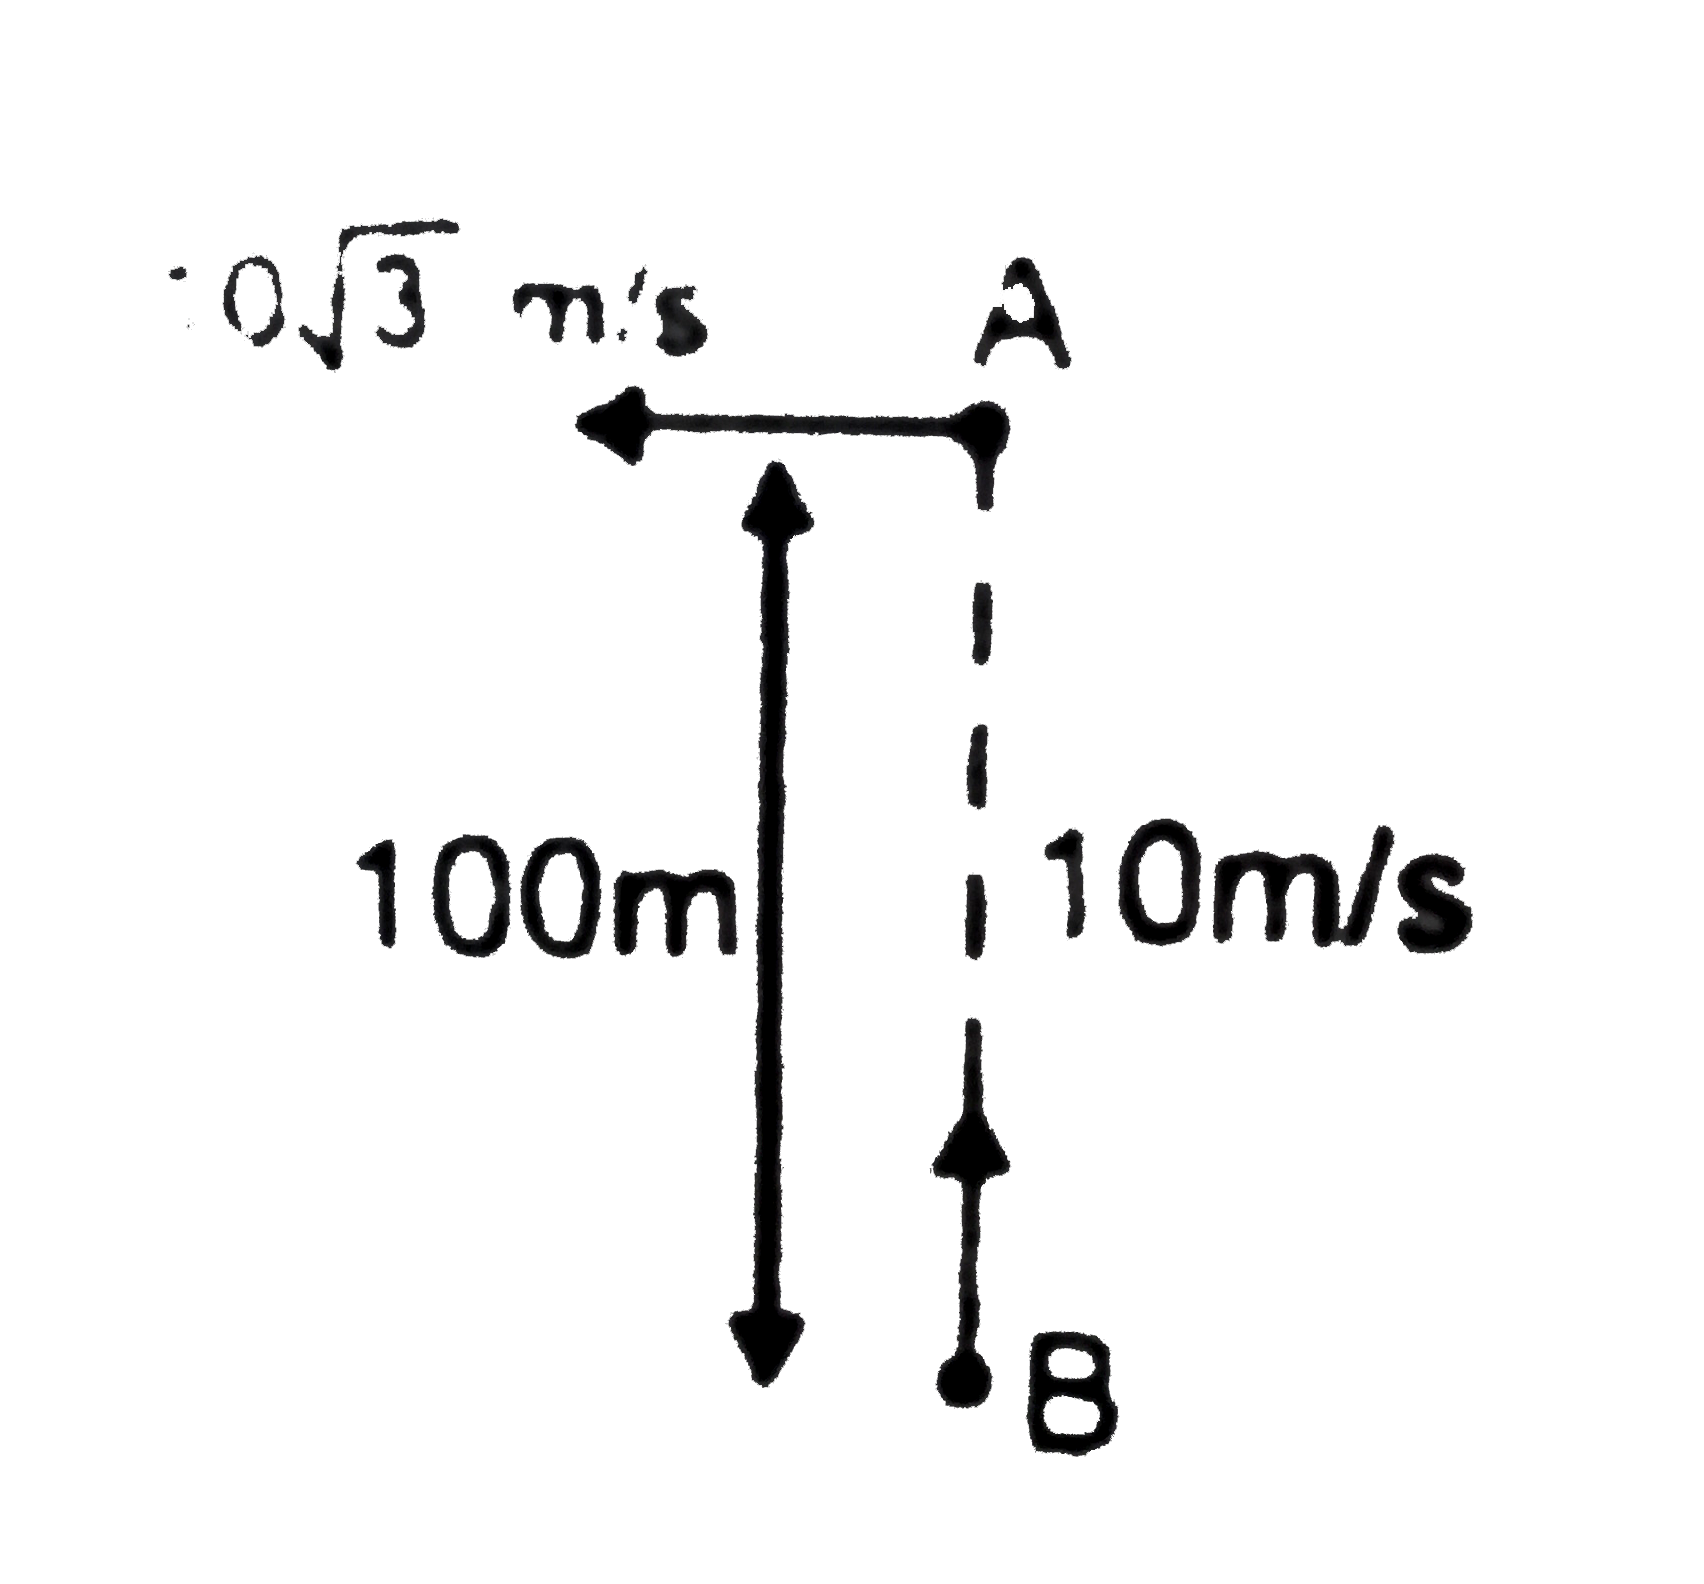
Consider two cars moving perpendicular to each other as shown. Initially distance between 100m. Velocity of A is 10√3 m/s and velocity of B is 10m/s. Then
 Amagnitude of velocity of A w.r.t. B is 20m/sBminimum distance between them is 50mCminimum distance between them is 50√3mDat t=2sec. They will be nearest to each other
Two trains are 2 km apart. Their lengths are 200 m and 300 m. They are approaching towards each other with speed of 20m/s and 30m/s respectively. They will cross each other after :
A150 sB100 sC50 sD253sTwo trains are 2 km apart. Their lengths are 200 m and 300 m. They are approaching towards each other with speed of 20m/s and 30m/s respectively. They will cross each other after :
A150 sB100 sC50 sD253s
Distance between two stations A and B is 690 km. Two cars start simultaneously from A and B towards each other, and the distance between them after 6 hours is 30 km. If the speed of one car is less than the other by 10 km/hr, find the speed of each car.
View SolutionTwo waves are approaching each other with a velocity of 16 m/s and frequency n. The distance between two consecutive nodes is
View SolutionTwo waves are approaching each other with a velocity of 20m/s and frequency n. The distance between two consecutive nodes is
View SolutionWhen two bodies approach each other with the different speeds, the distance between them decreases by 120m for every 1min.The speeds of the bodies are
View SolutionTwo cars are travelling towards each other with speed of 45 km/hr and 63km/hr respectively. What is the distance (in kilometres) between the two cars ten second before they collide?
View Solution


