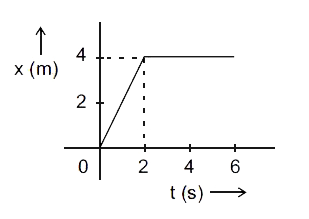
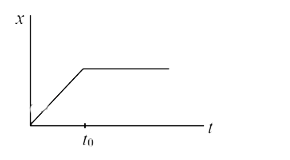
Figure shows the position-time graph of a particle of mass 0.04kg. Suggest a suitable physical context for this motion. What is the time between two consecutive impulses received by the particle? What is the magnitude of each impluse?
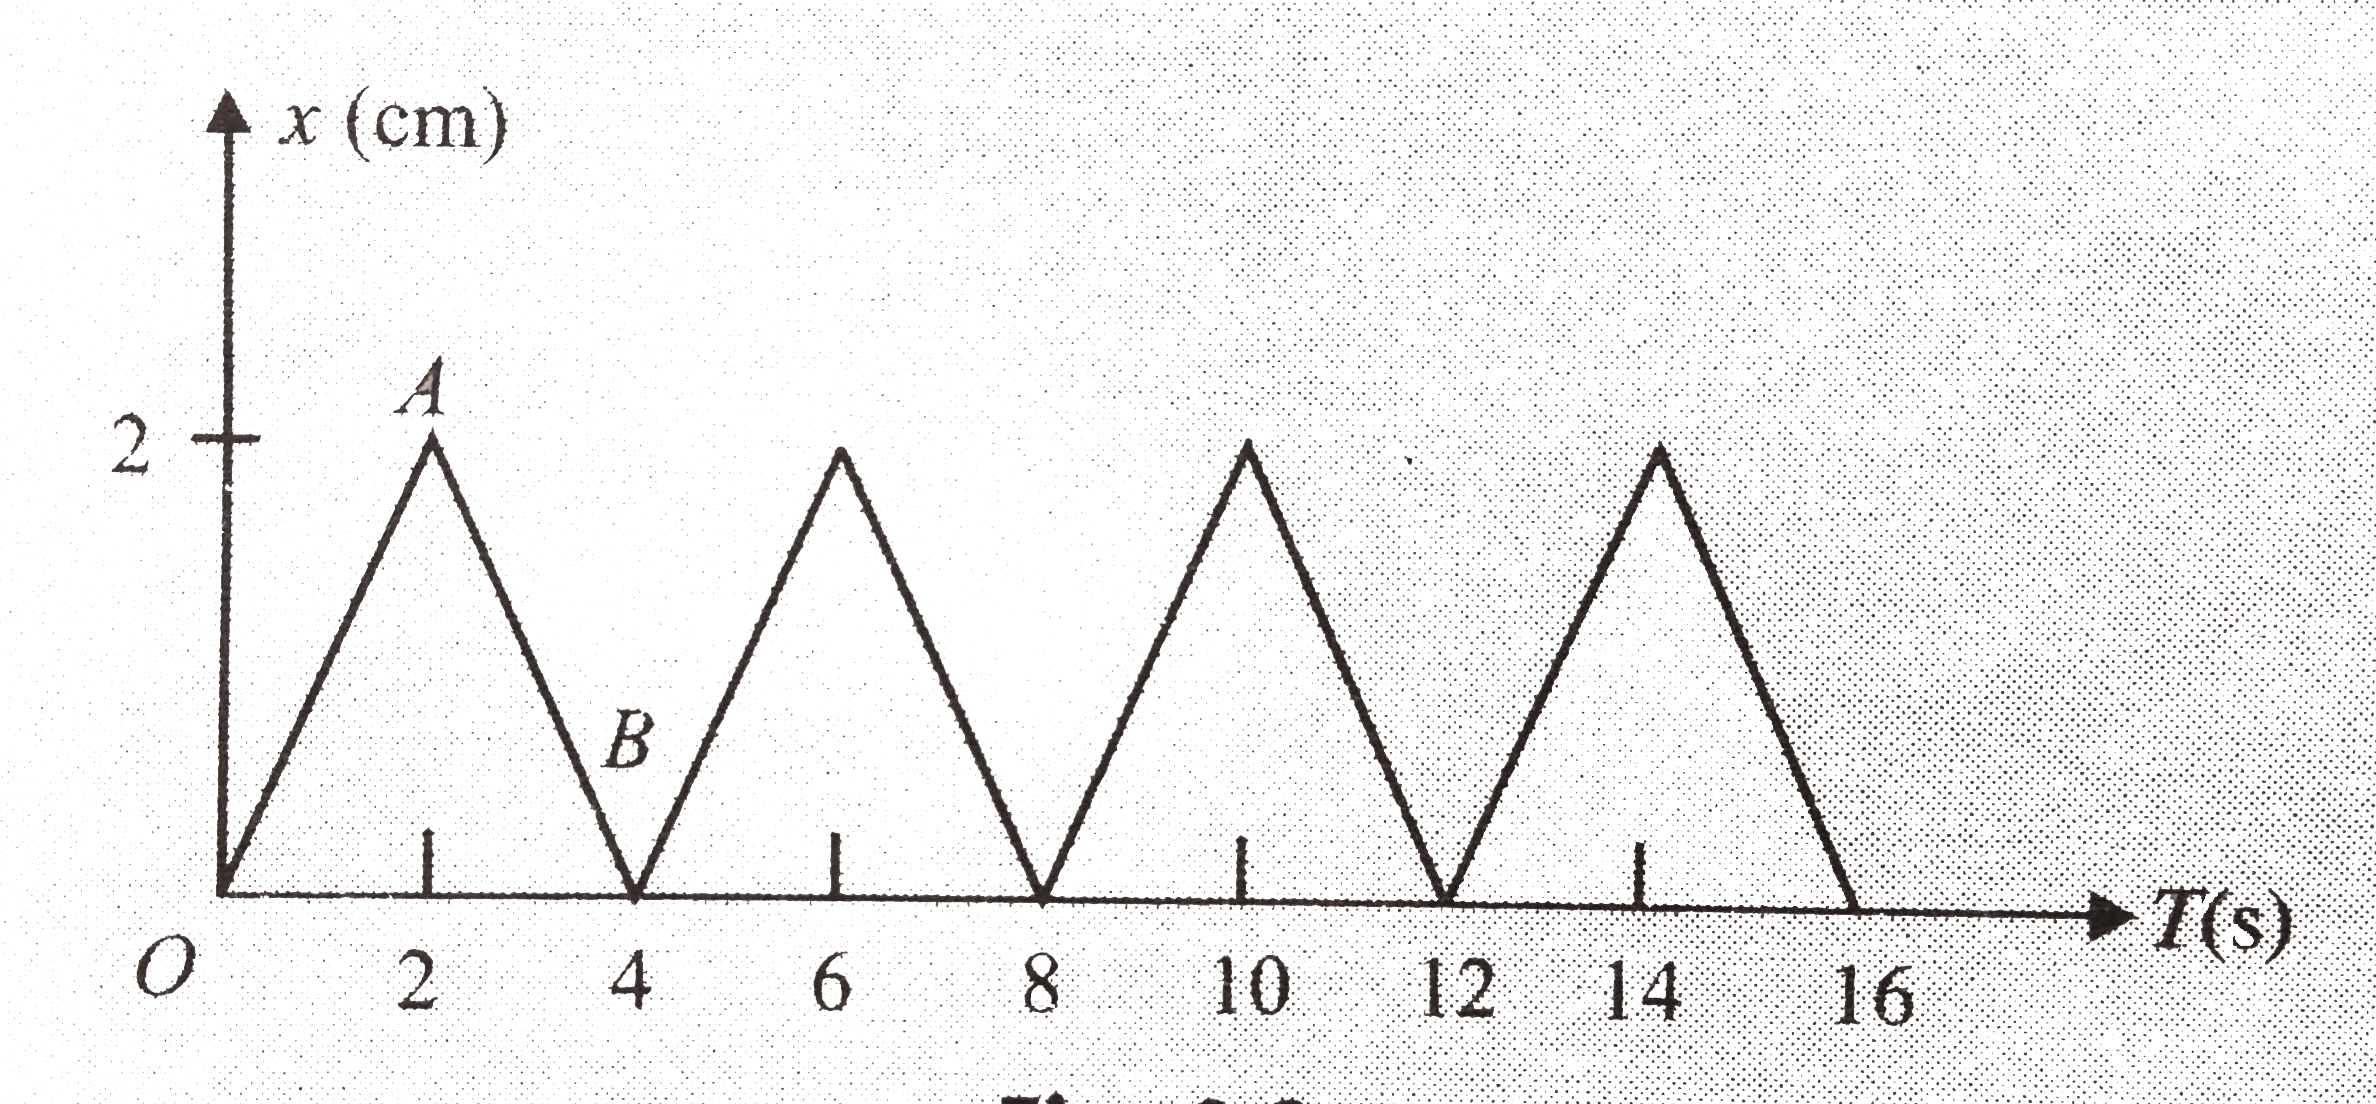
Step by step video & image solution for Figure shows the position-time graph of a particle of mass 0.04kg. Suggest a suitable physical context for this motion. What is the time between two consecutive impulses received by the particle? What is the magnitude of each impluse? by Physics experts to help you in doubts & scoring excellent marks in Class 11 exams.
Updated on:21/07/2023Topper's Solved these Questions
- LAWS OF MOTION : FRICTIONBOOK - SL ARORACHAPTER - LAWS OF MOTION : FRICTIONEXERCISE - Problems
17 Videos
- LAWS OF MOTION : FRICTIONBOOK - SL ARORACHAPTER - LAWS OF MOTION : FRICTIONEXERCISE - Self Practice
95 Videos
- Laws of MotionBOOK - SL ARORACHAPTER - Laws of MotionEXERCISE - Exercise
627 Videos
- Mathematical toolsBOOK - SL ARORACHAPTER - Mathematical toolsEXERCISE - Exercise
20 Videos
Similar Questions
Shows the position time graph of a particle of mass 0.04 kg Suggest a suitable physical context for this motion What is the time between two conscutive impulse recevived by the particle ? What is the magnitude of each impulse ?
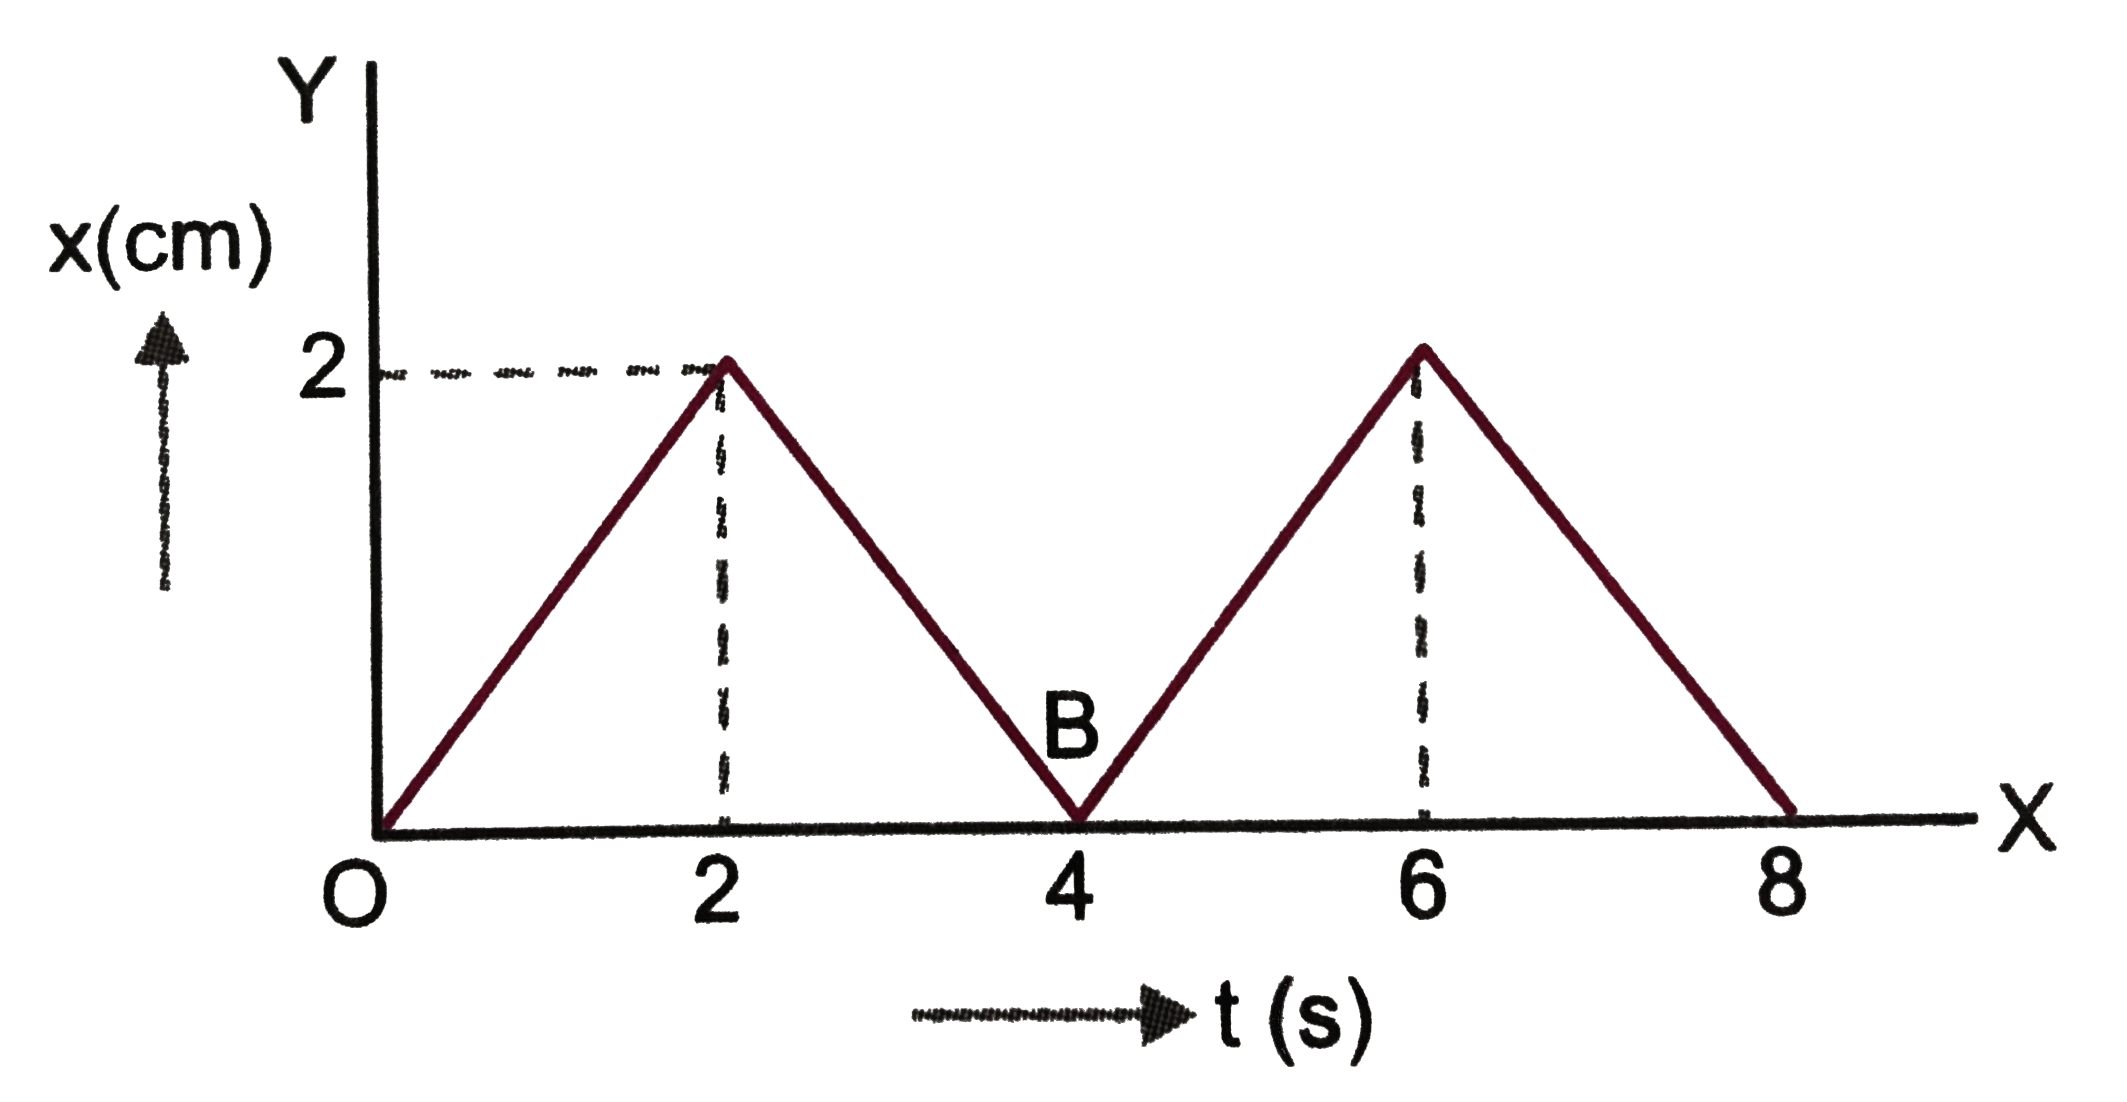
View SolutionThe position-time graph of a particle of mass 0.1 kg is shown. The impulse at t = 2s is :
View Solution
Knowledge Check
The position-time graph of a body of mass 0.04kg is shown in the figure. The time between two consecutive impulses received by the body and the magnitude of each impulse is
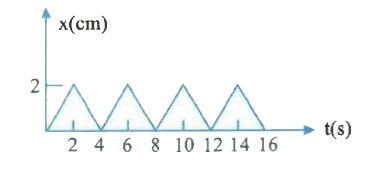 A4sec,4×10−4kgm/sB2sec,8×10−4kgm/sC6sec,4×10−4kgm/sD8sec,8×10−4kgm/s
The position-time graph of a particle of mass 0.1 kg is shown. The impulse at t = 2s is :
 A0.2kgms−1B0.02kgms−1C0.1kgms−1D0.4kgms−1
In the figure given, the position-time graph of a particle of mass 0.1 kg is shown the impulse at t = 2s is
 A0.2 kg m/sB−0.2 kg m/sC0.1 kg m/sD−0.4 kg m/s
In the figure, the position time graph of a particle of mass 0.1 kg is shown. The impulse at t=2 second is :
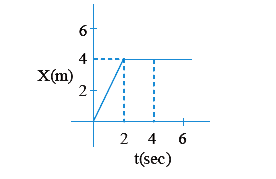
View SolutionIn the figure given below, the position-time graph of a particle of mass 0.1kg is shown. The impuslse at t=2 sec is
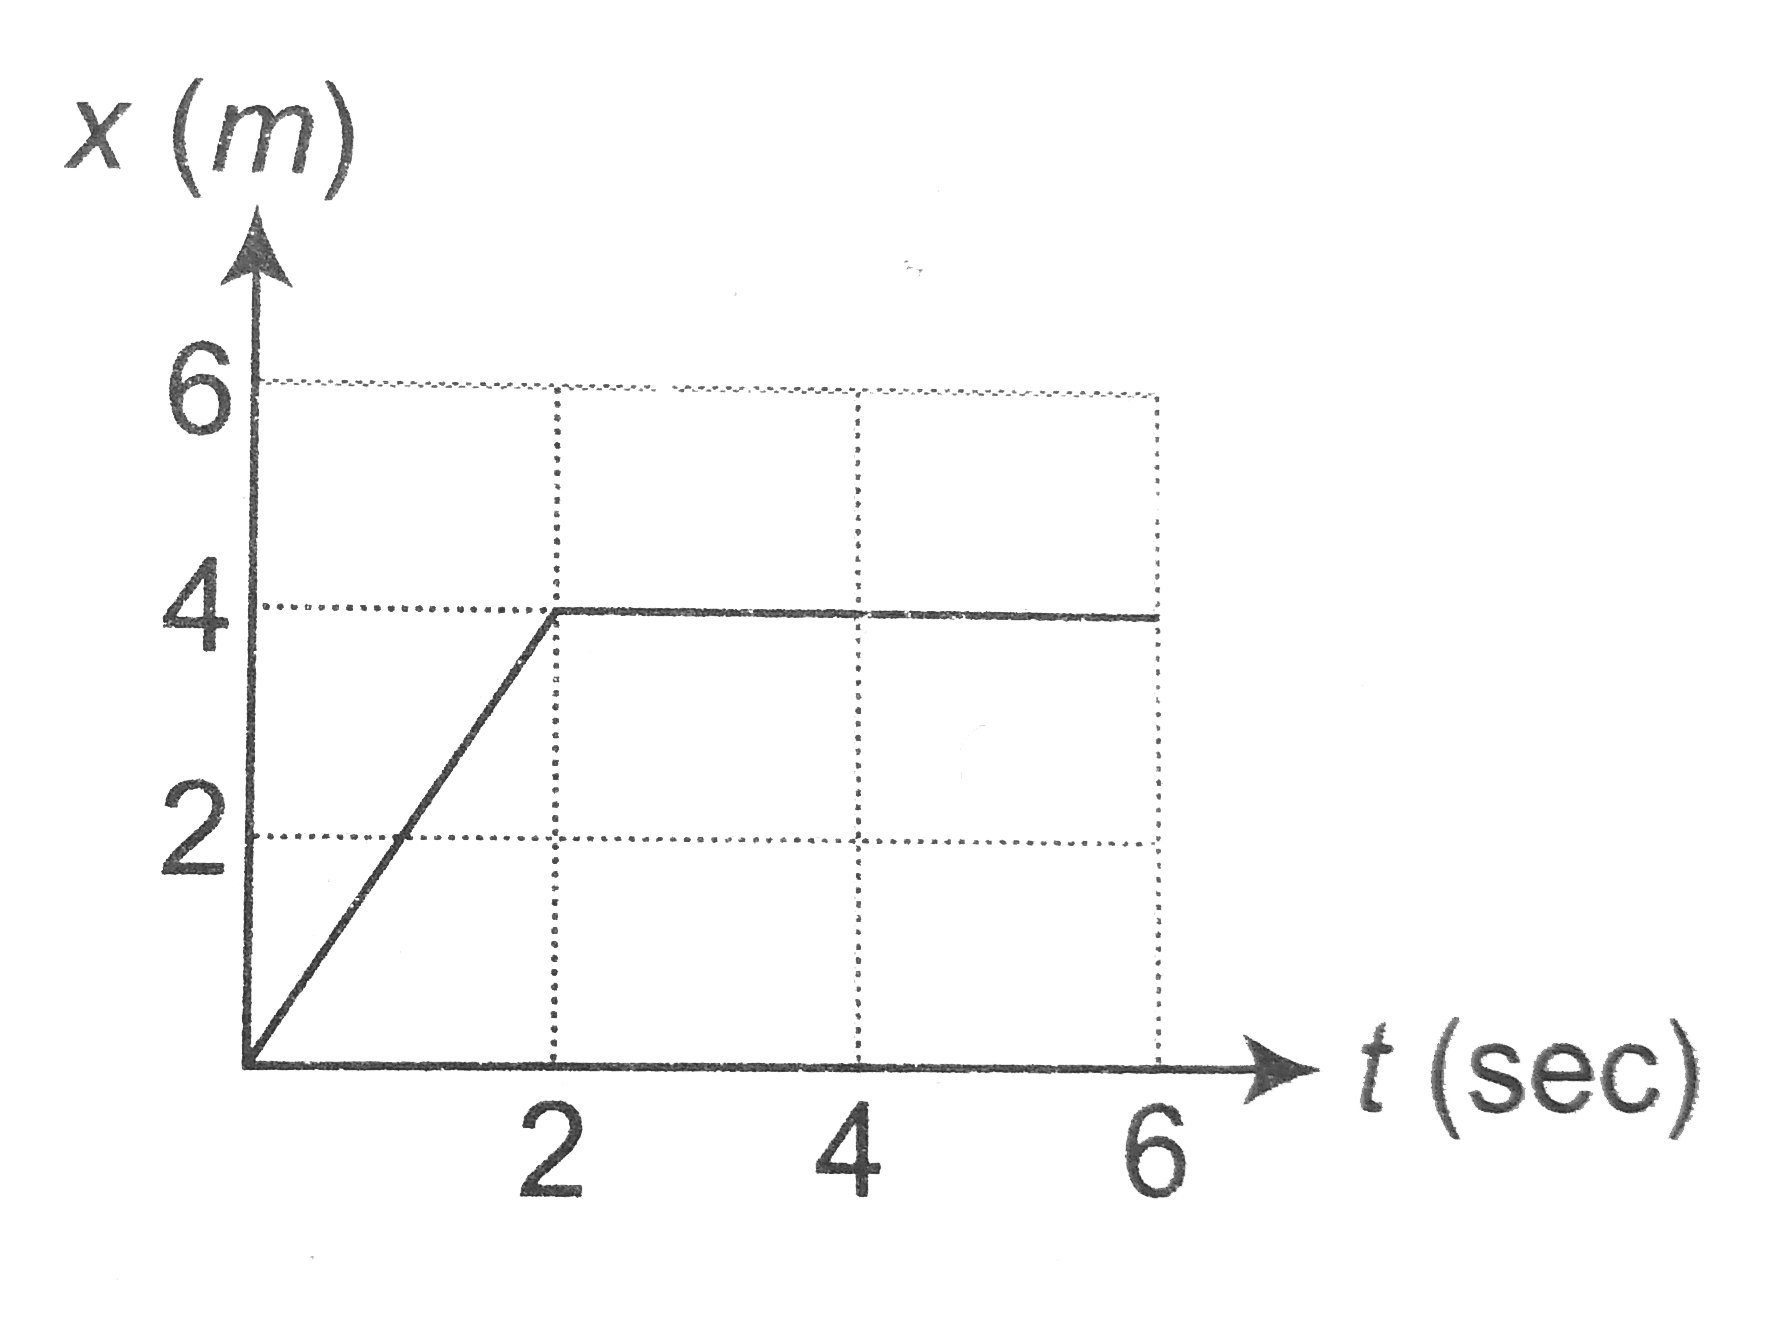
View SolutionIn the figure given below, the position time graph of a particle of mass 0.1kg is shown. The impulse at t=2 sec is
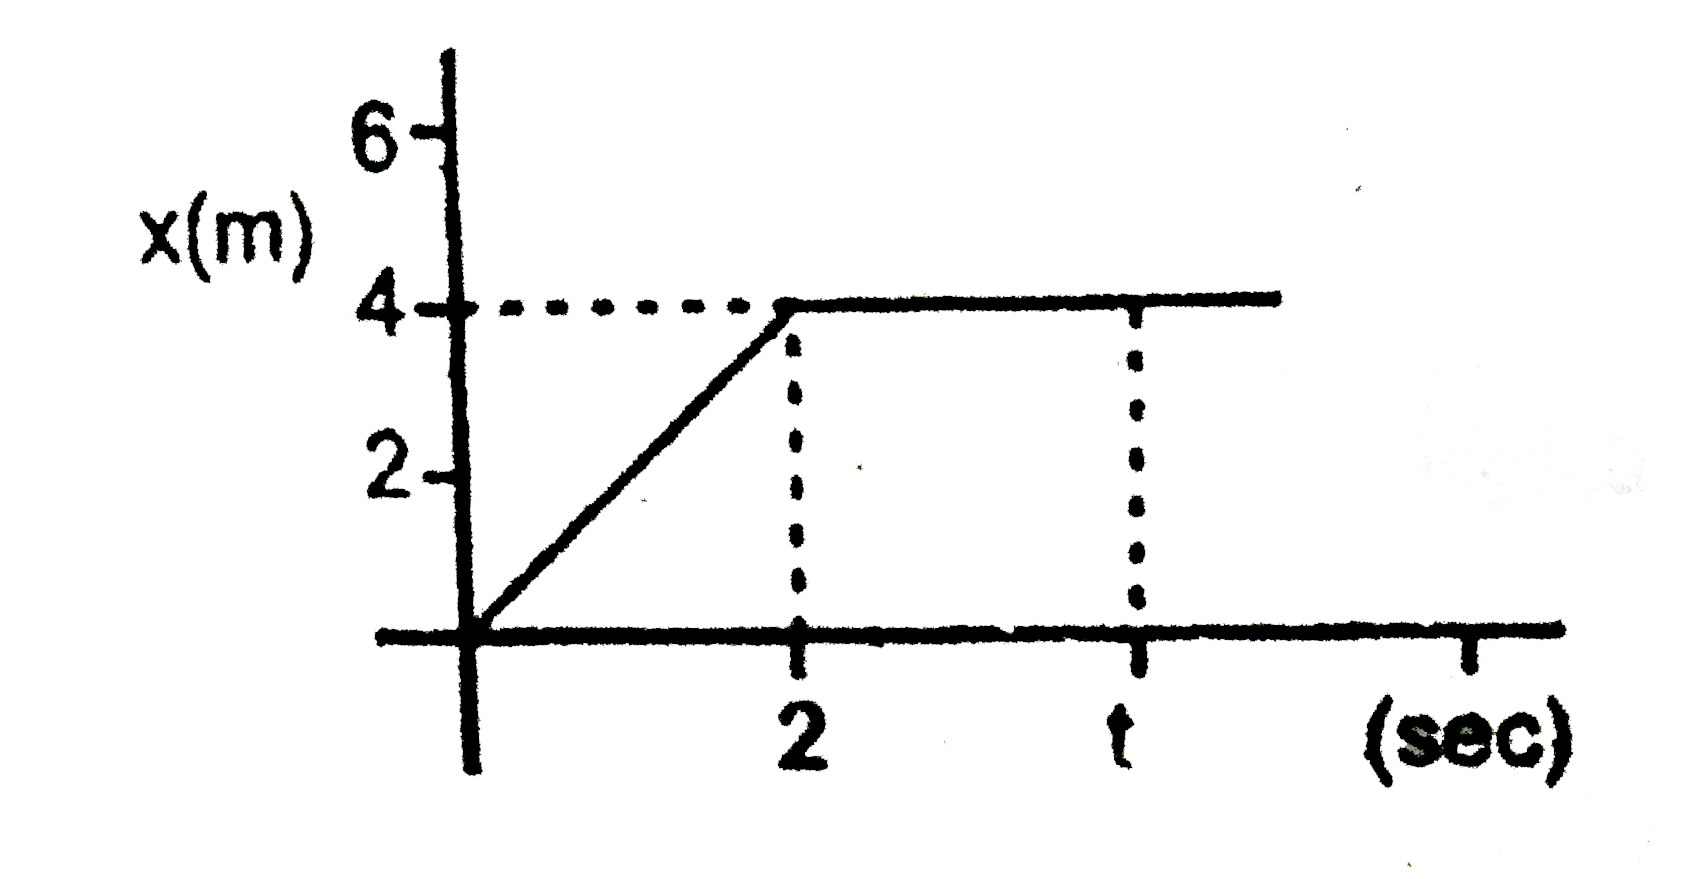
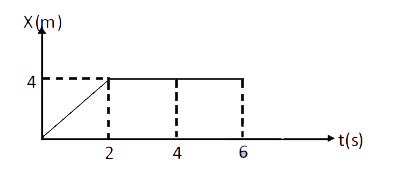
View SolutionFigure shows the position-time graph of a particle moving on the X--axis. Which of these option correctly describes the particle 's motion?
View SolutionFigure shows the position time graph of a particle of mass 5kg. The force acting on the particle for 0<t<4s and 8s<t<12s respectively are,

View Solution
