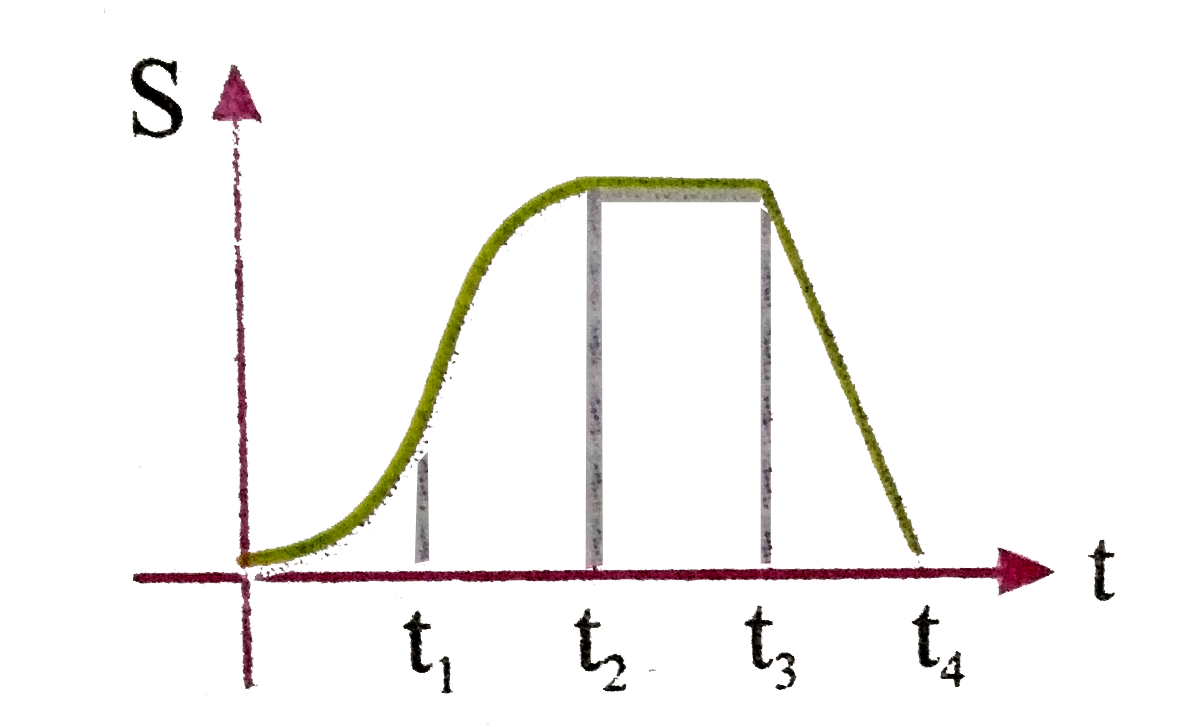
Displacement time graph of a particle moving in a straight line is as shown in figure.
From the graph we can conclude that work done on the block is :
 .
.
positive from 0 to t1
negative from t1 to t2
zero from t2 to t3
negative from t3 to t4
The correct Answer is:A, B, C
Step by step video, text & image solution for Displacement time graph of a particle moving in a straight line is as shown in figure. From the graph we can conclude that work done on the block is : . by Physics experts to help you in doubts & scoring excellent marks in Class 11 exams.
Updated on:21/07/2023Topper's Solved these Questions
- WORK, POWER AND ENERGYBook:DC PANDEYChapter:WORK, POWER AND ENERGYExercise:C Comprehension Type Questions
Explore 18 Videos
- WORK, POWER AND ENERGYBook:DC PANDEYChapter:WORK, POWER AND ENERGYExercise:D Matrix Matching Type Questions
Explore 10 Videos
- WORK, POWER AND ENERGYBook:DC PANDEYChapter:WORK, POWER AND ENERGYExercise:A Only One Option is Correct
Explore 42 Videos
- WORK, ENERGY AND POWERBook:DC PANDEYChapter:WORK, ENERGY AND POWERExercise:MEDICAL ENTRACES GALLERY
Explore 33 Videos
Similar Questions
The displacement-time graph for a particle moving in a straight line is as shown in the figure. Determine the velocity of the particle at t=1s,3s and 6s. Sketch the velocity-time graph.
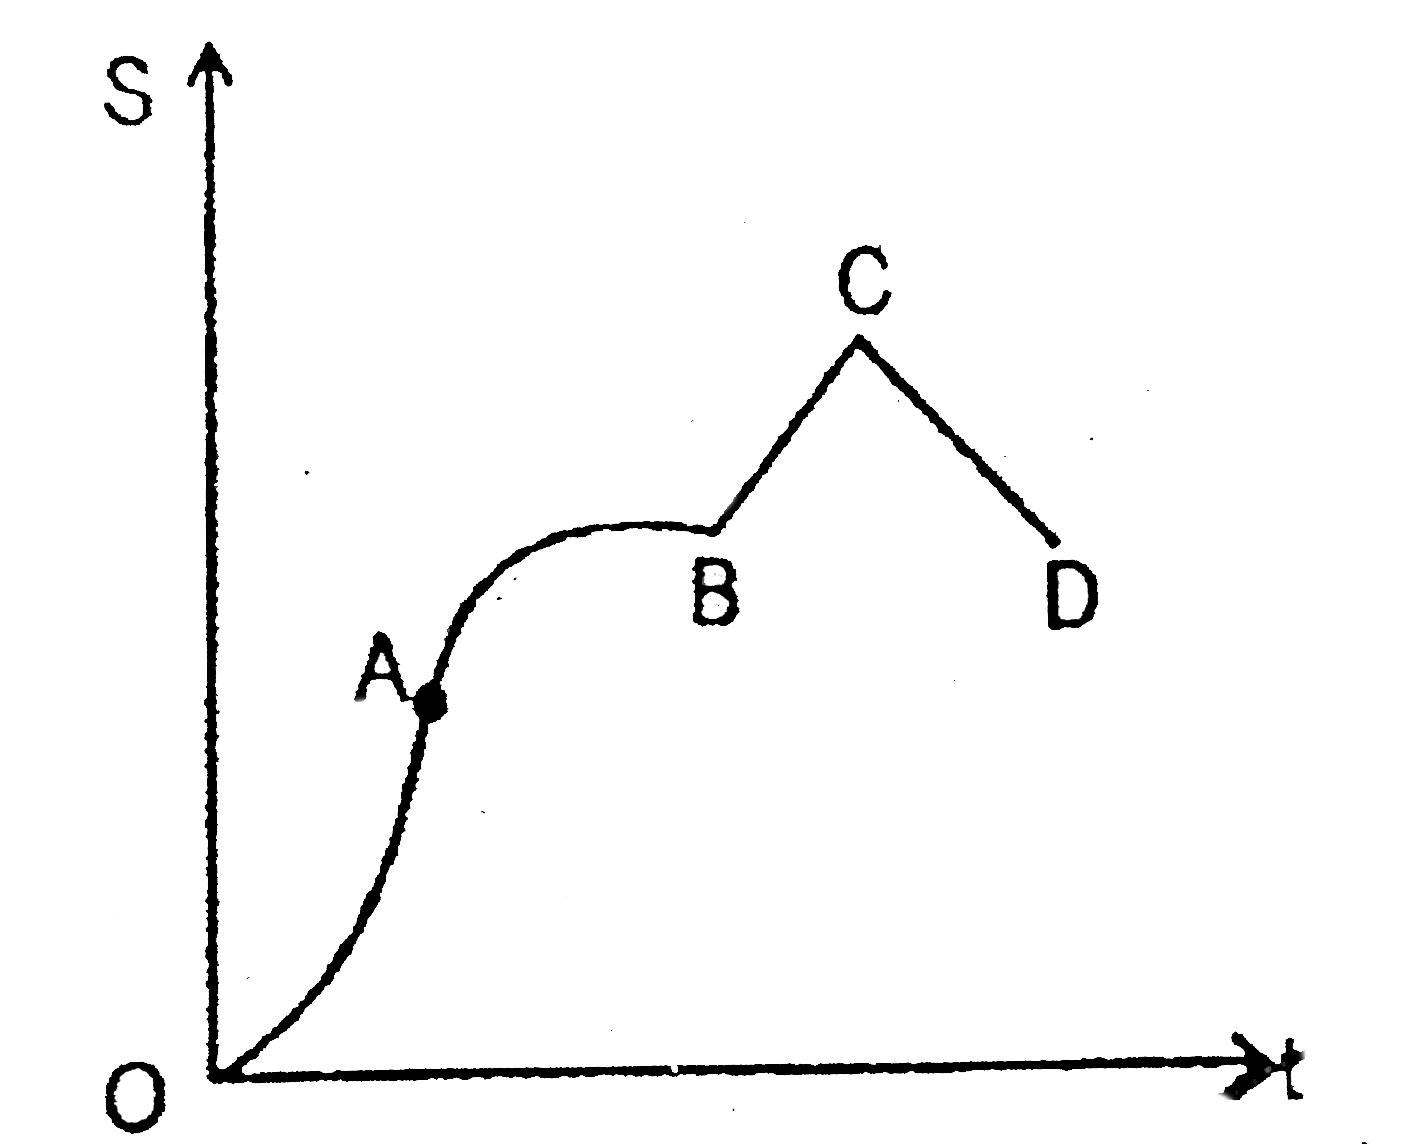
View SolutionDisplacment-time graph of a particle moving in a straight line is as shown in figure. Choose the INCORRECT statement(s)
View Solution
Knowledge Check
Displacement time graph of a particle moving in a straight line is a shown in figure.
 Ain region A acceleration is positiveBin region B acceleration is negativeCin region C acceleration is positiveDin region D acceleration is negative
Velocity displacement graph of a particle moving in a straight line is as shown in figure.
 Amagnitude of acceleration of particle is decreasingBmagnitude of acceleration of particlre is increasingCacceleration versus displacement graph straight lineDacceleration versus displacement graph is parabola
Displacement time graph of a particle moving in a straight line is as shown in figure. Select the correct alternative (s) :
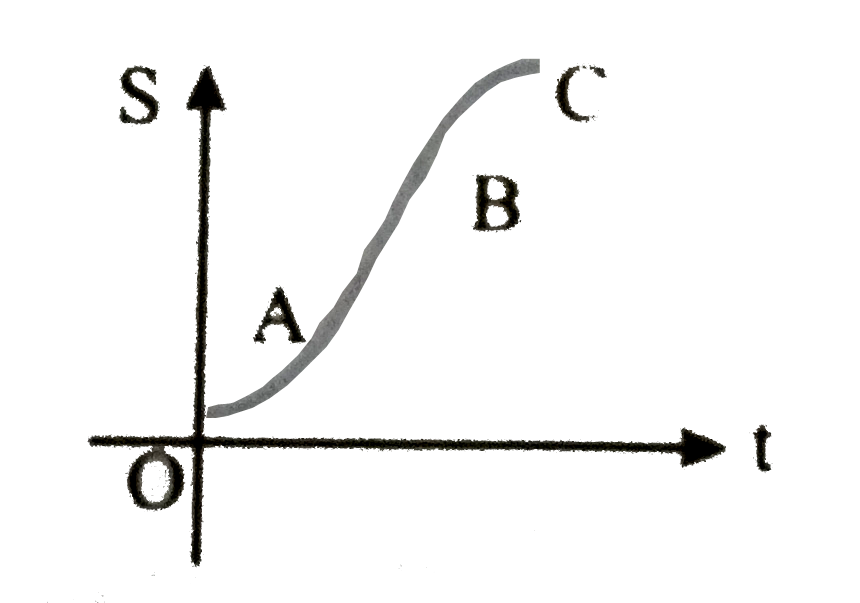 .AWork done by all the forces in region OA and BC is positiveBWork done by all the forces in region AB is zeroCWork done by the forces in region BC is negativeDWork done by all the forces in region OA is negative.
Displacement-time graph of a particle moving in a straight line is as shown in figure.
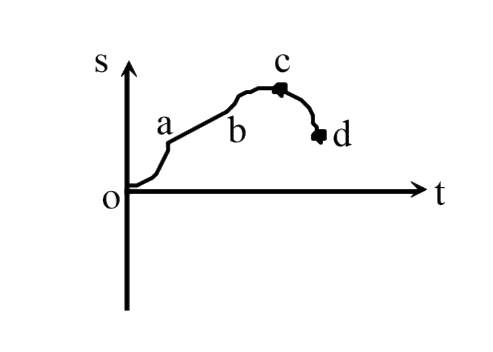
Q. Find the sign of acceleration in the above region
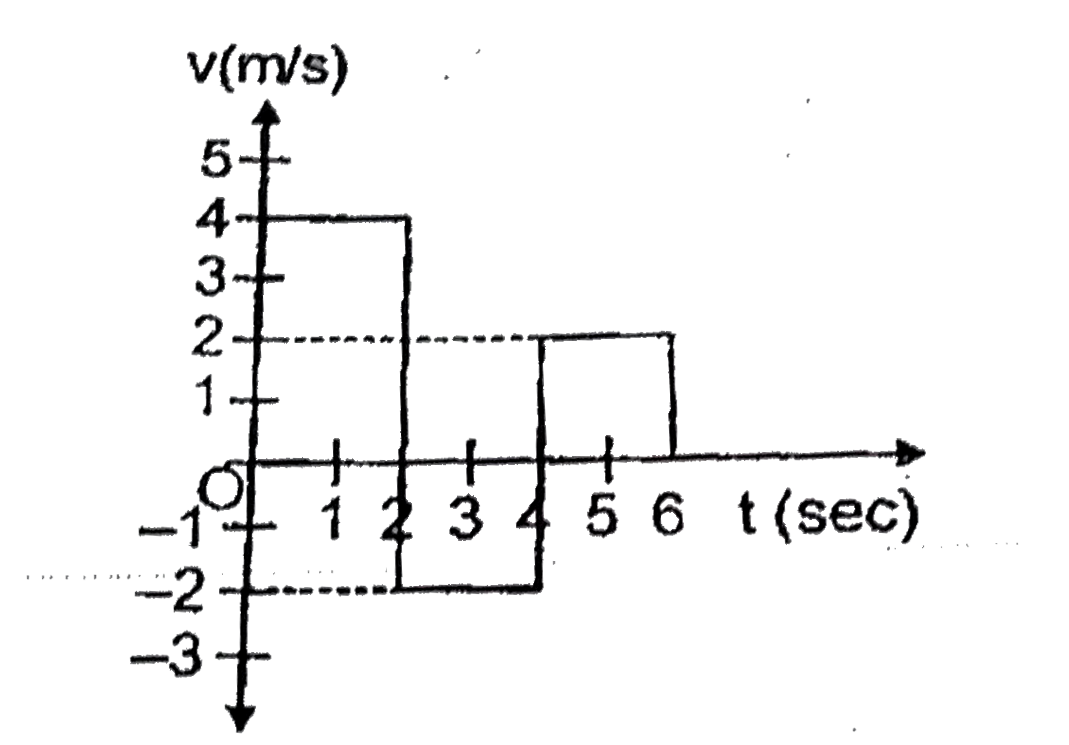
View SolutionThe velocity-time graph of a body moving in a straight line is shown in the figure.
View SolutionVelocity versus displacement graph of a particle moving in a straight line as shown in figure.
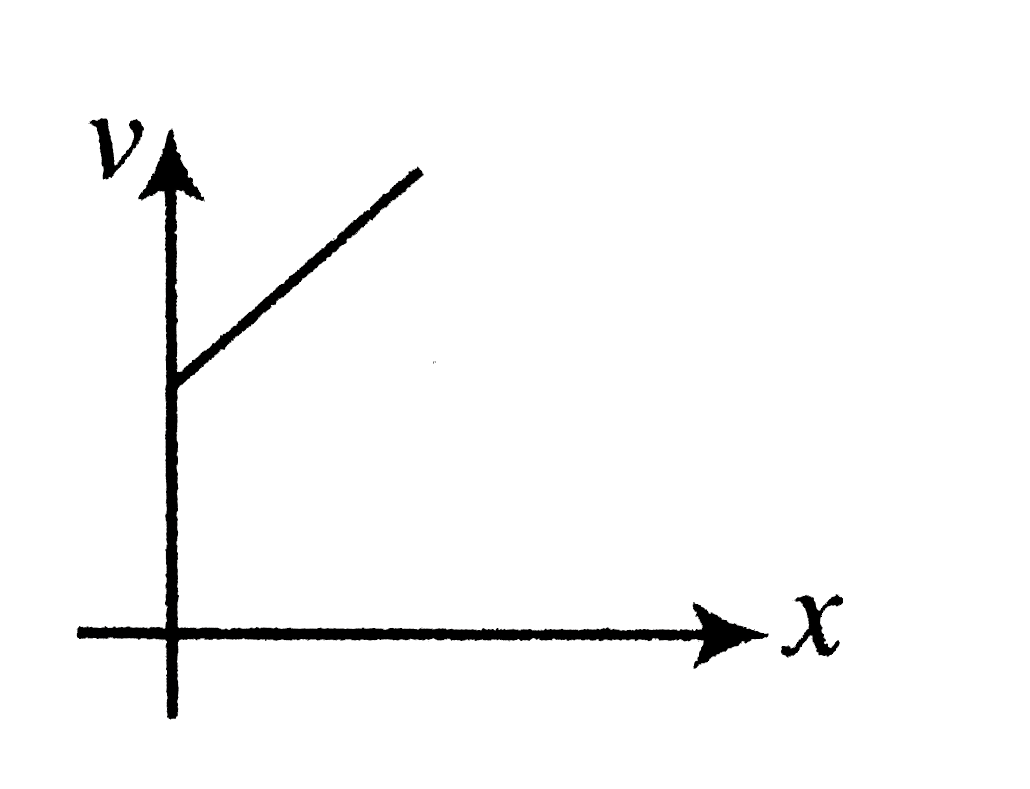
The acceleration of the particle.
View SolutionThe x-t graph of a particle moving along a straight line is shown in figure

The v-t graph of the particle is correctly shown by
View SolutionThe x-t graph of a particle moving along a straight line is shown in figure
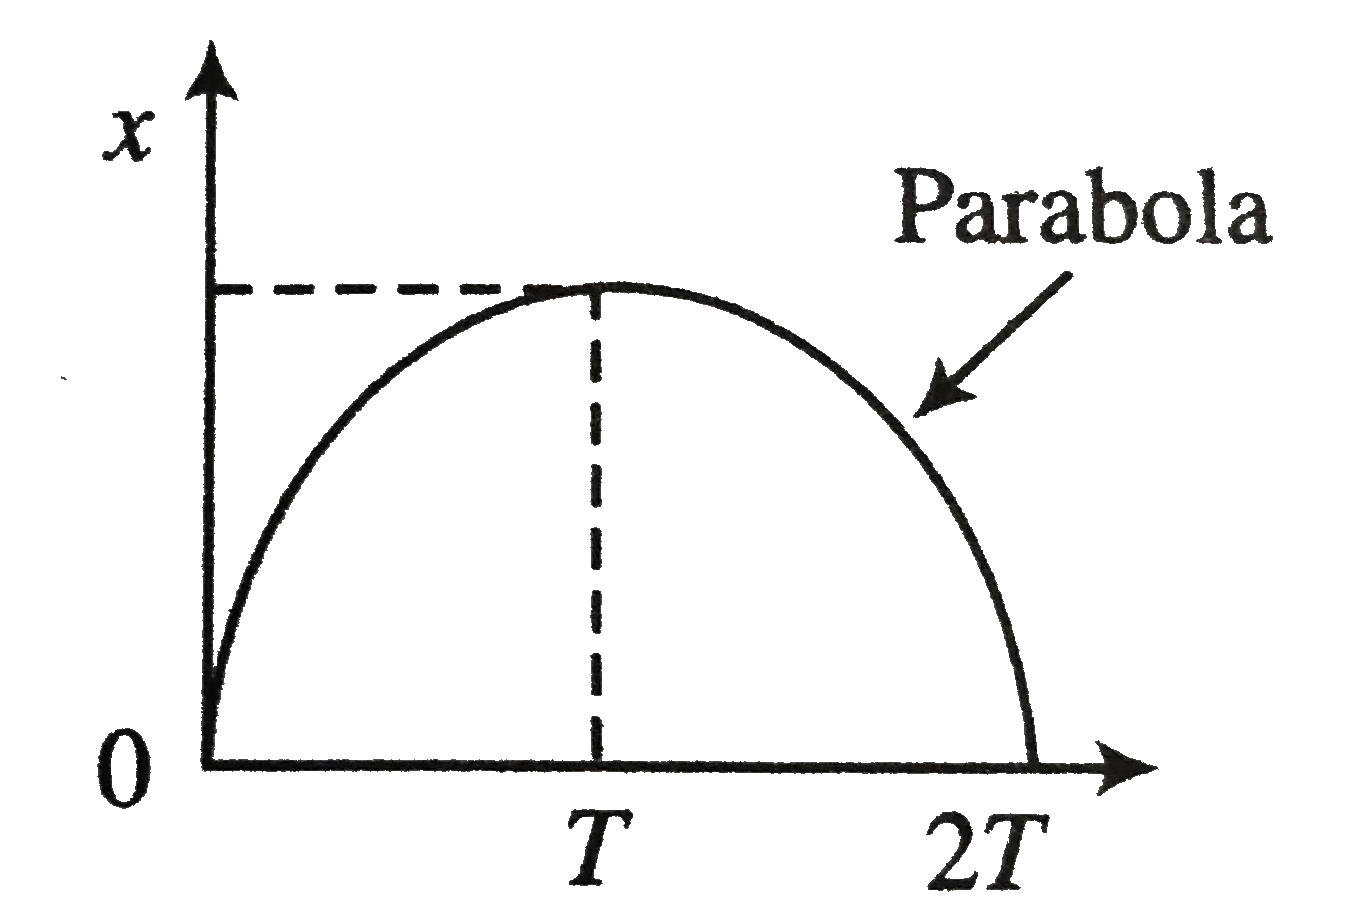
The a-t graph of the particle is correctly shown by
View Solution

