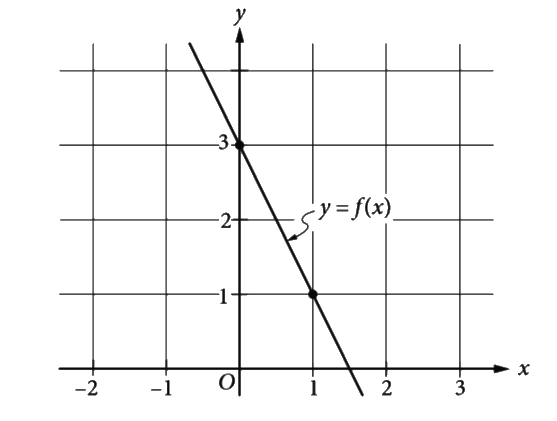
The graph of the linear function f is shown in the xy-plane above. The graph of the linear function g (not shown) is perpendicular to the graph of f and passes through the point (1,3). What is the value of g(0) ?
The correct Answer is:2.5
The graph of the linear function f passes through the points (0, 3) and (1, 1). The slope of the graph of the function f is therefore 1−31−0=-2. It’s given that the graph of the linear function g is perpendicular to the graph of the function f. Therefore, the slope of the graph of the function g is the negative reciprocal of −2, which is −1−2=12, and an equation that defines the function g is g(x)=12x+b, where b is a constant. Since it’s given that the graph of the function g passes through the point (1, 3), the value of b can be found using the equation 3=12(1)+b. Solving this equation for b yields b=52. so an equation that defines the function g is g(x)=12x+52. F inding the value of g(0) by substituting 0 for x into this equation yields g(0)=12(0)+52 or 52 . Either 2.5 or 5/2 may be entered as the correct answer.
Similar Questions
Magnitude of slope i.e. steepness of graph shown in figure ltimg src="https://d10lpgp6xz60nq.cloudfront.net/physics_images/ALN_PHY_R04_E01_026_Q01.png" width="80%"gt
View SolutionGraph of an exponential function y=2+ae−x is shown in figure. What is the value of a ?
ltimg src="https://d10lpgp6xz60nq.cloudfront.net/physics_images/ALN_PHY_R04_E01_028_Q01.png" width="80%"gt
View SolutionWhat is the distance OA for the square shown in figure :- ltimg src="https://d10lpgp6xz60nq.cloudfront.net/physics_images/ALN_PHY_R05_E01_015_Q01.png" width="80%"gt
View Solution
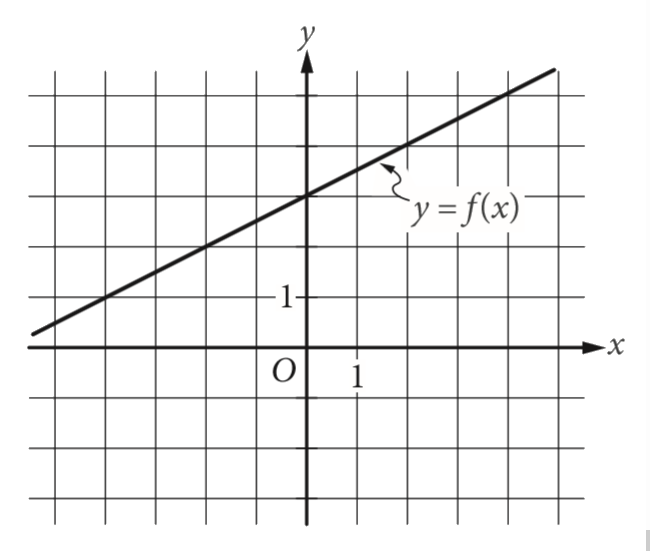
The graph of the linear functions f is shown in the xy-plane above. The slope of the graph of the linear function g is 4 times the slope of the graph of f. IF the graph of g passes through the point (0,-4) what is the value of g(9)?
View SolutionThe equation of graph shown in figure is y=2x2. The slope of graph at point P is :
ltimg src="https://d10lpgp6xz60nq.cloudfront.net/physics_images/ALN_PHY_R04_E01_023_Q01.png" width="80%"gt
View SolutionMagnitude of slope i.e. steepness of graph shown in figure
ltimg src="https://d10lpgp6xz60nq.cloudfront.net/physics_images/ALN_PHY_R04_E01_026_Q01.png" width="80%"gt
View SolutionGraph of an exponential function y=2+ae−x is shown in figure. What is the value of a ?
ltimg src="https://d10lpgp6xz60nq.cloudfront.net/physics_images/ALN_PHY_R04_E01_028_Q01.png" width="80%"gt
View Solution

