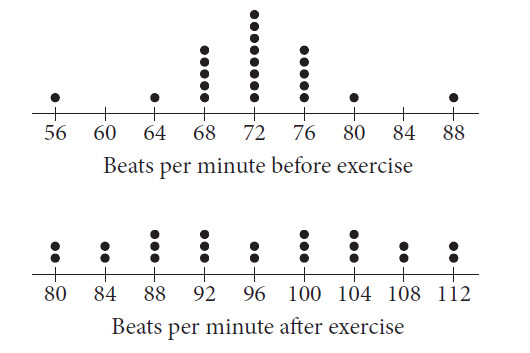
The 22 students in a health class conducted an experiment in which they each recorded their pulse rates, in beats per minute, before and after completing a light exercise routine. The dot plots below display the results.

Let s1 and r1 be the standard deviation and range, respectively, of the data before exercise, and let s2 and r2 be the standard deviation and range, respectively, of the data after exercise. Which of the following is true?
s1=s2 and r1=r2
s1<s2 and r1<r2
s1>s2 and r1>r2
s1≠s2 and r1=r2
The correct Answer is:D
The two data sets have the same range. The first data set has a range of 88 − 56 = 32, and the second data set has a range of 112 − 80 = 32. Alternatively, it can be seen visually that the ranges are the same because the two dot plots are aligned, the scales of the graphs are the same, and the graphs have the same width. The two data sets have different standard deviations. Both dot plots show distributions that have a mean near the center value of the dot plot. The first dot plot shows most values clustered near the mean, while the second dot plot shows most values farther from the mean. Therefore, the standard deviations of the two data sets are not equal—the data represented by the second dot plot has a greater standard deviation.
Choices A, B, and C are incorrect because they incorrectly assert either that the standard deviations are the same or that the ranges are different.
Similar Questions
Find the area of the figure given below.

View SolutionThe area of the shaded part in the figure given below is ______.

View SolutionThe inequation represented by the graph given below is :
View SolutionThe inequation that best describes the graph given below is _________
View SolutionThe inequation that best describes the following graph is _________
View SolutionWhich inequations represent the shaded region in the given figure
View SolutionFind the magnitude of the resultant of shown forces :-
ltimg src="https://d10lpgp6xz60nq.cloudfront.net/physics_images/ALN_PHY_R02_E02_009_Q01.png" width="80%"gt
View SolutionIn the chemical reactions,
ltimg src="https://d10lpgp6xz60nq.cloudfront.net/physics_images/JM_10_CHE_P1_E01_009_S01.png" width="80%"gt
the compounds 'A' and 'B' respectively are
View Solution
