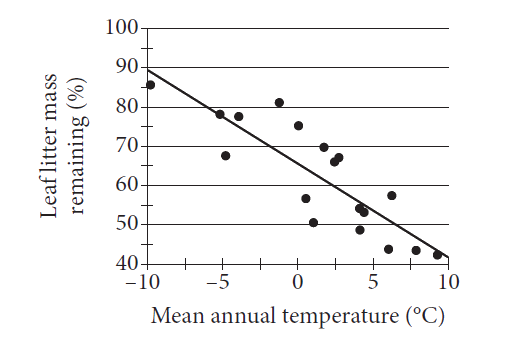
The figure below shows the relationship between the percent of leaf litter mass remaining after decomposing for 3 years and the mean annual temperature, in degrees Celsius , in 18 forests in Canada. A line of best fit is also shown.

A particular forest in Canada, whose data is not included in the figure, had a mean annual temperature of . Based on the line of best fit, which of the following is closest to the predicted percent of leaf litter mass remaining in this particular forest after decomposing for 3 years?
A
B
C
D
Video Solution
Text Solution
The correct Answer is:C
Based on the line of best fit shown, the predicted percent of leaf litter mass remaining for a forest with a mean annual temperature of is about 70%. Choice A is incorrect, it is the predicted percent of leaf litter mass remaining at about . Choice B is incorrect, it is the predicted percent of leaf litter mass remaining at instead of at . Choice D is incorrect, it is the predicted percent of leaf litter mass remaining at about .
|
Similar Questions
Find the area of the figure given below.

View SolutionThe area of the shaded part in the figure given below is ______.

View SolutionThe inequation represented by the graph given below is :
View SolutionThe inequation that best describes the graph given below is _________
View SolutionThe inequation that best describes the following graph is _________
View SolutionWhich inequations represent the shaded region in the given figure
View SolutionThe equation of straight line shown in figure is :
ltimg src="https://d10lpgp6xz60nq.cloudfront.net/physics_images/ALN_PHY_R04_E01_020_Q01.png" width="80%"gt
View SolutionWhat is the distance OA for the square shown in figure :- ltimg src="https://d10lpgp6xz60nq.cloudfront.net/physics_images/ALN_PHY_R05_E01_015_Q01.png" width="80%"gt
View Solution