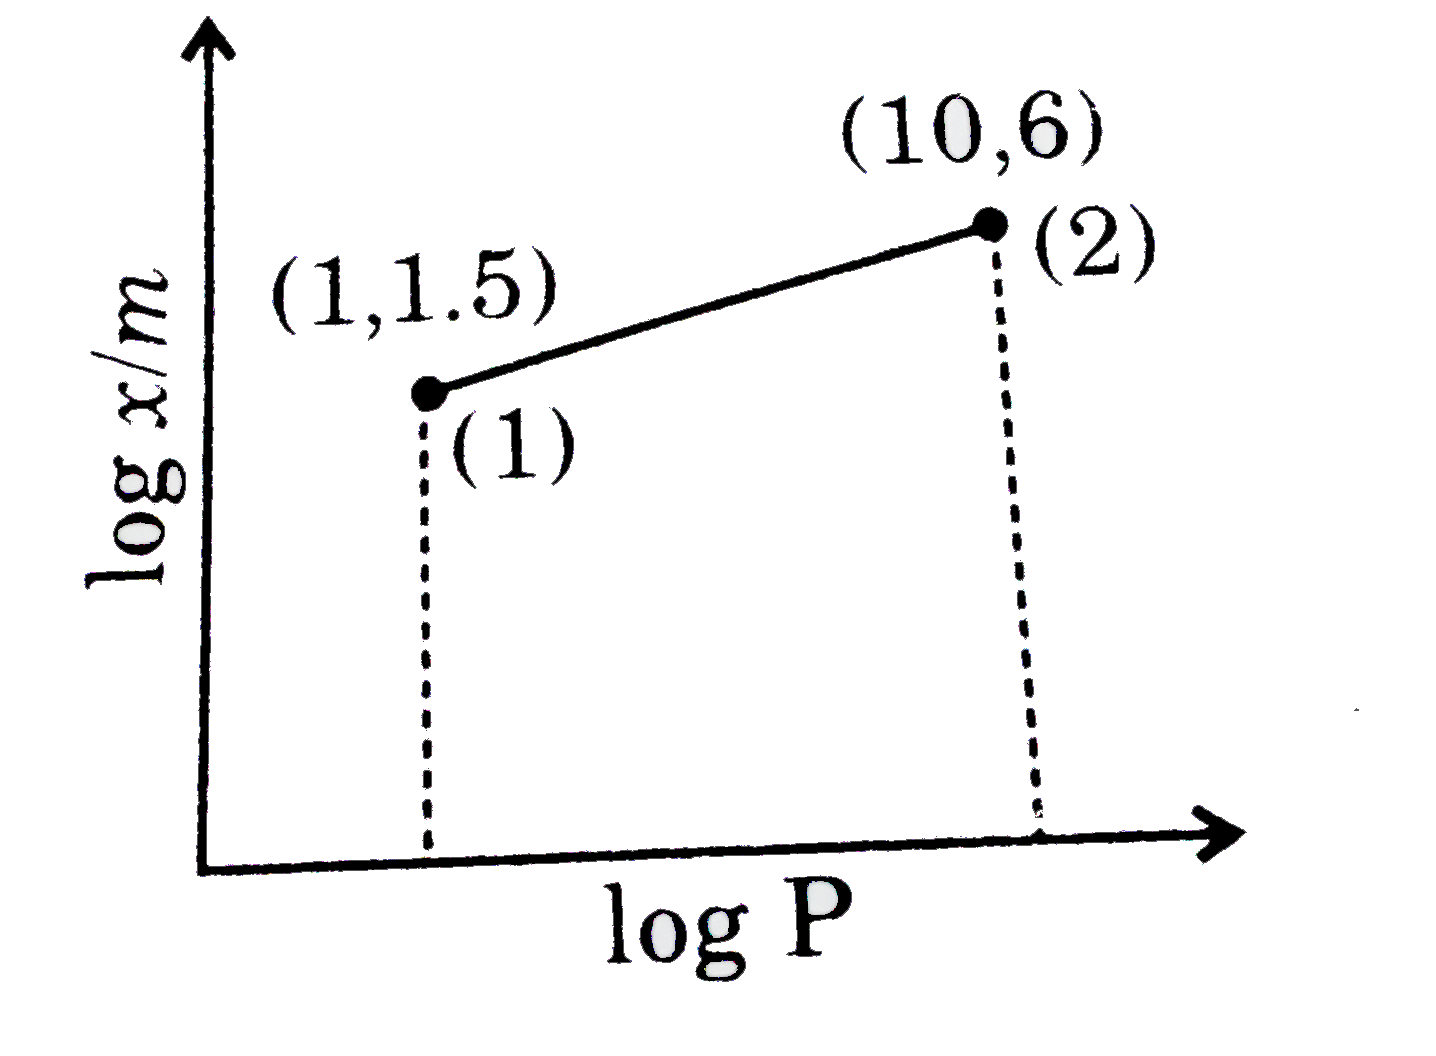
For adsorption of gas over solid surface following data is obtained at 300 K.
Pressure of gas (mm of Hg)10025Amount adsorbed per Kg of charcoal3gm1.5gm
The slope of the graph between log P us log x/m will be:
[x/m and P are in same units as given in question.]
The correct Answer is:2
Step by step video, text & image solution for For adsorption of gas over solid surface following data is obtained at 300 K. {:("Pressure of gas (mm of Hg)",100,25),("Amount adsorbed per Kg of charcoal",3gm,1.5gm):} The slope of the graph between log P us log x//m will be: [x//m and P are in same units as given in question.] by Chemistry experts to help you in doubts & scoring excellent marks in Class 12 exams.
Updated on:21/07/2023Topper's Solved these Questions
- GRAPHICAL INTERPRETATIONBOOK - GRB PUBLICATIONCHAPTER - GRAPHICAL INTERPRETATIONEXERCISE - Match The Column Type
15 Videos
- F-BLOCK ELEMENTSBOOK - GRB PUBLICATIONCHAPTER - F-BLOCK ELEMENTSEXERCISE - Subjective type
7 Videos
- HYDROCARBON (ALIPHATIC)BOOK - GRB PUBLICATIONCHAPTER - HYDROCARBON (ALIPHATIC)EXERCISE - Previous years jee questions
28 Videos
Similar Questions
For adsorption of a gas on solid surface, following isotherm was obtained. Where P is pressure of gas in atm, x represents amount of gas adsorbed and m represents mass of adsorbent, calculate the value of xm of the gas at same temperature and at a pressure of 81 atm.

View SolutionFor the adsorption of a gas on a solid, the plot of log(x/m) versus log p is linear with slope equal to
View Solution
Knowledge Check
For adsorption of gas on solid surface. The plots of logx/m versus log P is linear with a slope equal to
AKBlogKClogCD1n(n being Integer)For the adsorption of a gas on a solid, the plot of log (x/m) against log P will have a intercept of
AhBlog KCnD1/nFor the adsorption of a gas on a solid, the plot of log(x/m) versus log P is linear with slope equal to:
AkBlogkCnD1/n
For adsorption of a gas on a solid, the plot of log x/m vs log P is linear with slope equal to: (n being whole number )
View SolutionFor adsorption of a gas on a solid, the plot of log (x/m) vs log P is linear with a slope equal to [n being a whole number]:
View SolutionFor adsorption of a gas on a solid, the plot of log (x/m) vs log P is linear with a slope equal to [n being a whole number]:
View SolutionFor adsorption of a gas on a solid, the plot of log (x/m) vs log P is linear with a slope equal to [n being a whole number]:
View SolutionFor adsorption of a gas on a solid, the plot of log (x/m) Vs log P is linear with a slope equal to :
[n being a whole number]
View Solution
