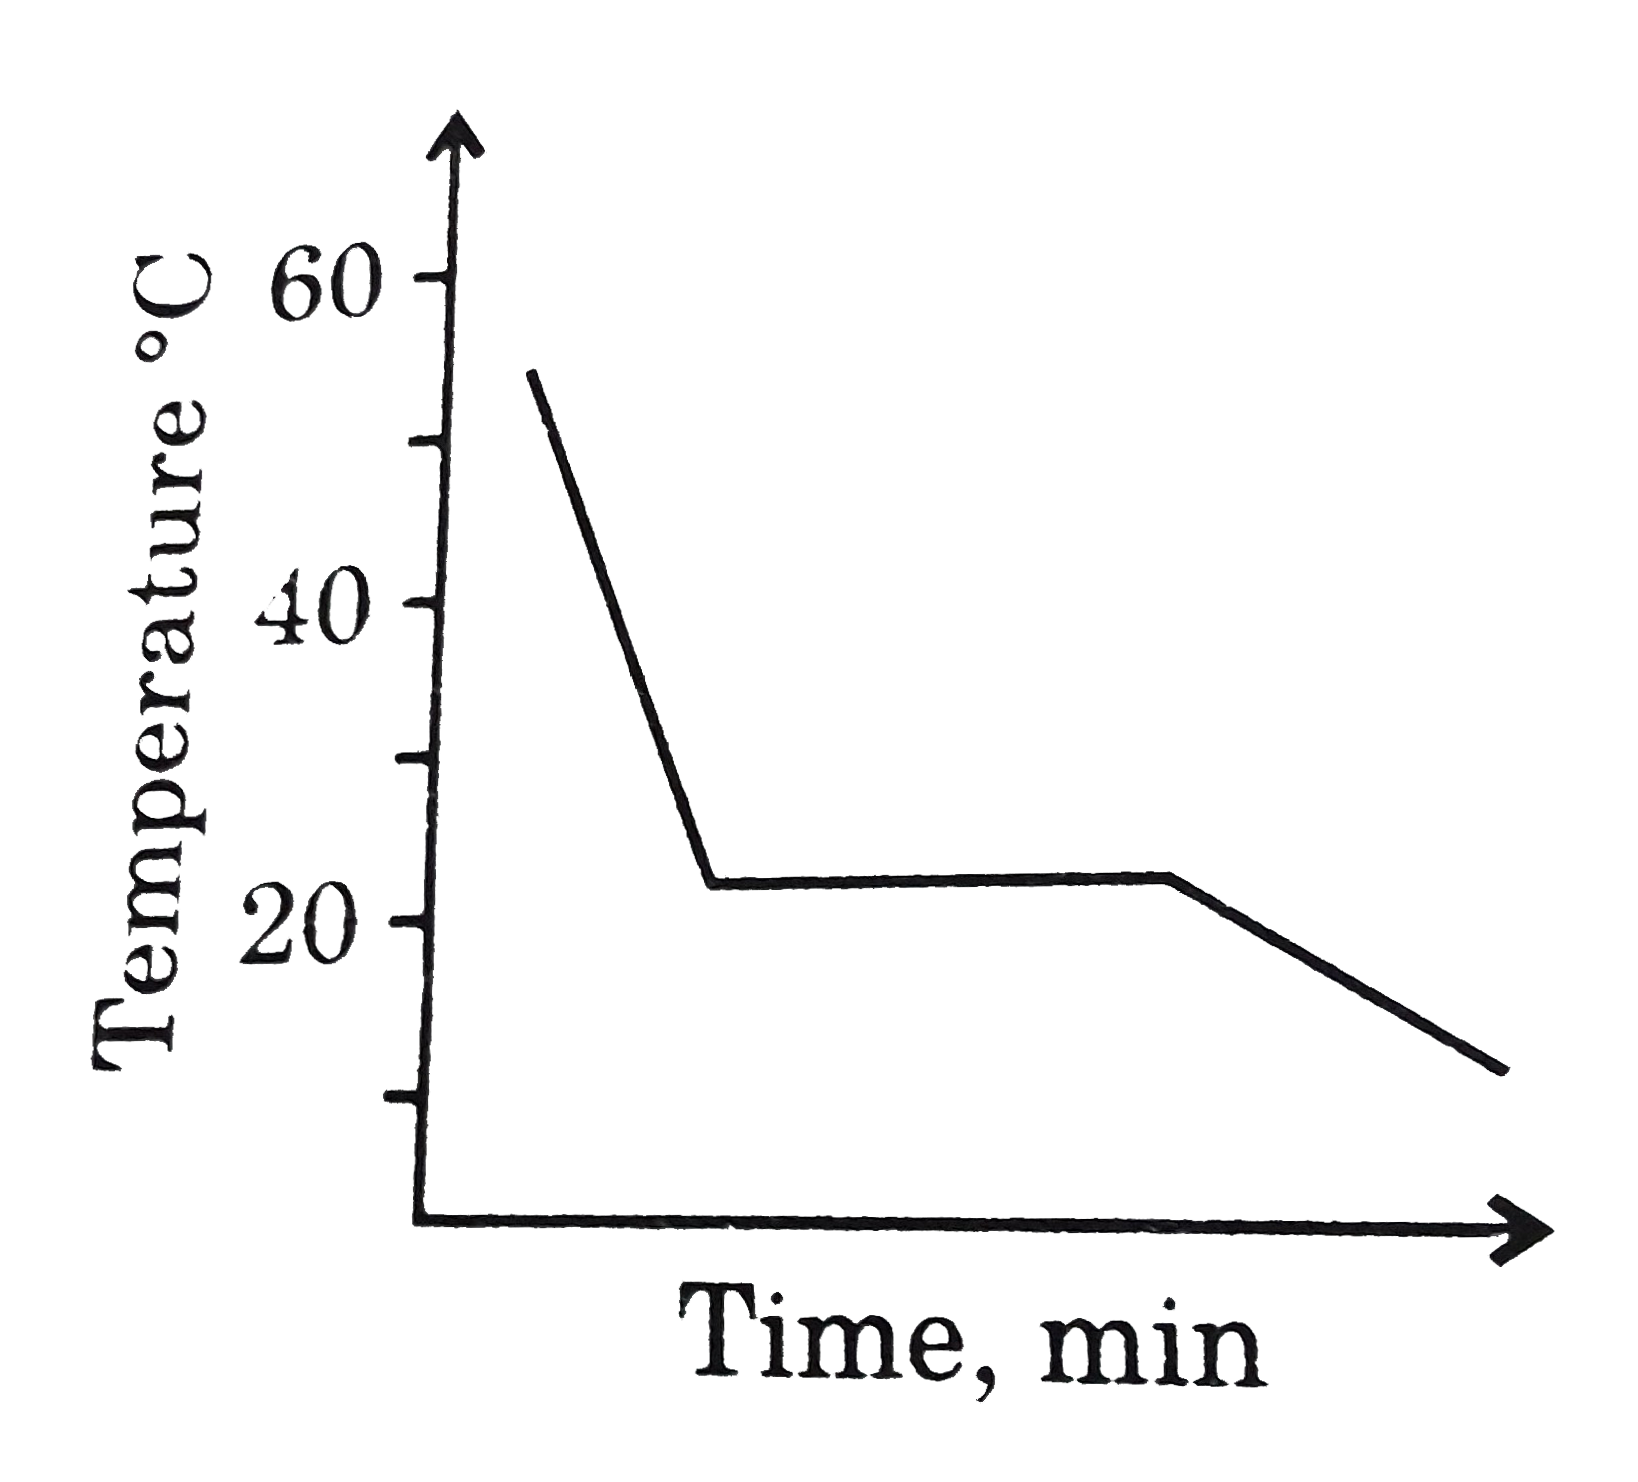
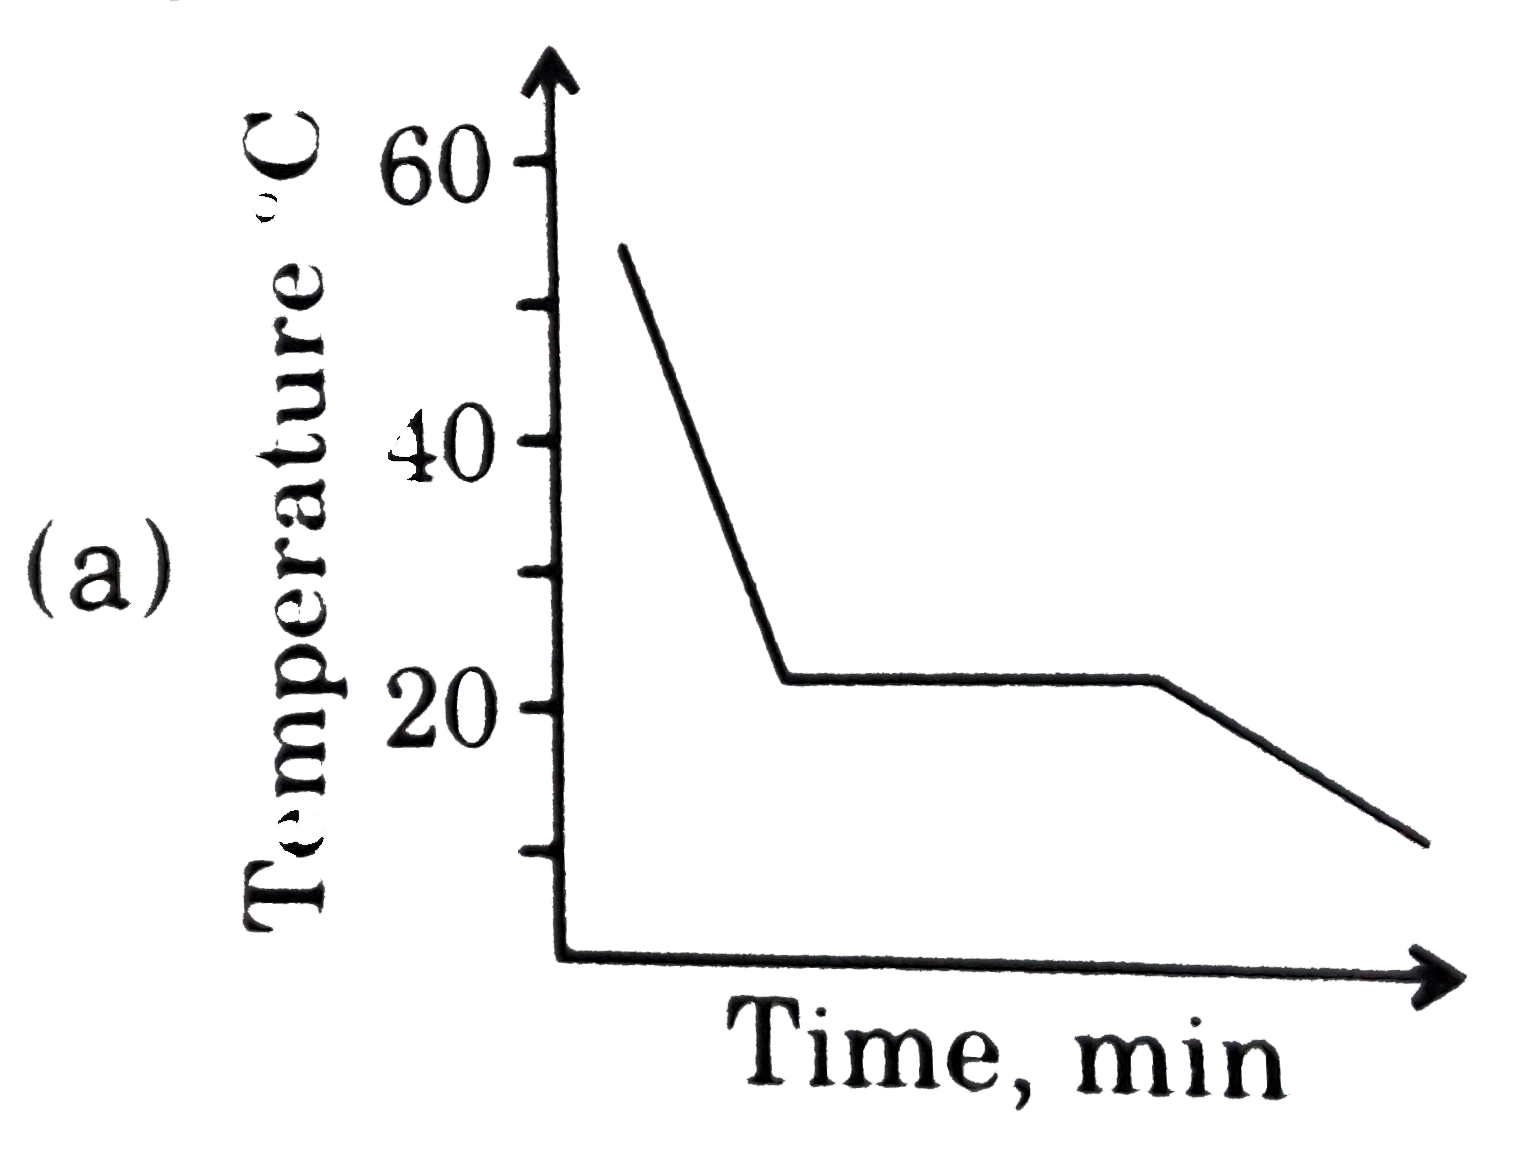
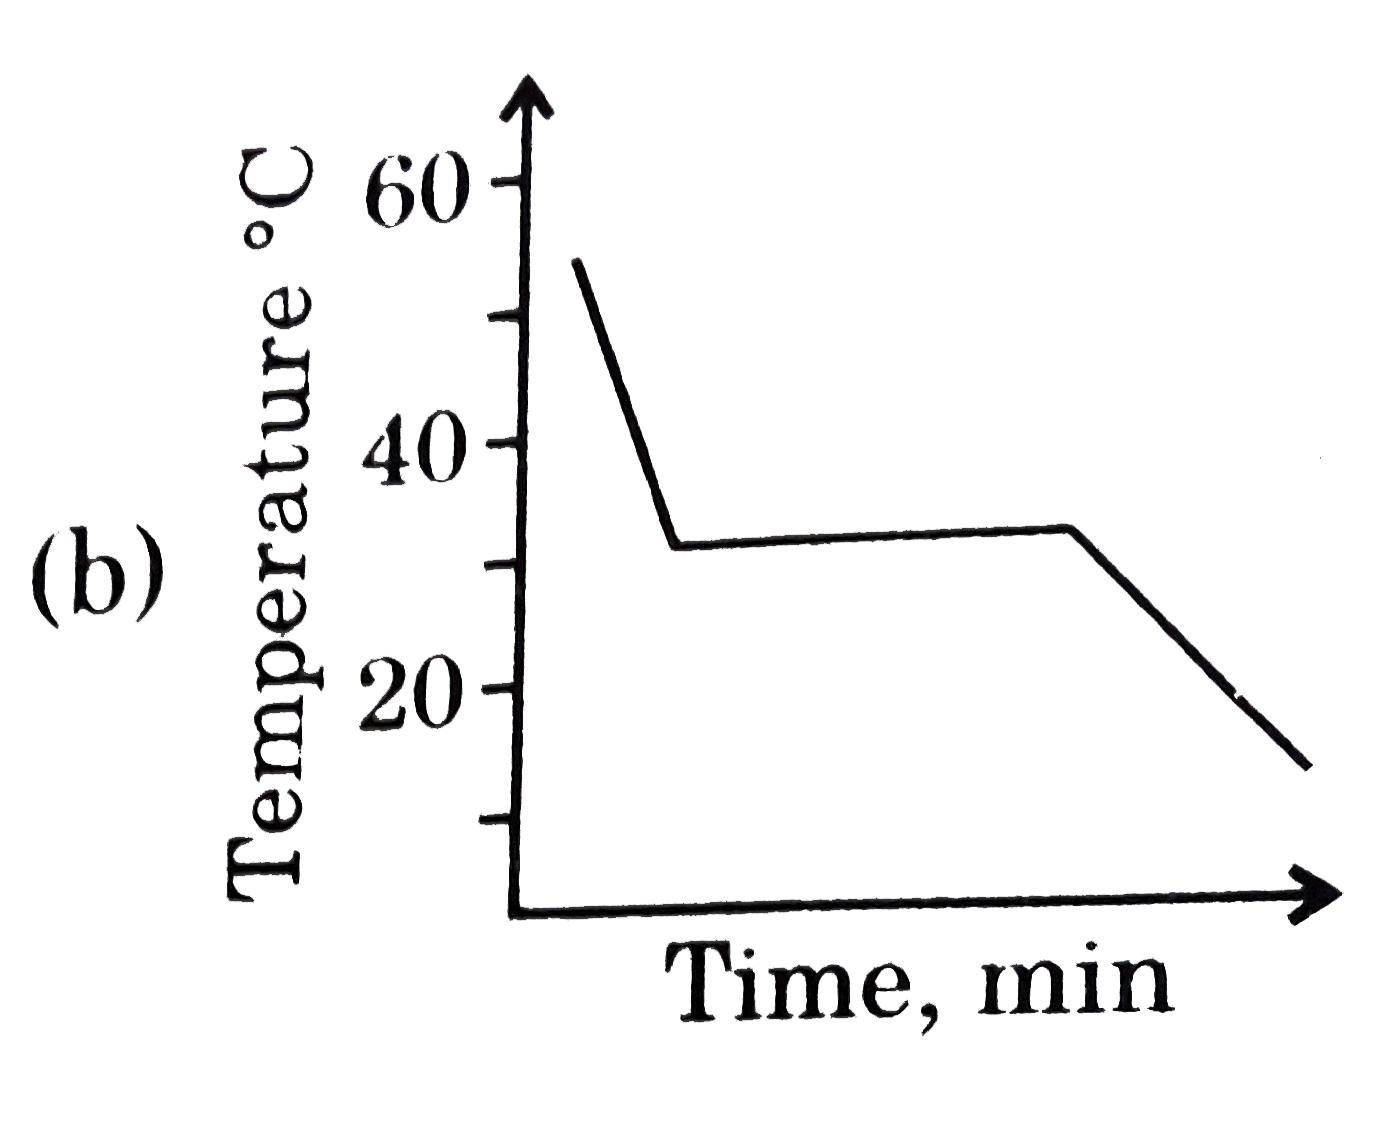
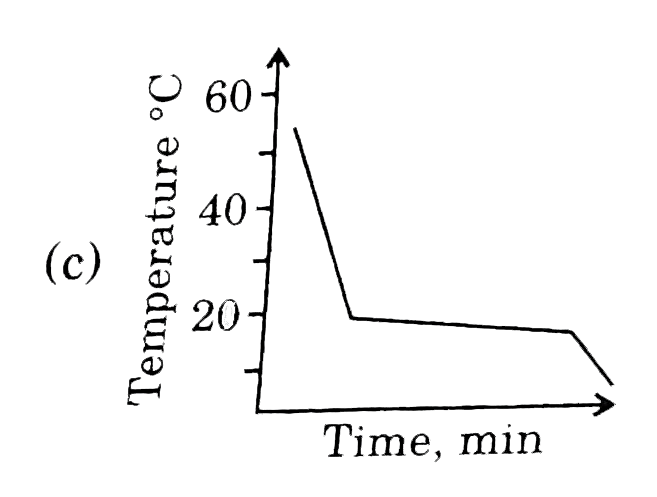
This diagram represents the behaviour of a pure solvent upon cooling. Which of the diagrams below best represents the cooling curve of a solution in that solvent upon cooling ? (Assume that all diagrams are drawn to the same scale.)
A
B
C
D
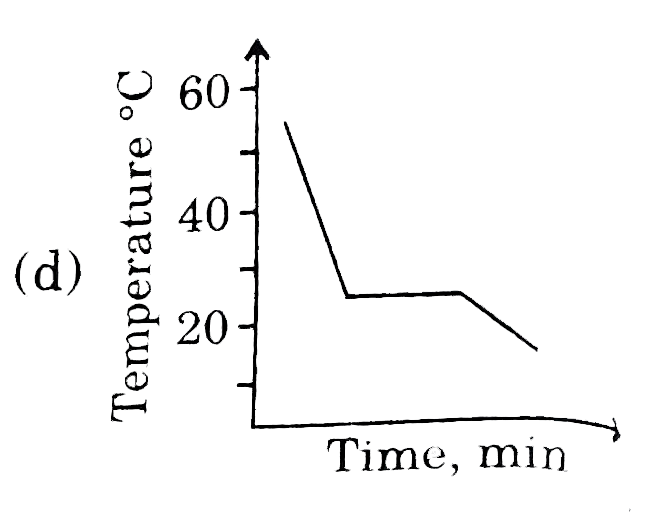
Text Solution
The correct Answer is:C
|
Topper's Solved these Questions
- GRAPHICAL INTERPRETATIONBook:GRB PUBLICATIONChapter:GRAPHICAL INTERPRETATIONExercise:E. Surface Chemistry
Explore 1 Video
- GRAPHICAL INTERPRETATIONBook:GRB PUBLICATIONChapter:GRAPHICAL INTERPRETATIONExercise:Surface Chemistry
Explore 4 Videos
- GRAPHICAL INTERPRETATIONBook:GRB PUBLICATIONChapter:GRAPHICAL INTERPRETATIONExercise:D. Liquid Solutions
Explore 1 Video
- F-BLOCK ELEMENTSBook:GRB PUBLICATIONChapter:F-BLOCK ELEMENTSExercise:Subjective type
Explore 7 Videos
- HYDROCARBON (ALIPHATIC)Book:GRB PUBLICATIONChapter:HYDROCARBON (ALIPHATIC)Exercise:Previous years jee questions
Explore 28 Videos
Similar Questions
Knowledge Check
Which energy diagram best represents the given reaction ?
 A
A B
B C
C D
D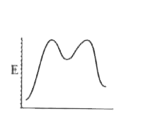
Which of the following p-V diagrams best represents an isothermal process ?
A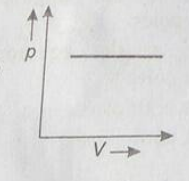 B
B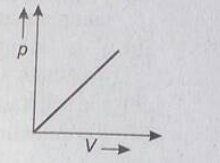 C
C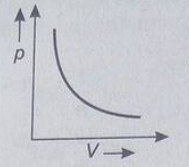 D
D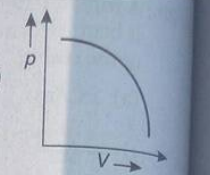
Which of the following p-V diagrams best represents an isothermal process ?
A B
B C
C D
D
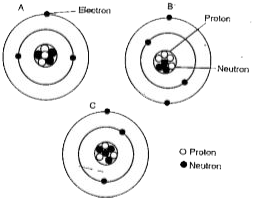
Which diagram represents,isotopes of the same element?
View SolutionWhich of the following P−V diagrams best represents an isothermal process?
View SolutionWhich of the shaded area in the diagrams below represent total utility ?
View SolutionWhich of the shaded area in the diagrams below represent total utility ?
View SolutionWhich of the shaded area in the diagrams below represent total utility ?
View Solution


