Which graph correctly correlates Ecell as a function of concentration for the cell
Zn(s)+2Ag+(aq)→Zn2+(aq)+2Ag(s),E∘cell=1.56V
y-axis: Ecell, X-axis: log10[Zn2+][Ag+]2
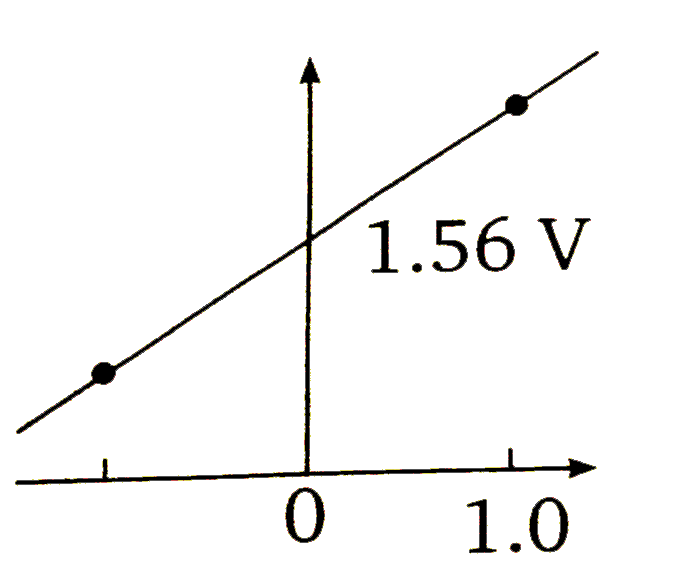
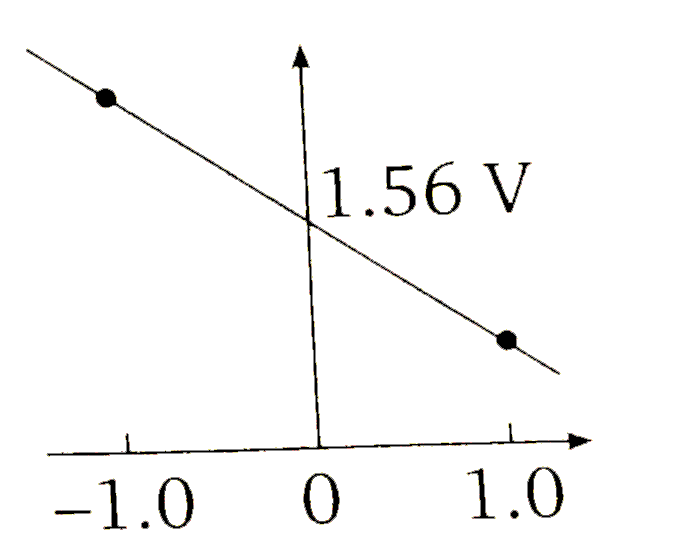
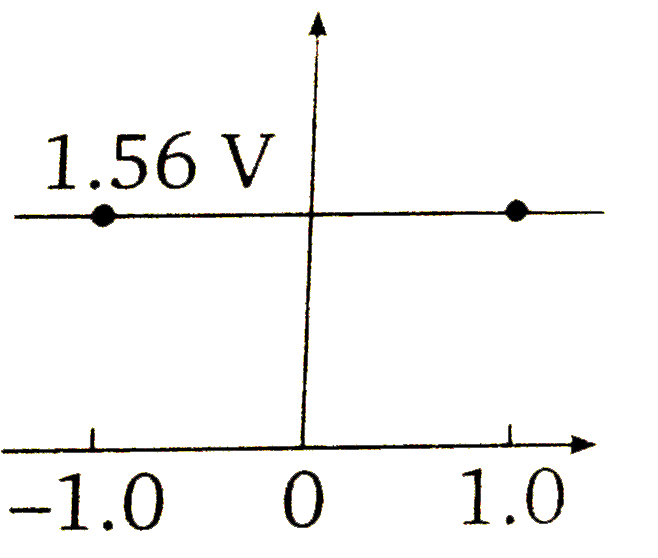

The correct Answer is:B
To solve the problem, we need to analyze the electrochemical cell reaction and how the cell potential Ecell varies with the concentrations of the reactants and products. The cell reaction given is:
Zn(s)+2Ag+(aq)→Zn2+(aq)+2Ag(s)
Step 1: Write the Nernst Equation
The Nernst equation relates the cell potential Ecell to the standard cell potential E∘cell and the concentrations of the reactants and products. The equation is given by:
Ecell=E∘cell−RTnFlnQ
Where:
- E∘cell is the standard cell potential (1.56 V in this case).
- R is the universal gas constant (8.314 J/(mol·K)).
- T is the temperature in Kelvin (assume 298 K if not specified).
- n is the number of moles of electrons transferred (2 for this reaction).
- F is Faraday's constant (96485 C/mol).
- Q is the reaction quotient.
Step 2: Determine the Reaction Quotient Q
For the given reaction, the reaction quotient Q is defined as:
Q=(Zn2+)(Ag+)2
Step 3: Substitute Q into the Nernst Equation
Substituting Q into the Nernst equation, we get:
Ecell=E∘cell−RTnFln((Zn2+)(Ag+)2)
Step 4: Convert the Natural Logarithm to Logarithm Base 10
To express the equation in terms of logarithm base 10, we use the conversion:
lnx=2.303log10x
Thus, the equation becomes:
Ecell=E∘cell−2.303RTnFlog10((Zn2+)(Ag+)2)
Step 5: Rearranging the Equation
Rearranging the equation gives us:
Ecell=E∘cell−2.303RTnFlog10(Zn2+)+2⋅2.303RTnFlog10(Ag+)
Step 6: Identify the Slope and Intercept
From the rearranged equation, we can identify:
- The y-intercept is E∘cell=1.56V.
- The slope is negative because of the negative sign in front of the concentration terms.
Step 7: Conclusion about the Graph
The graph of Ecell vs. log10((Zn2+)(Ag+)2) will have:
- A negative slope.
- A y-intercept at 1.56V.
Thus, the correct graph will show a downward trend starting from 1.56V on the y-axis.
The Nernst equation relates the cell potential Ecell to the standard cell potential E∘cell and the concentrations of the reactants and products. The equation is given by:
- E∘cell is the standard cell potential (1.56 V in this case).
- R is the universal gas constant (8.314 J/(mol·K)).
- T is the temperature in Kelvin (assume 298 K if not specified).
- n is the number of moles of electrons transferred (2 for this reaction).
- F is Faraday's constant (96485 C/mol).
- Q is the reaction quotient.
For the given reaction, the reaction quotient Q is defined as:
Substituting Q into the Nernst equation, we get:
To express the equation in terms of logarithm base 10, we use the conversion:
Rearranging the equation gives us:
From the rearranged equation, we can identify:
- The y-intercept is E∘cell=1.56V.
- The slope is negative because of the negative sign in front of the concentration terms.
The graph of Ecell vs. log10((Zn2+)(Ag+)2) will have:
- A negative slope.
- A y-intercept at 1.56V.
Topper's Solved these Questions
- ELECTROCHEMISTRYBook:NARENDRA AWASTHIChapter:ELECTROCHEMISTRYExercise:Level 1 (Q.1 To Q.30)
Explore 1 Video
- ELECTROCHEMISTRYBook:NARENDRA AWASTHIChapter:ELECTROCHEMISTRYExercise:Level 1 (Q.91 To Q.120)
Explore 1 Video
- DILUTE SOLUTIONBook:NARENDRA AWASTHIChapter:DILUTE SOLUTIONExercise:Level 3 - Match The Column
Explore 1 Video
- GASEOUS STATEBook:NARENDRA AWASTHIChapter:GASEOUS STATEExercise:Level 3 - Subjective Problems
Explore 1 Video
Similar Questions
Knowledge Check
Which graph correctly correlates Ecell as a function of concentration for the cell (for different values of M nad M' Zn(s)+Cu2+(M)→Zn2+(M')+Cu(s),E∘cell=1.10V
X - axis : log10.[Zn2+][Cu2+], Y - axis : EcellA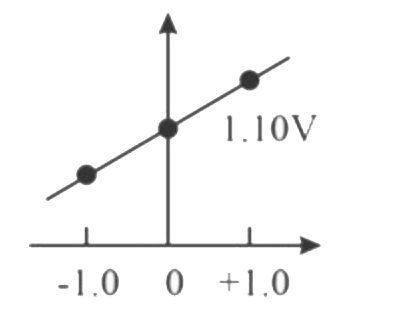 B
B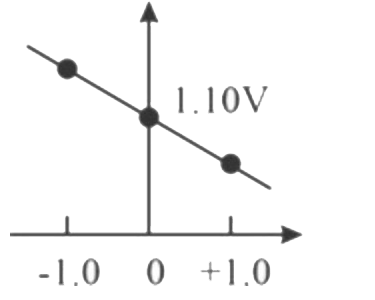 C
C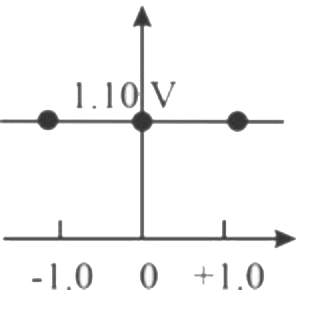 D
D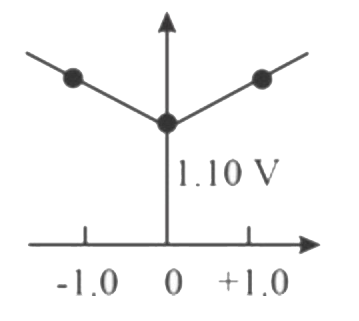
Which graph correctly correlates Ecell as a funcation of concentrations for the cell (for different values of M and M')?
Zn(s)+Cu2+(M)→Zn2+(M')+Cu(s),E∘cell=1.10V
X-axis : log10[Zn2+][Cu2+] Y-axis : EcellA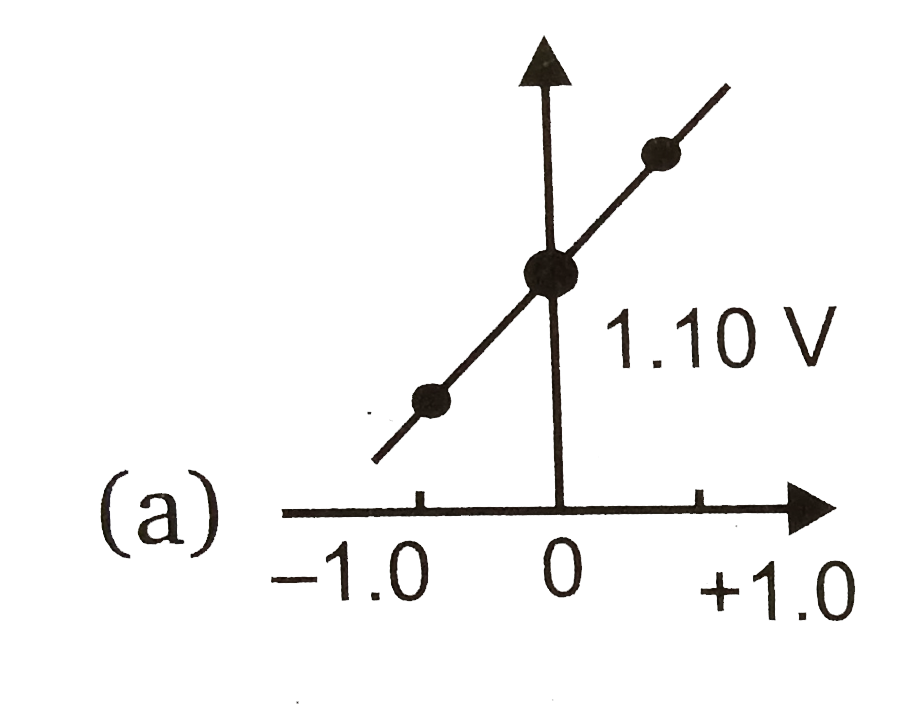 B
B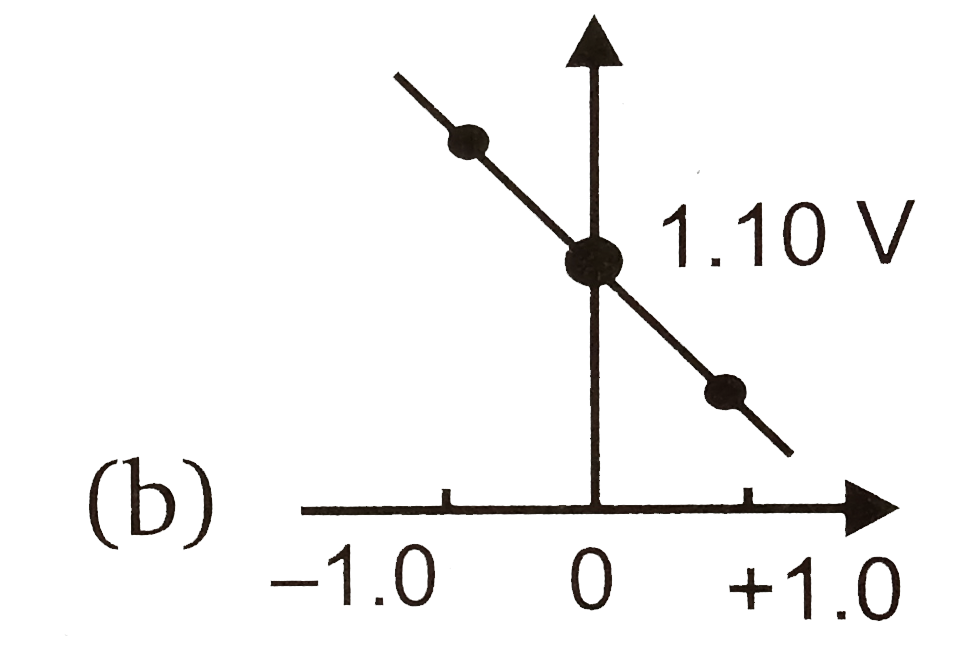 C
C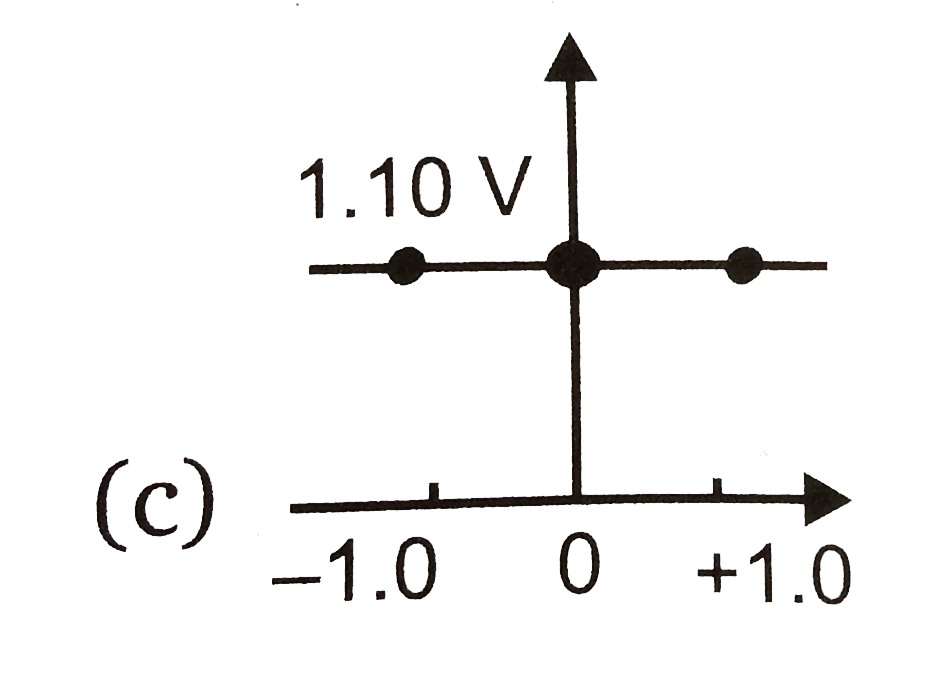 D
D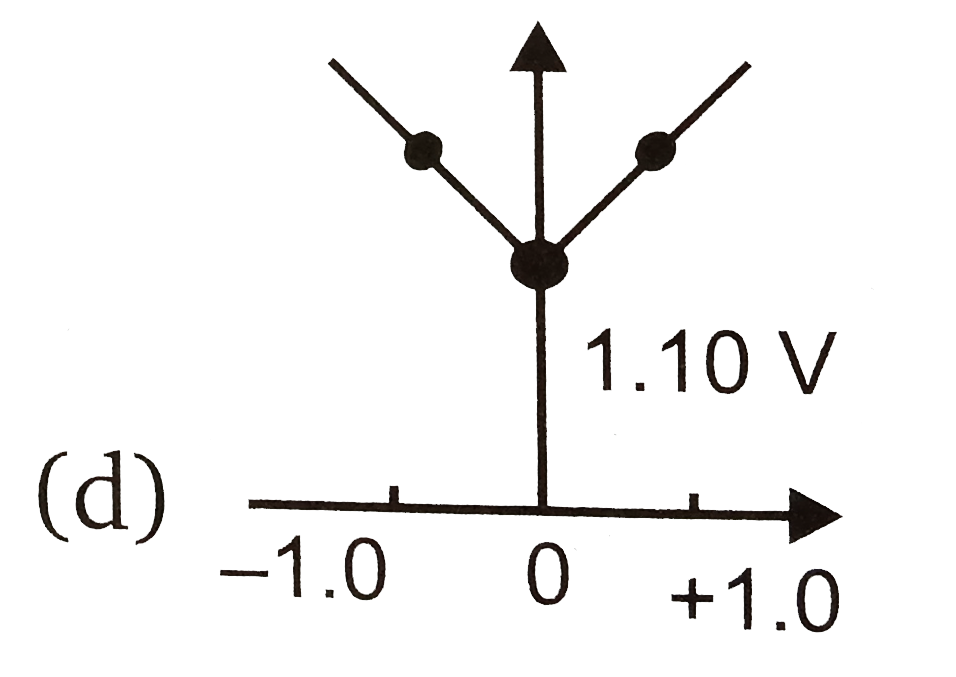
The equilibrium constant of the reaction :
Zn(s)+2Ag+(aq)→Zn(aq)+2Ag(s),E∘=1.50V at 298 K isA2.6×1049B8.7×1051C6.1×1030D6.6×1050
The cell reaction
Zn(s)+2Ag+(aq)→Zn2+(aq)+Ag(s)
is best represented by
View SolutionThe equilibrium constant (K) for the reaction
Cu(s)+2Ag+(aq)→Cu2+(aq)+2Ag(s), will be
[Given, E∘cell=0.46V]
View SolutionWhich will increase the voltage of the cell Sn(s)+2Ag+(aq)→Sn2+(aq)+2Ag(s)
View SolutionSelect the correct cell reaction of the cell Pt(s)|Cl2(g)|Cl−(aq)||Ag+(aq)∣Ag(s):
View SolutionConsider the following cell reaction
Cu(s)+2Ag+(aq)→Cu2+(aq)+2Ag(s)
E∘cell=0.46V By boubling the concentration of Cu2+, Ecell is
View Solution

