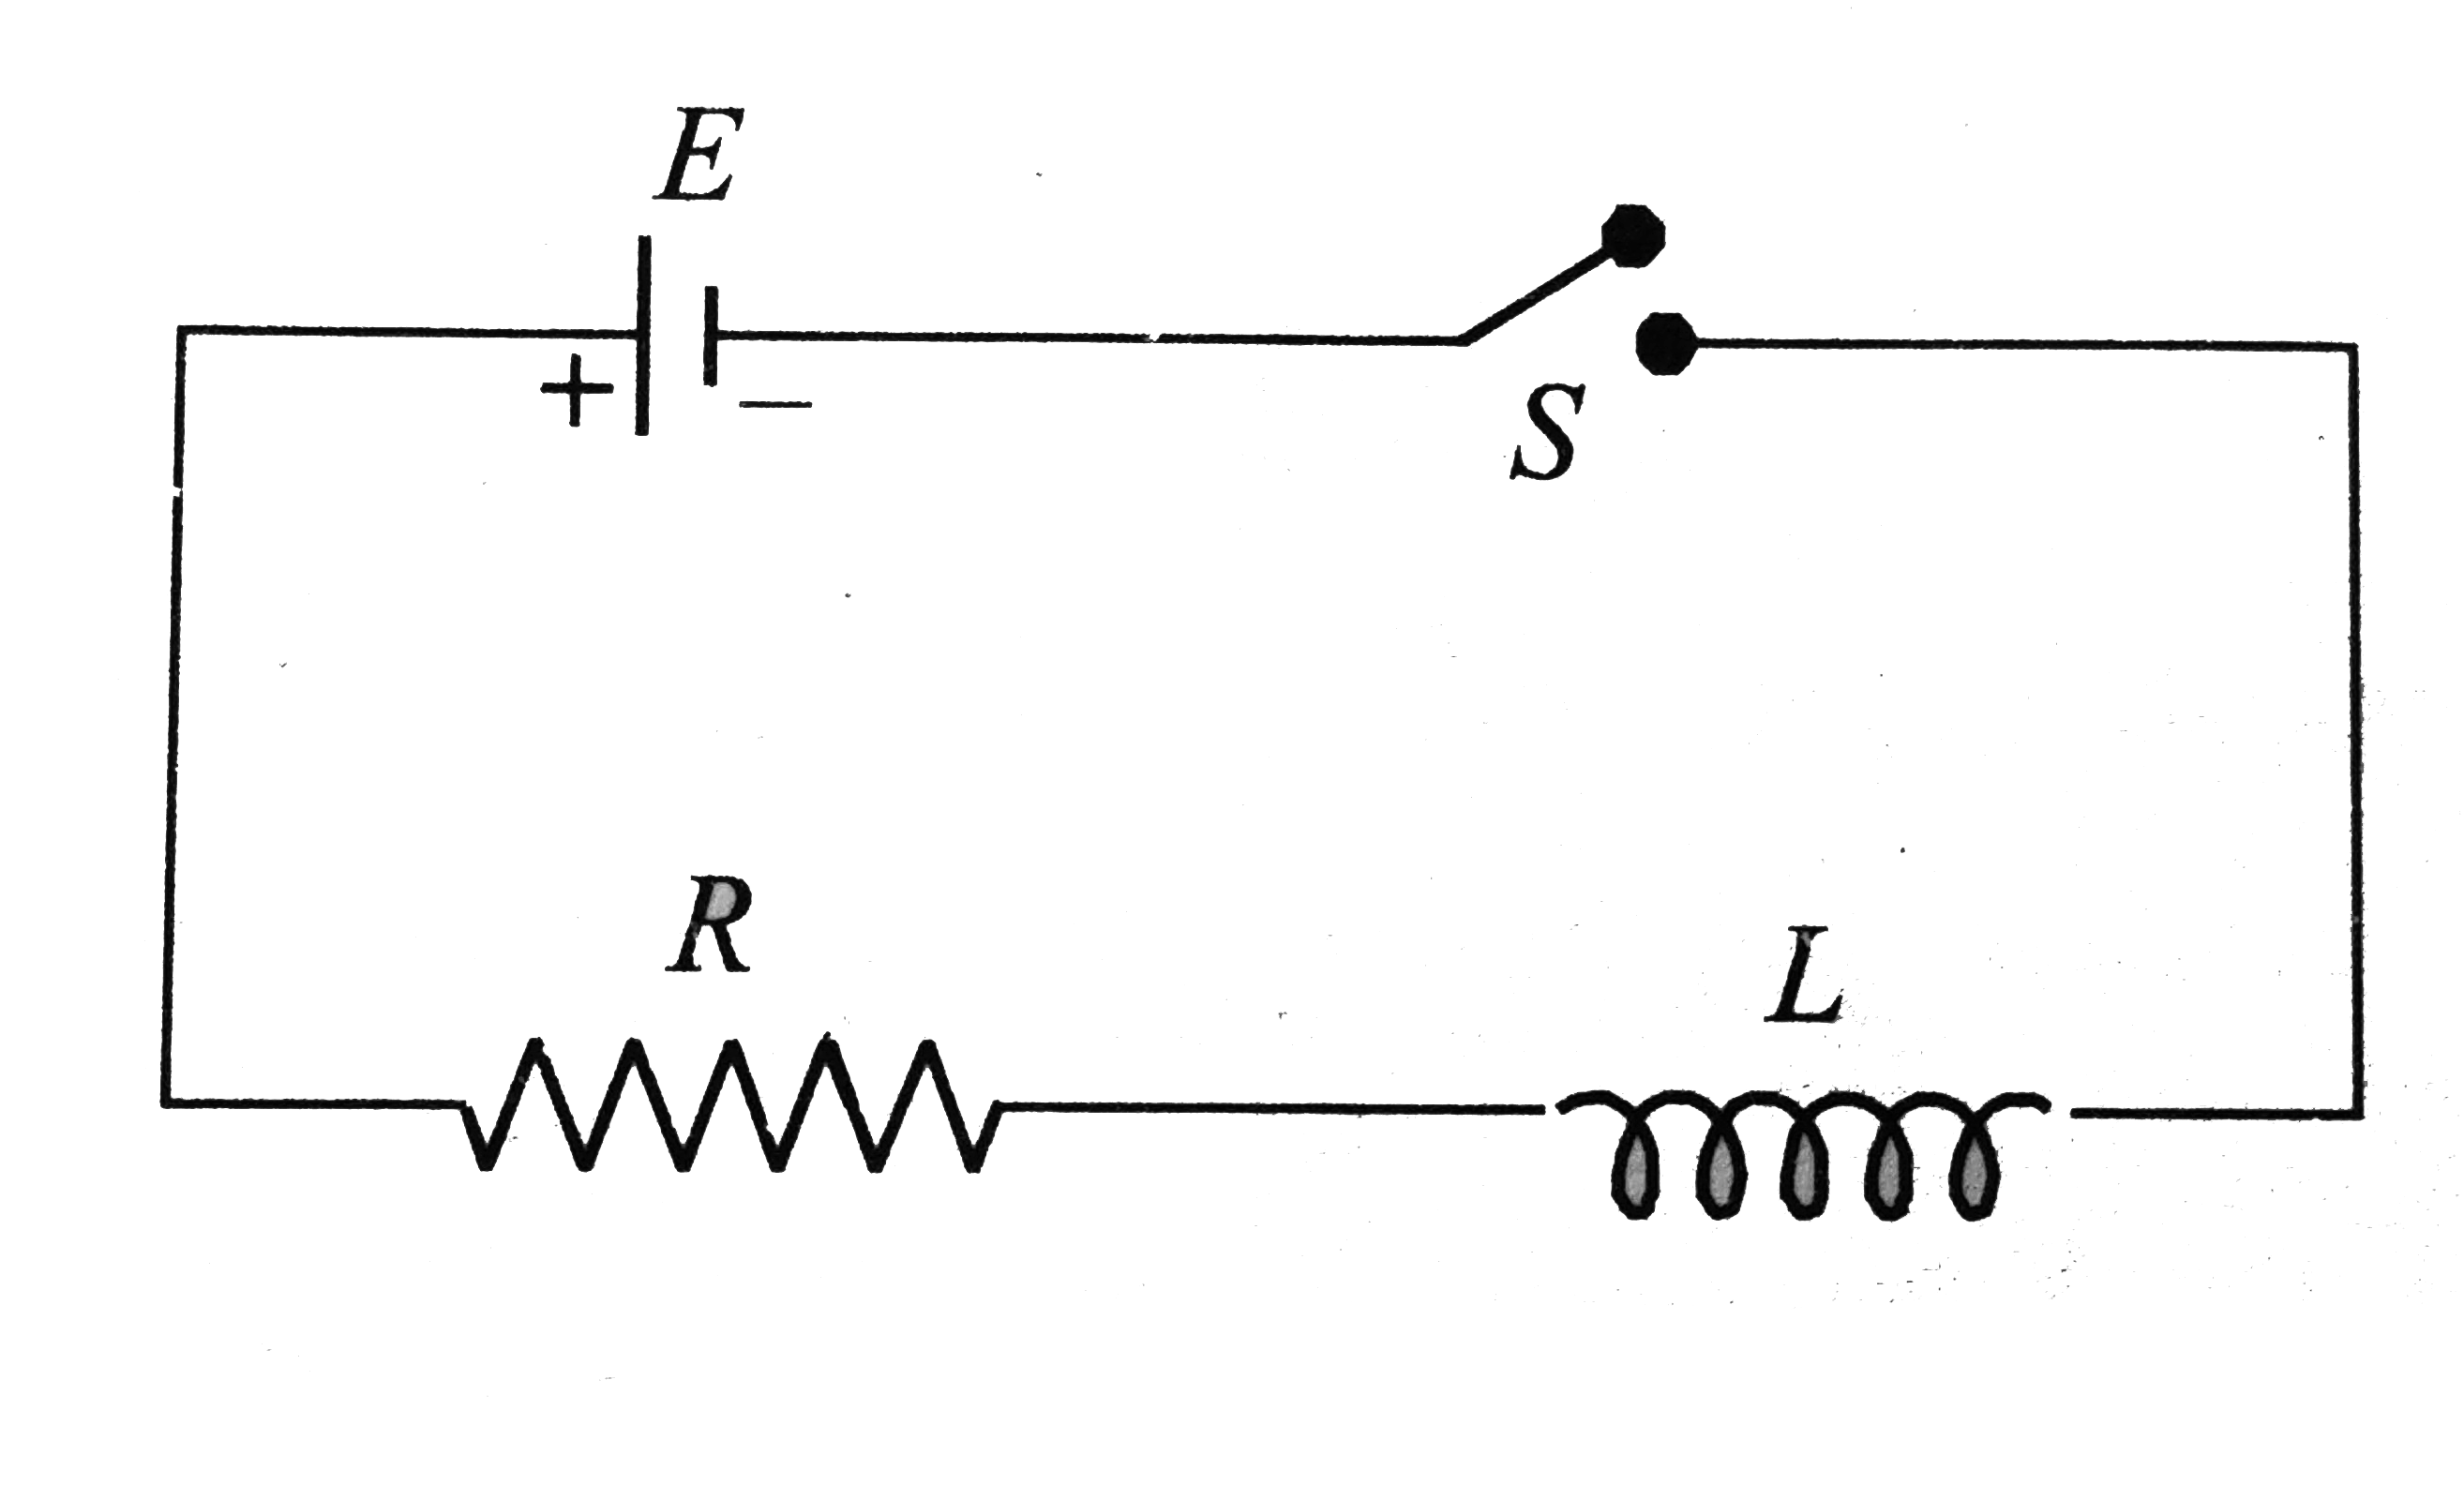
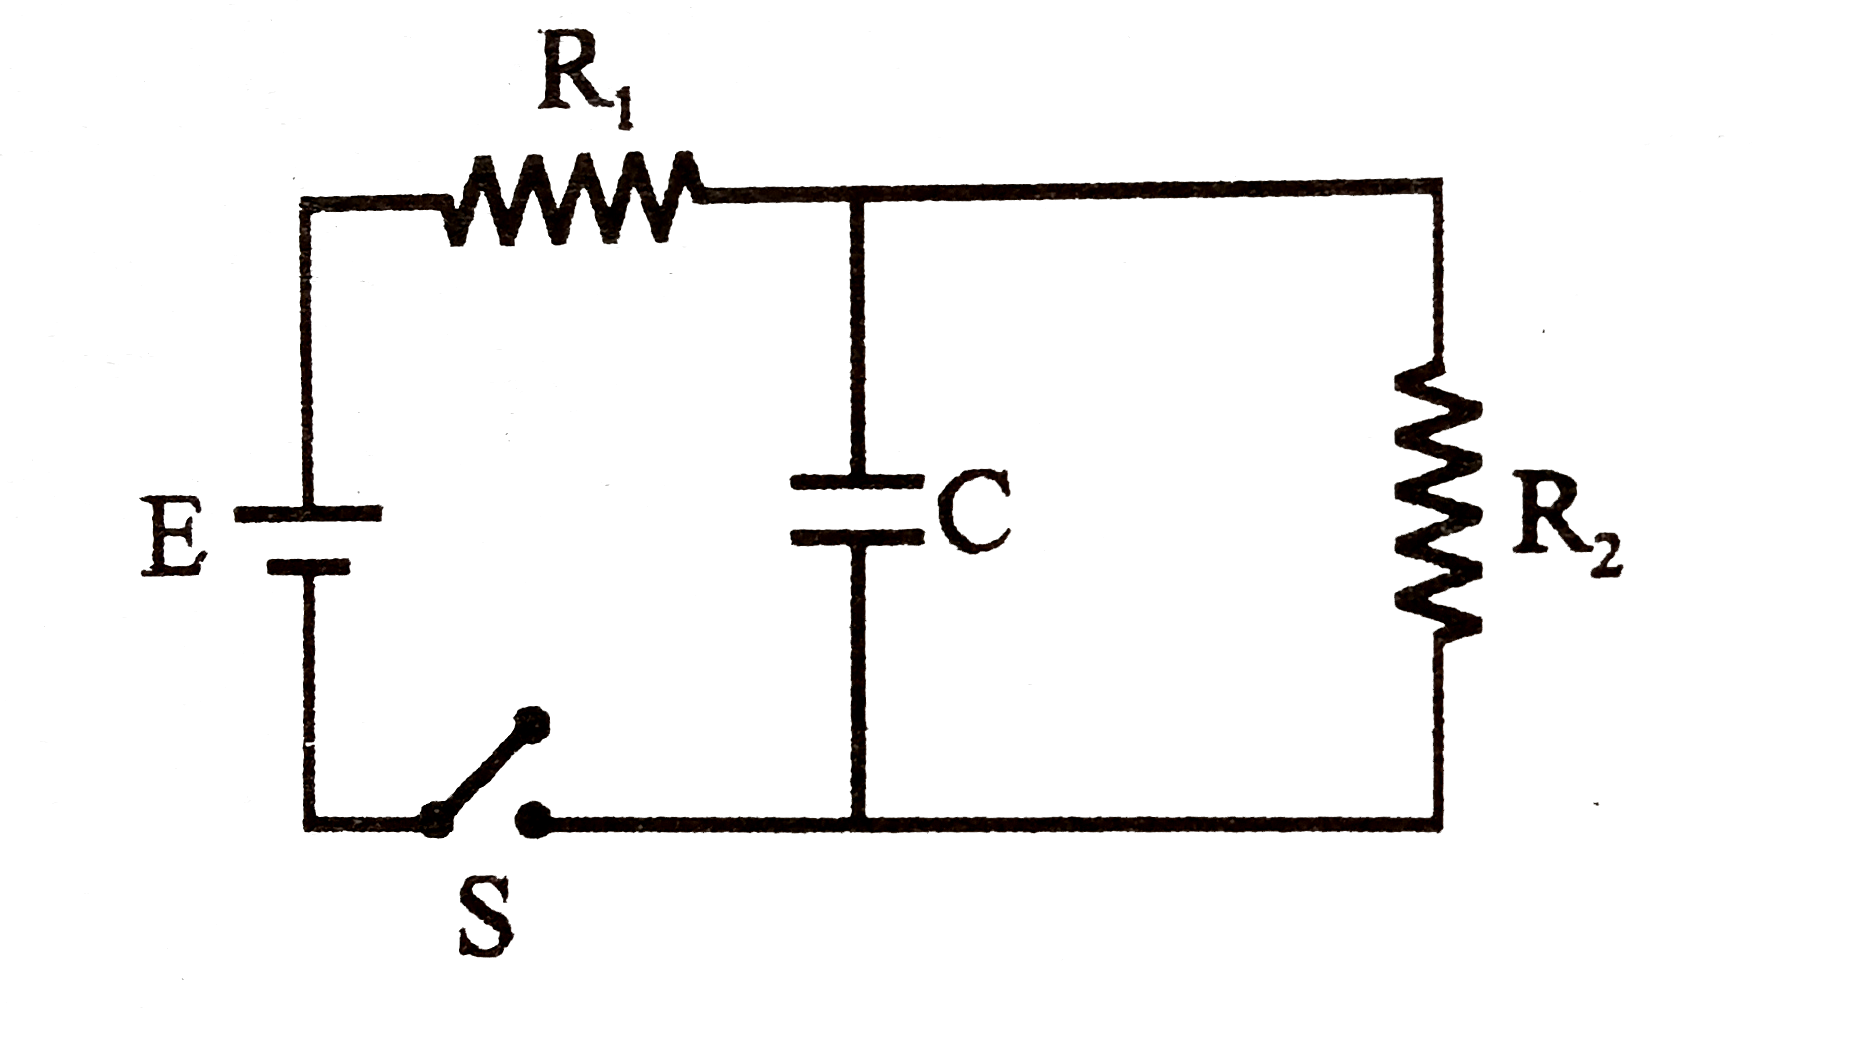
Switch S of the circuit shows in Fig is closed at t=0. If e denotes the induced emf in L and I is the current flowing through the circuit at time t, which of the following graphs is//are correct?


The correct Answer is:C
Step by step video, text & image solution for Switch S of the circuit shows in Fig is closed at t = 0. If e denotes the induced emf in L and I is the current flowing through the circuit at time t, which of the following graphs is//are correct? by Physics experts to help you in doubts & scoring excellent marks in Class 12 exams.
Updated on:21/07/2023Topper's Solved these Questions
- INDUCTANCEBook:CENGAGE PHYSICSChapter:INDUCTANCEExercise:Multiple Correct Answer
Explore 3 Videos
- INDUCTANCEBook:CENGAGE PHYSICSChapter:INDUCTANCEExercise:Comprehension Type
Explore 9 Videos
- INDUCTANCEBook:CENGAGE PHYSICSChapter:INDUCTANCEExercise:Subective Type
Explore 2 Videos
- HEATING EFFECT OF CURRENTBook:CENGAGE PHYSICSChapter:HEATING EFFECT OF CURRENTExercise:Thermal Power in Resistance Connected in Circuit
Explore 28 Videos
- KINETIC THEORYBook:CENGAGE PHYSICSChapter:KINETIC THEORYExercise:Question Bank
Explore 31 Videos
Similar Questions
In an L-R circuit connected to a battery of constant e.m.f. E switch S is closed at time t=0. If e denotes the magnitude of induced e.m.f. across inductor and i the current in the circuite at any time t. Then which of the following graphs shows the variation of e with i?
View SolutionIn an L-R circuit connected to a battery of constant emf E, switched is closed at time t=0. If denotes the induced emf across inductor and I the current in the circuit at any time t. Then which of the following graphs shown the variation of e with i?
View Solution
Knowledge Check
Switch S of the circuit shows in Fig is closed at t=0. If e denotes the induced emf in L and I is the current flowing through the circuit the circuit at time t, which of the following graphs is//are correct?
 A
A B
B C
C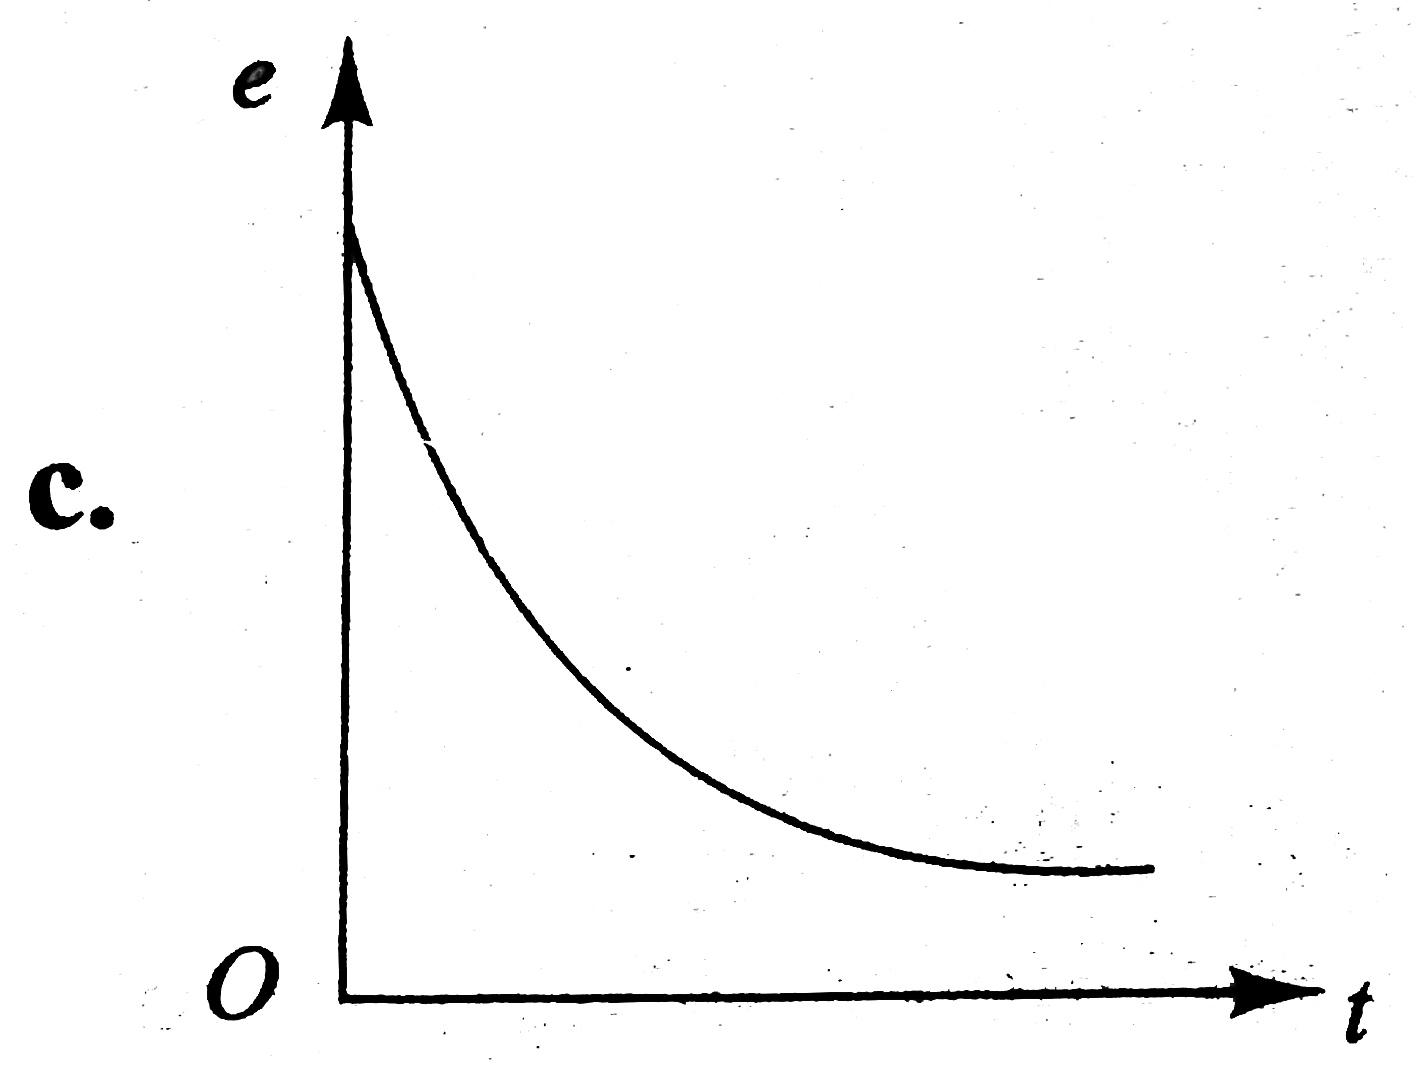 D
D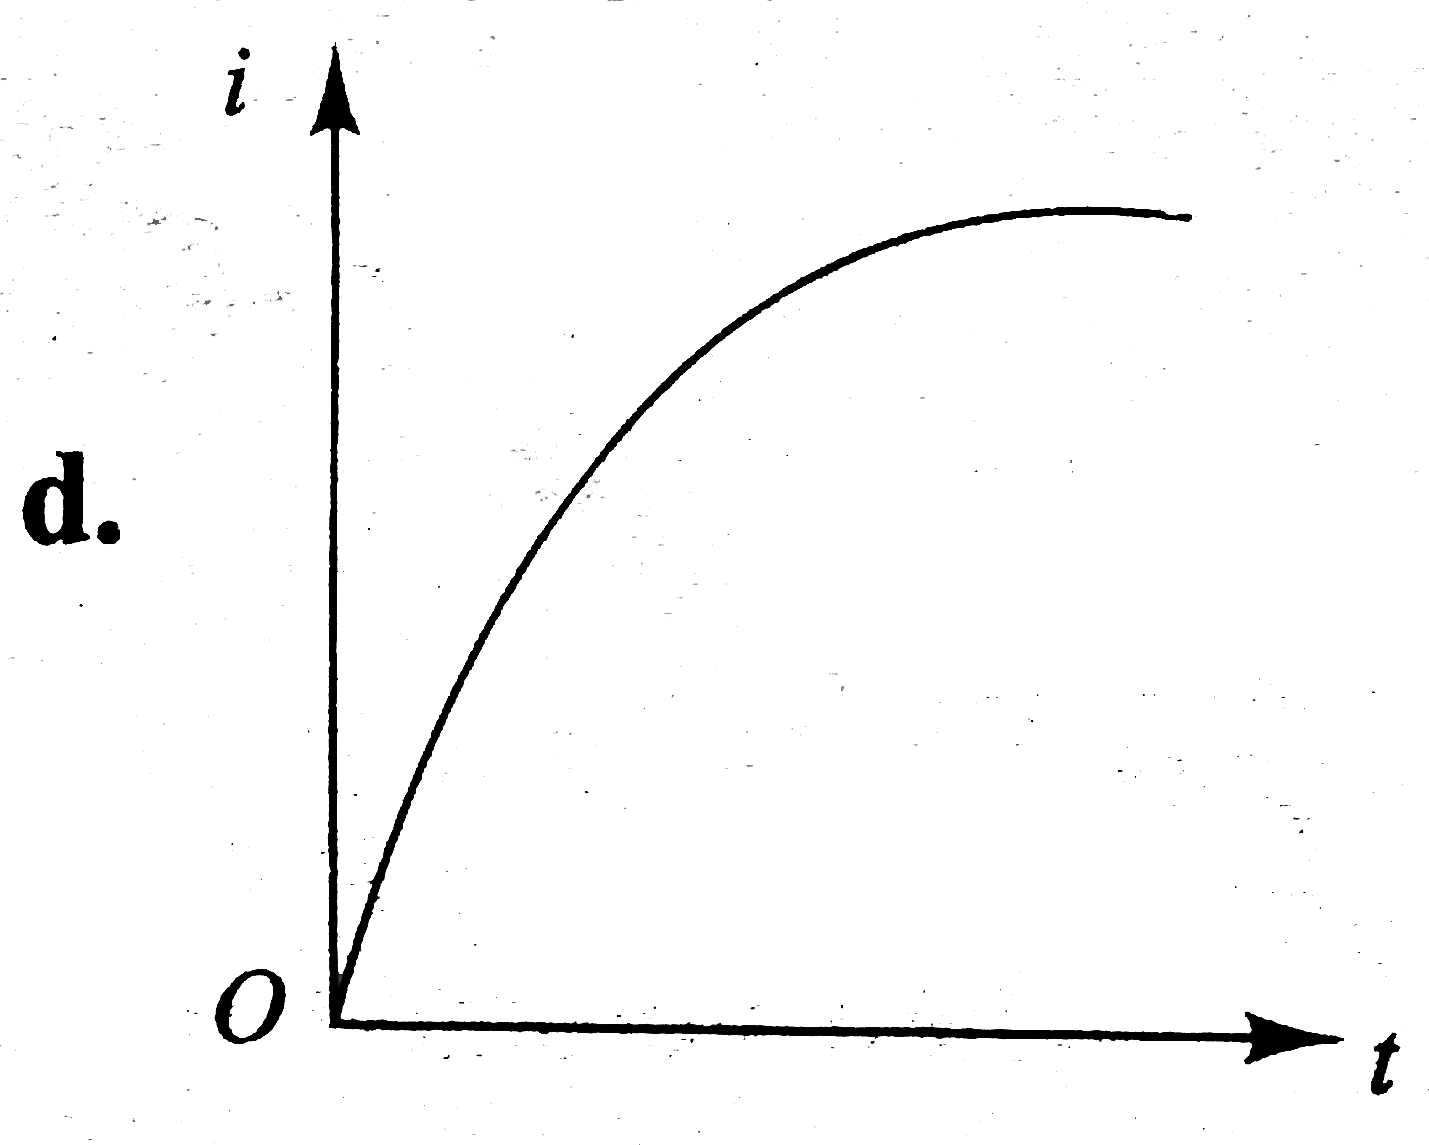
Switch S of the circuit shows in Fig. is closed at t=0. If e denotes the induced emf in L and i the current flowing through the circuit at time t, then which of the following graphs correctly represents the variation of e with i?
 A
A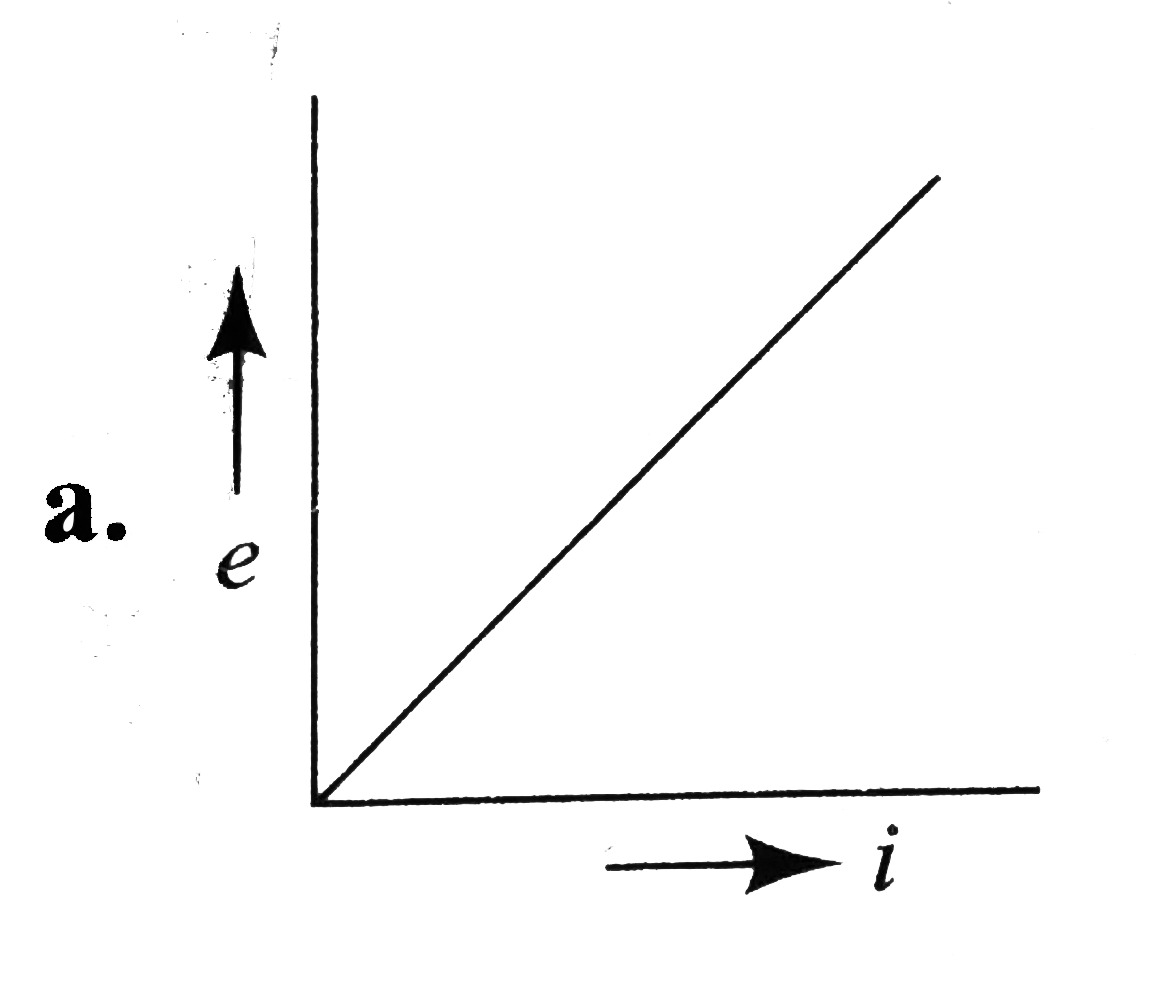 B
B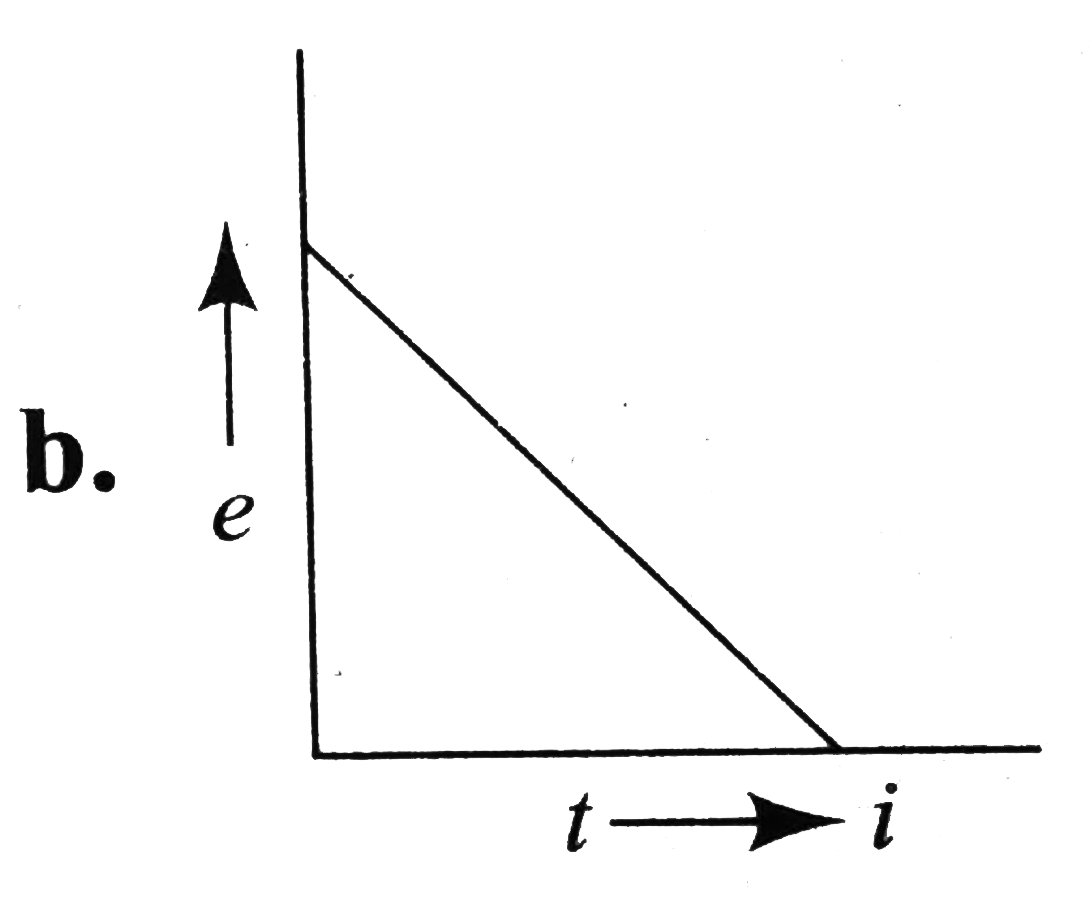 C
C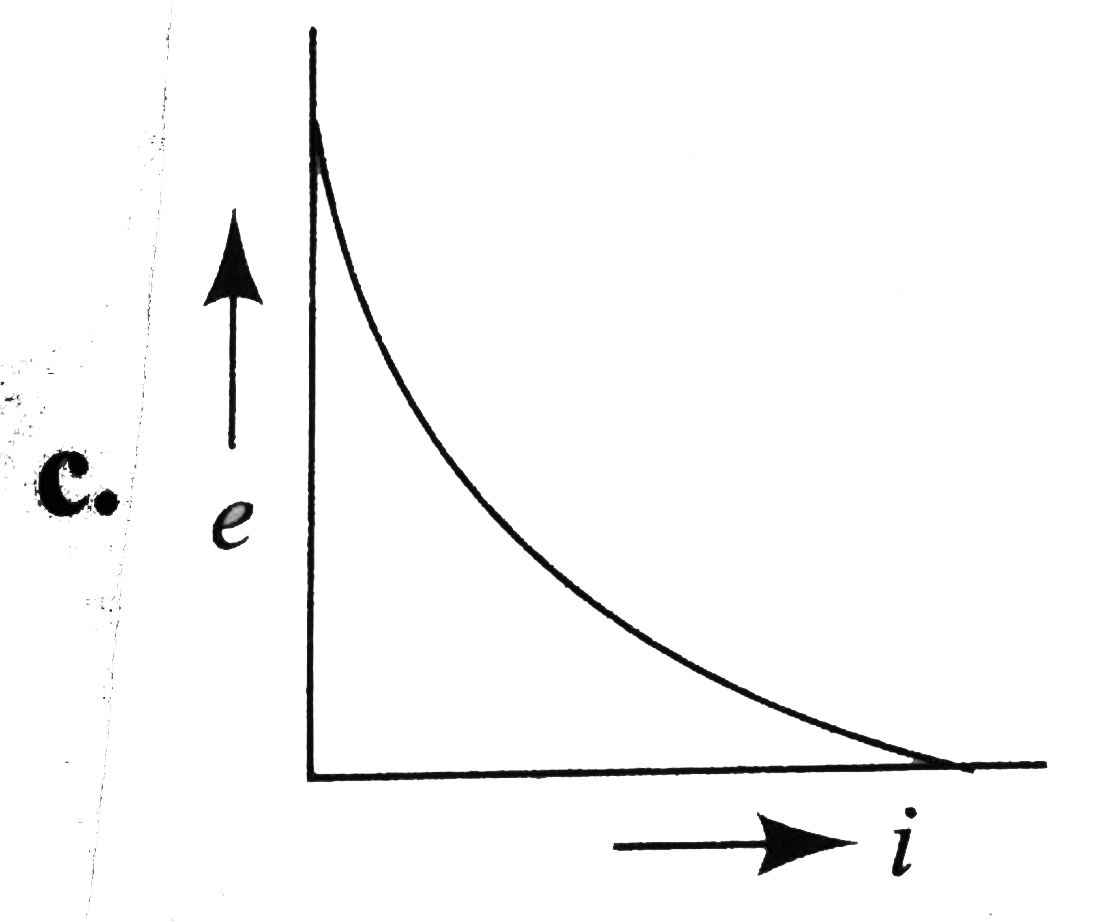 D
D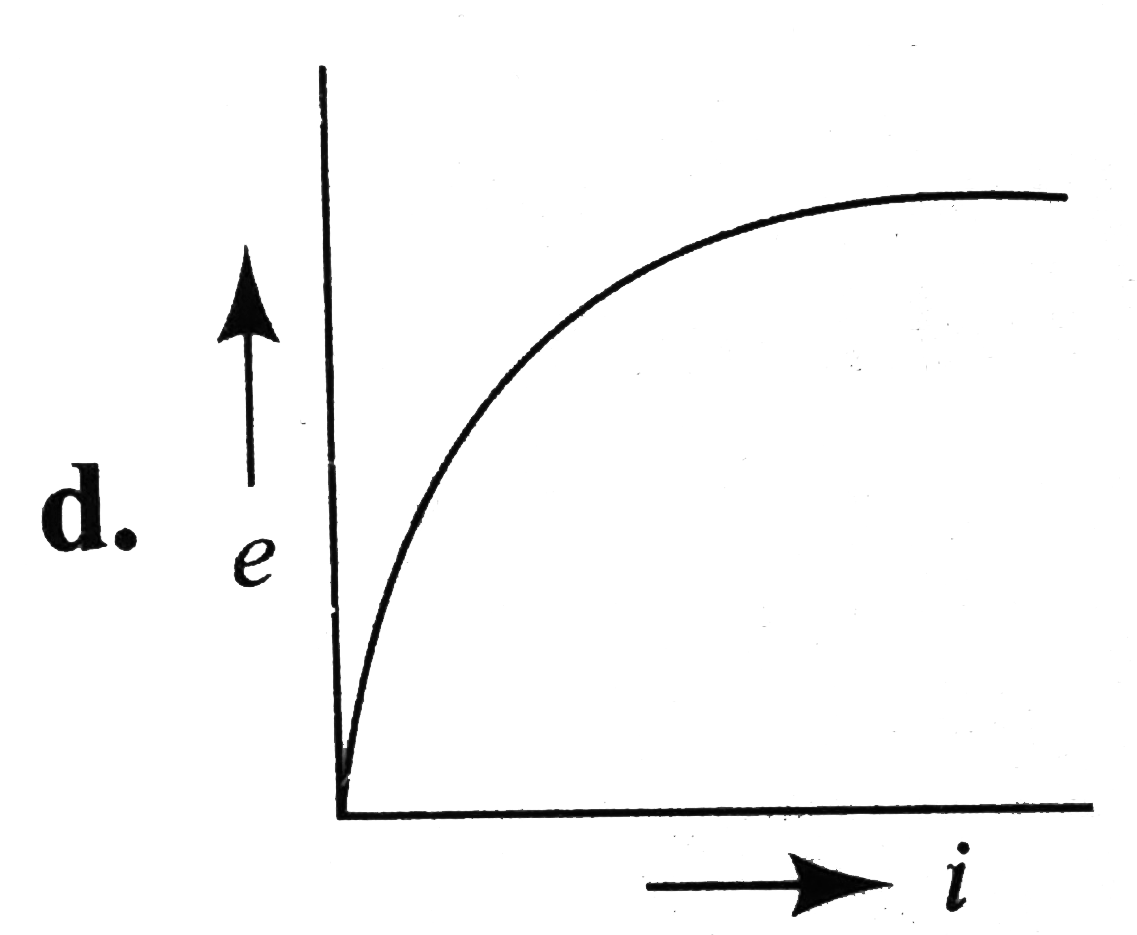
In the circuit shows in Fig the switch is closed at t=0.
 AAt t=0,I1=I2=0BAt any time t,I0I2=L2L1CAt any time t, I1+I2=εRDAt t=∞,I1 and I2 are independent of L1 and L2
In the circuit as shown in figure the switch is closed at t=0.
At the instant of closing the switch
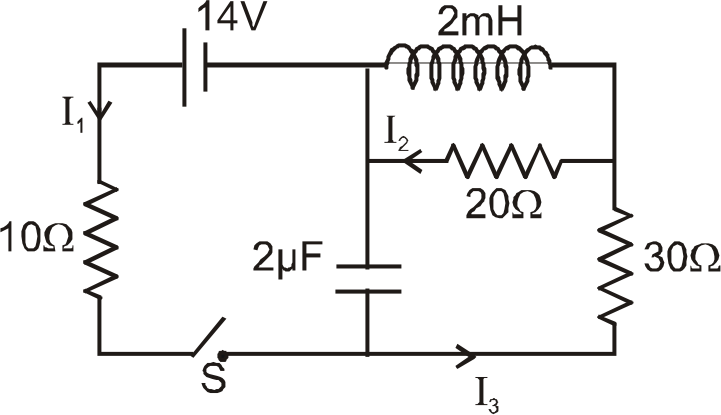
View SolutionIn the circuit shown, the switch is closed at t=0, the currents I1,I2 and I3 are
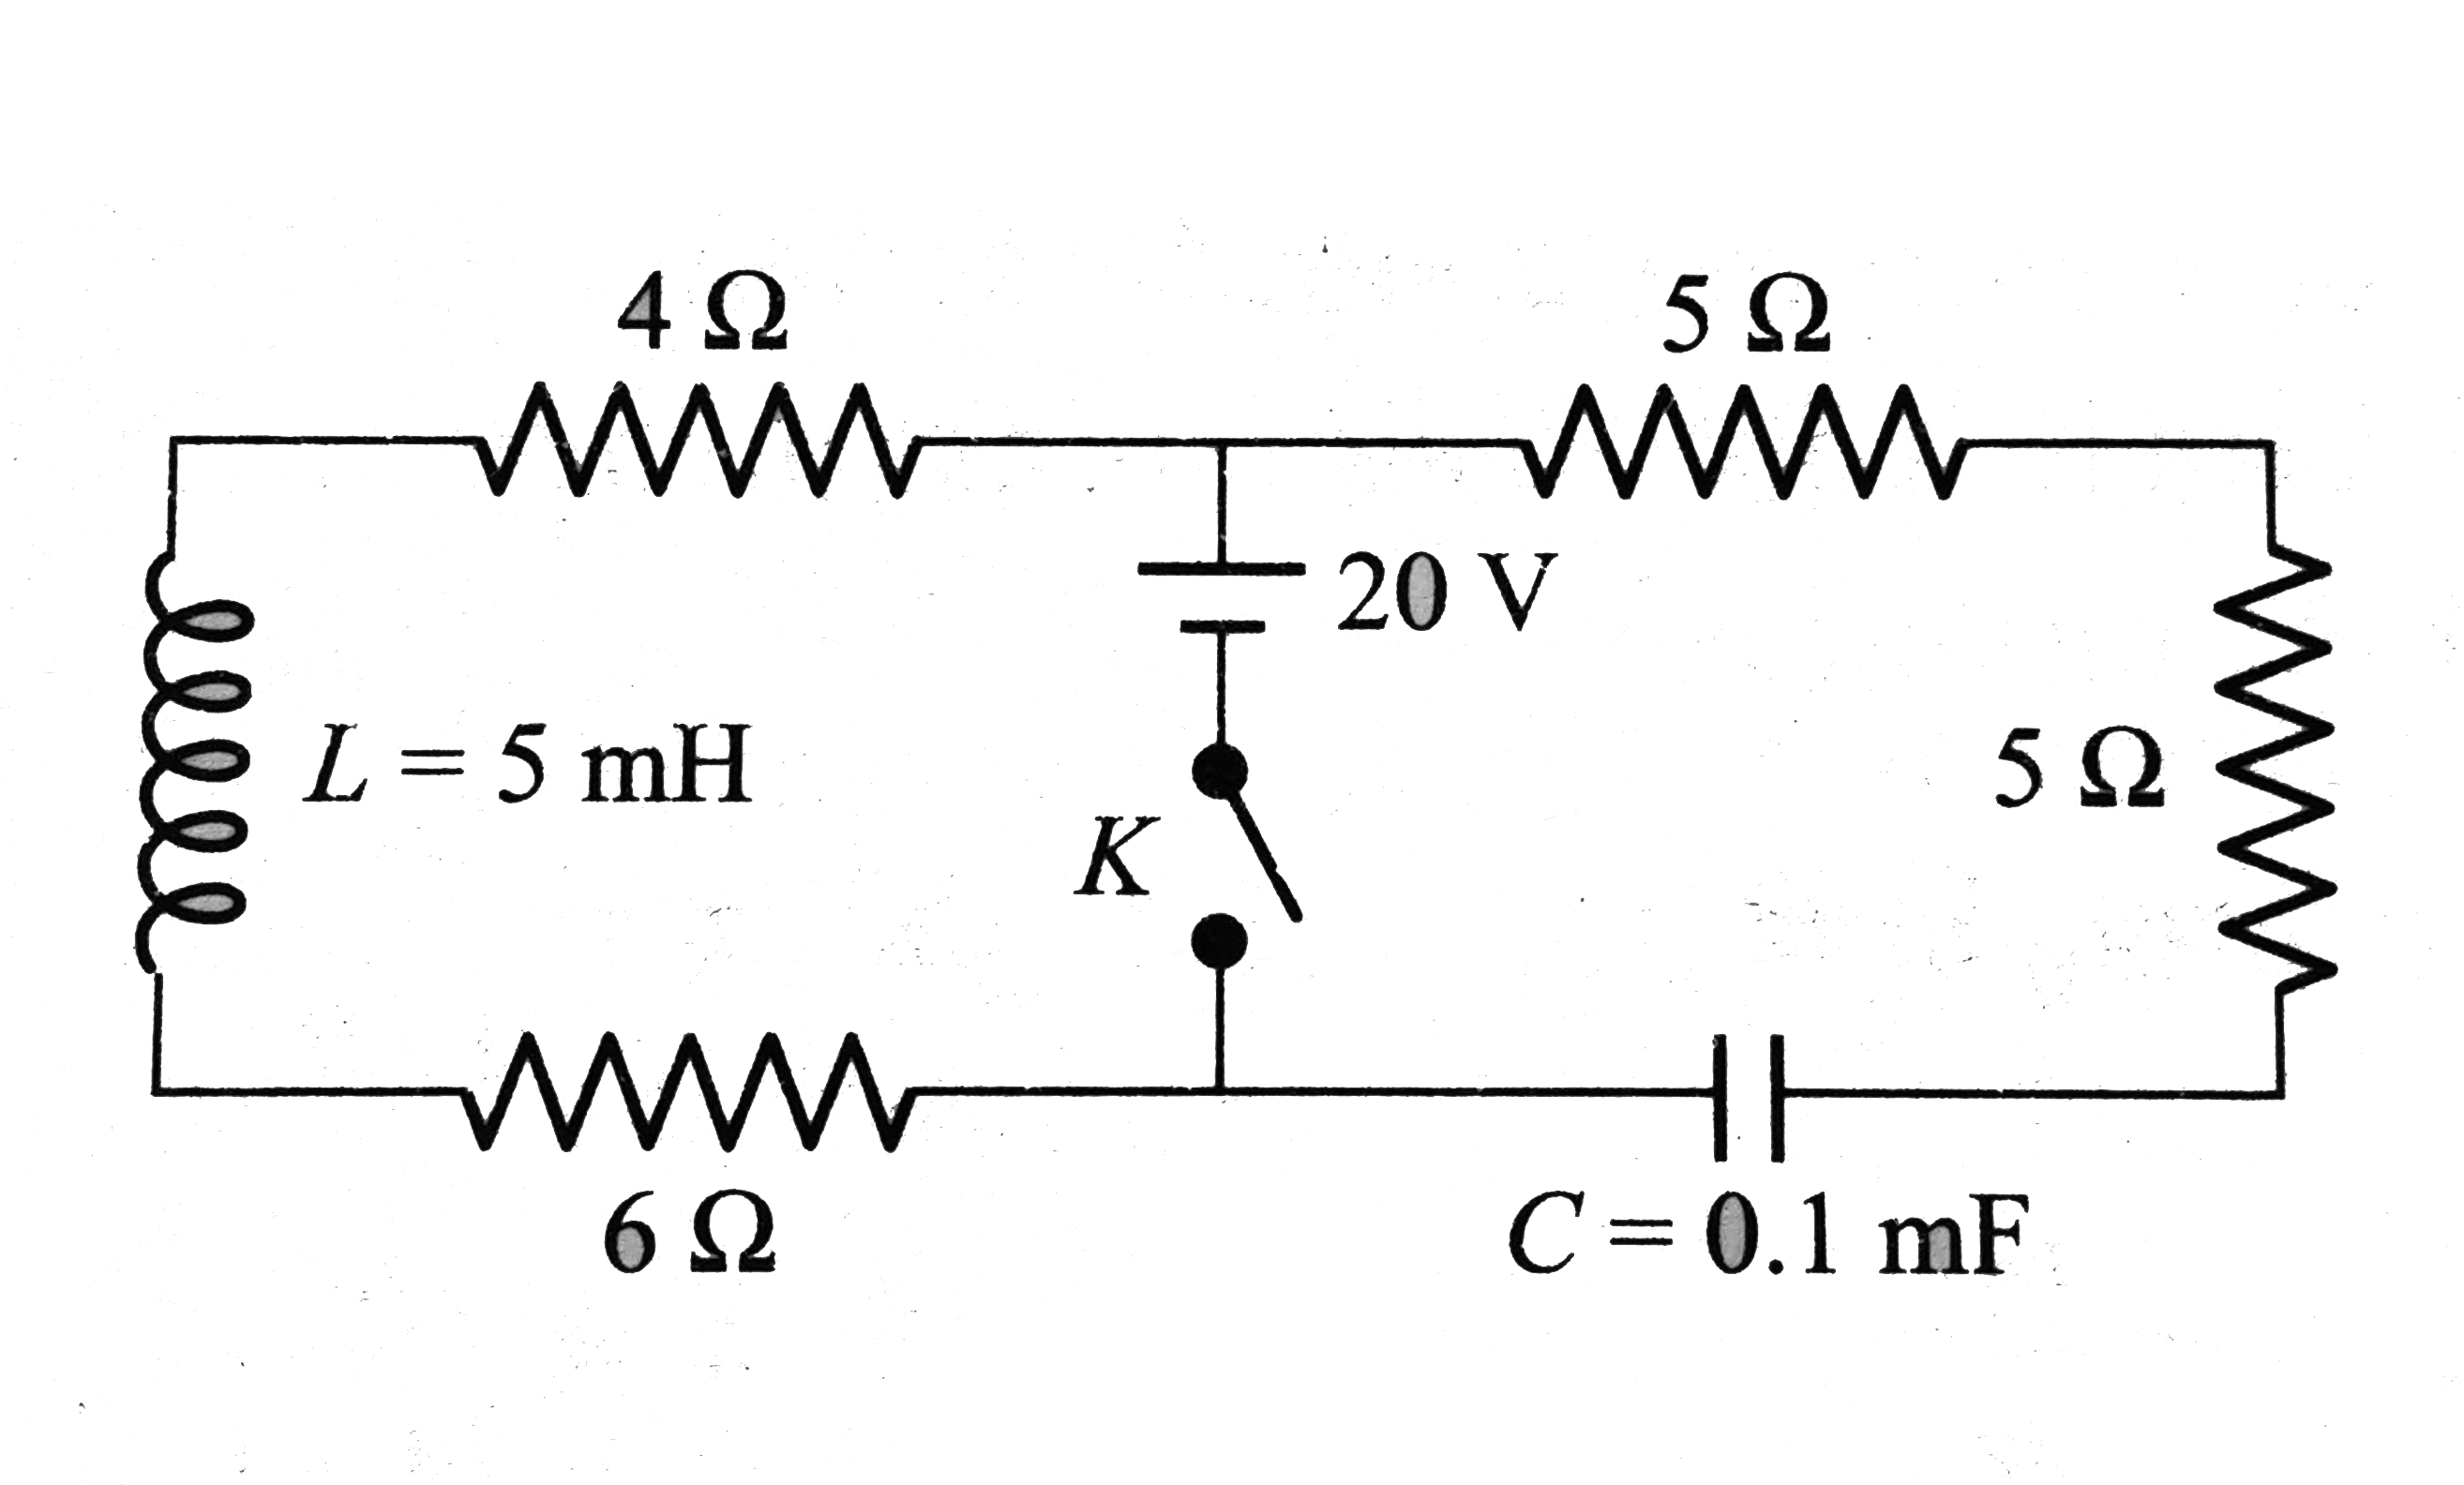
View SolutionIn the circuit shows in Fig. kay K is closed at t=0, the current through the key at the instant t=10−3In2s is
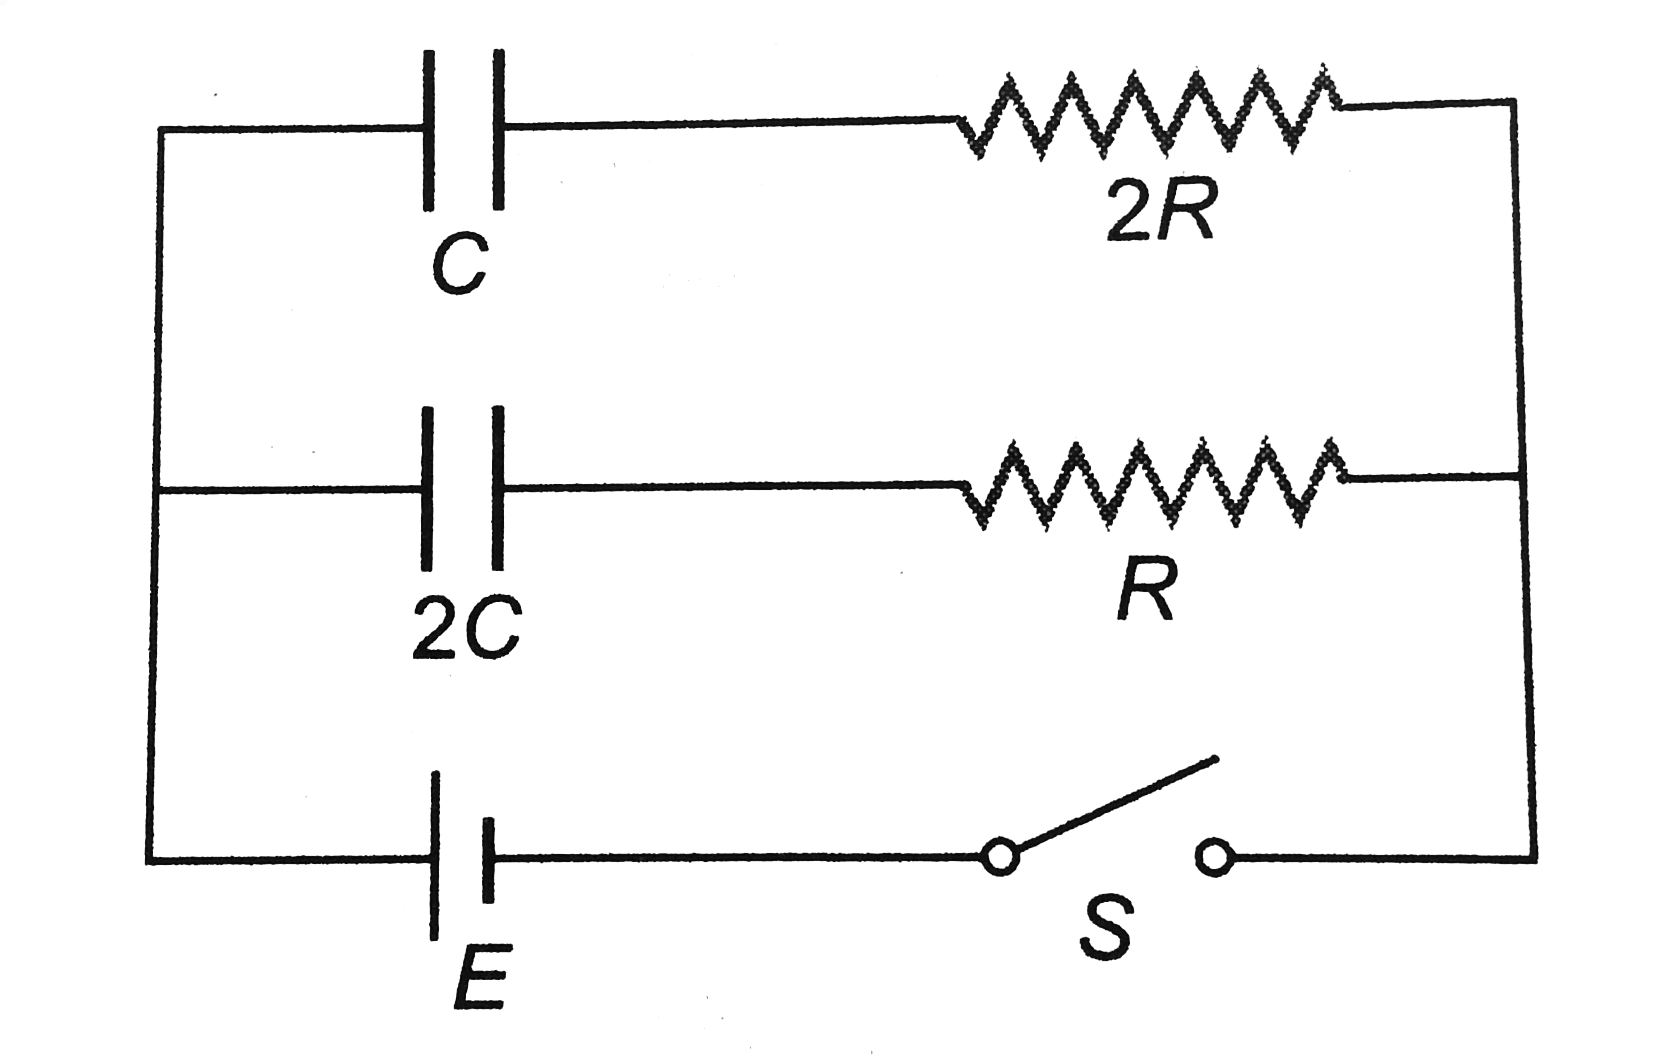
View SolutionIn the circuit shown in the figure, switch S is closed at time t=0. Select the correct statements.
View SolutionIn the circuit as shown in figure the switch is closed at t=0.
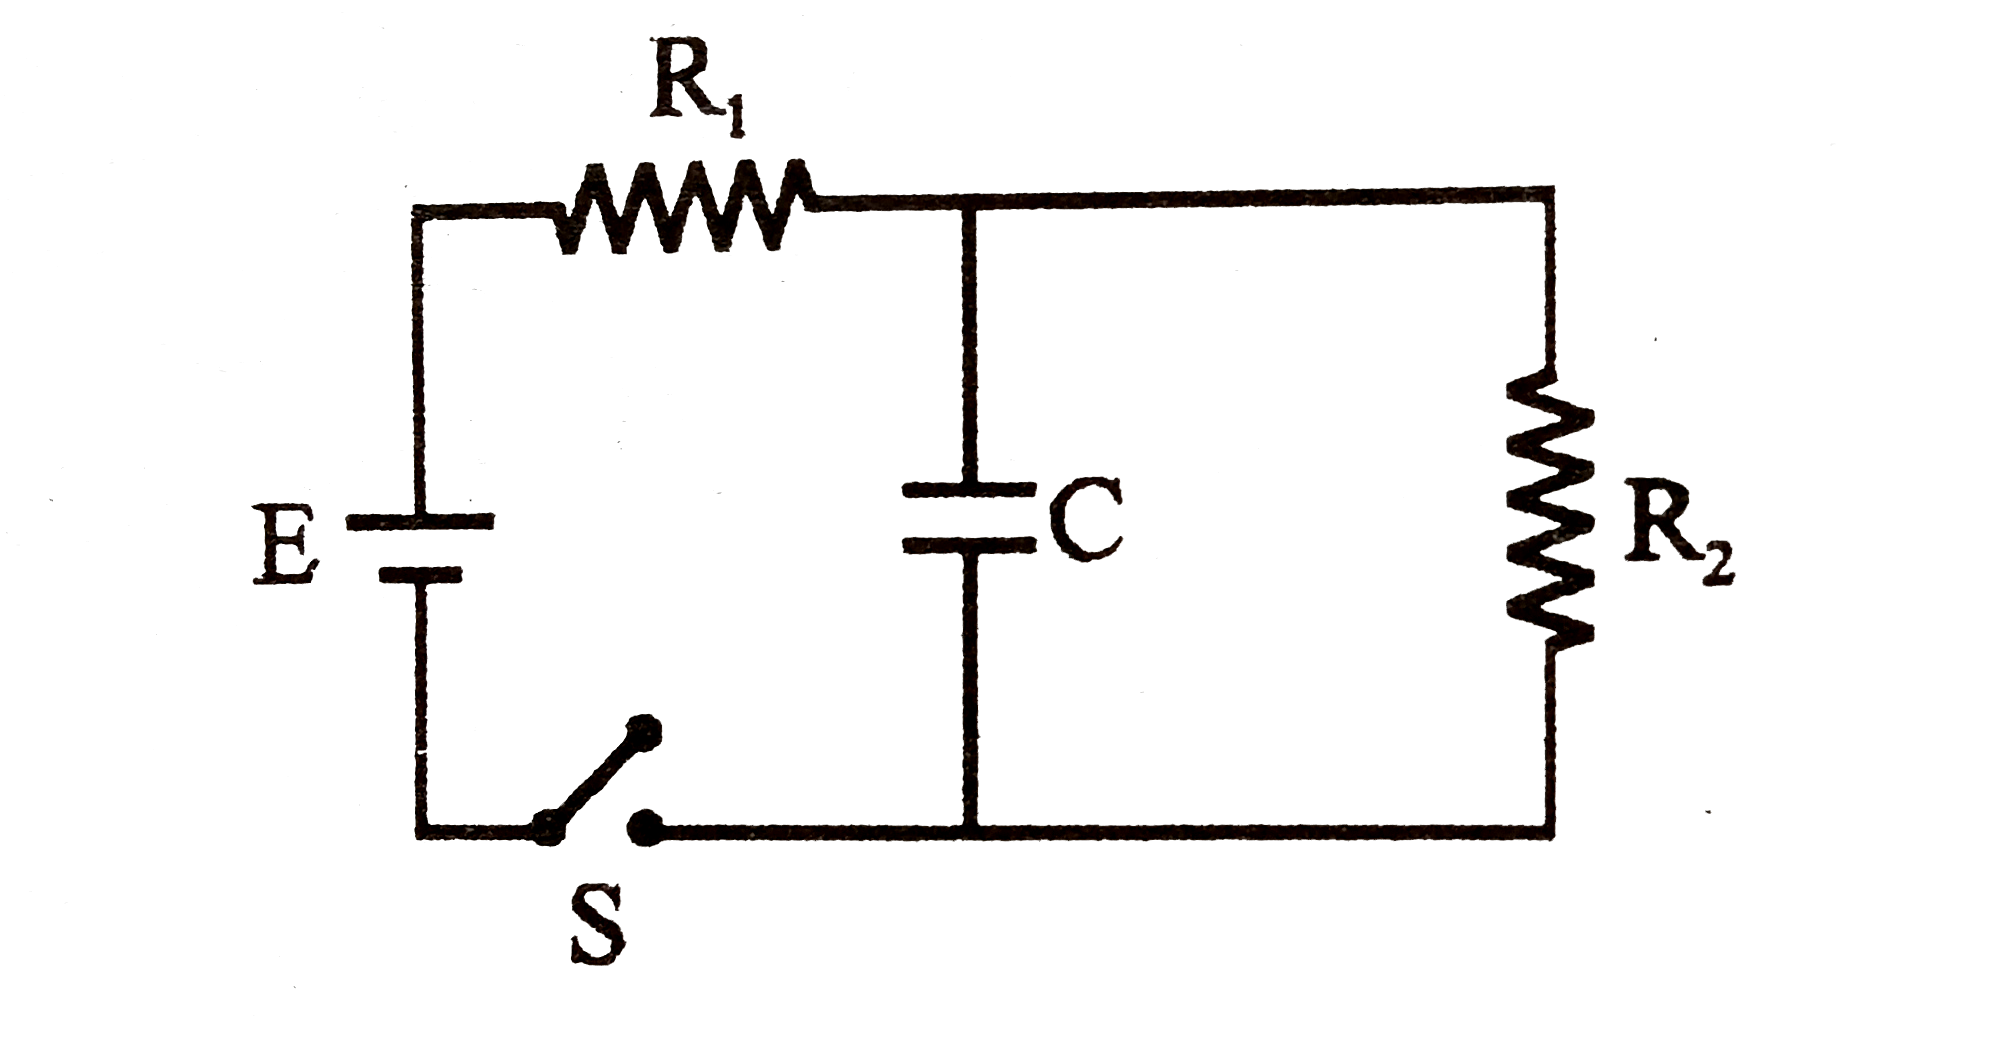
A long time after closing the switch
View Solution

