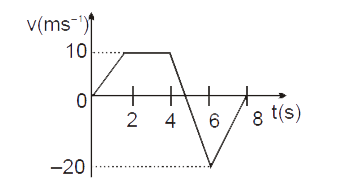
The figure shows the velocity (v) of a particle ploted against time (t).
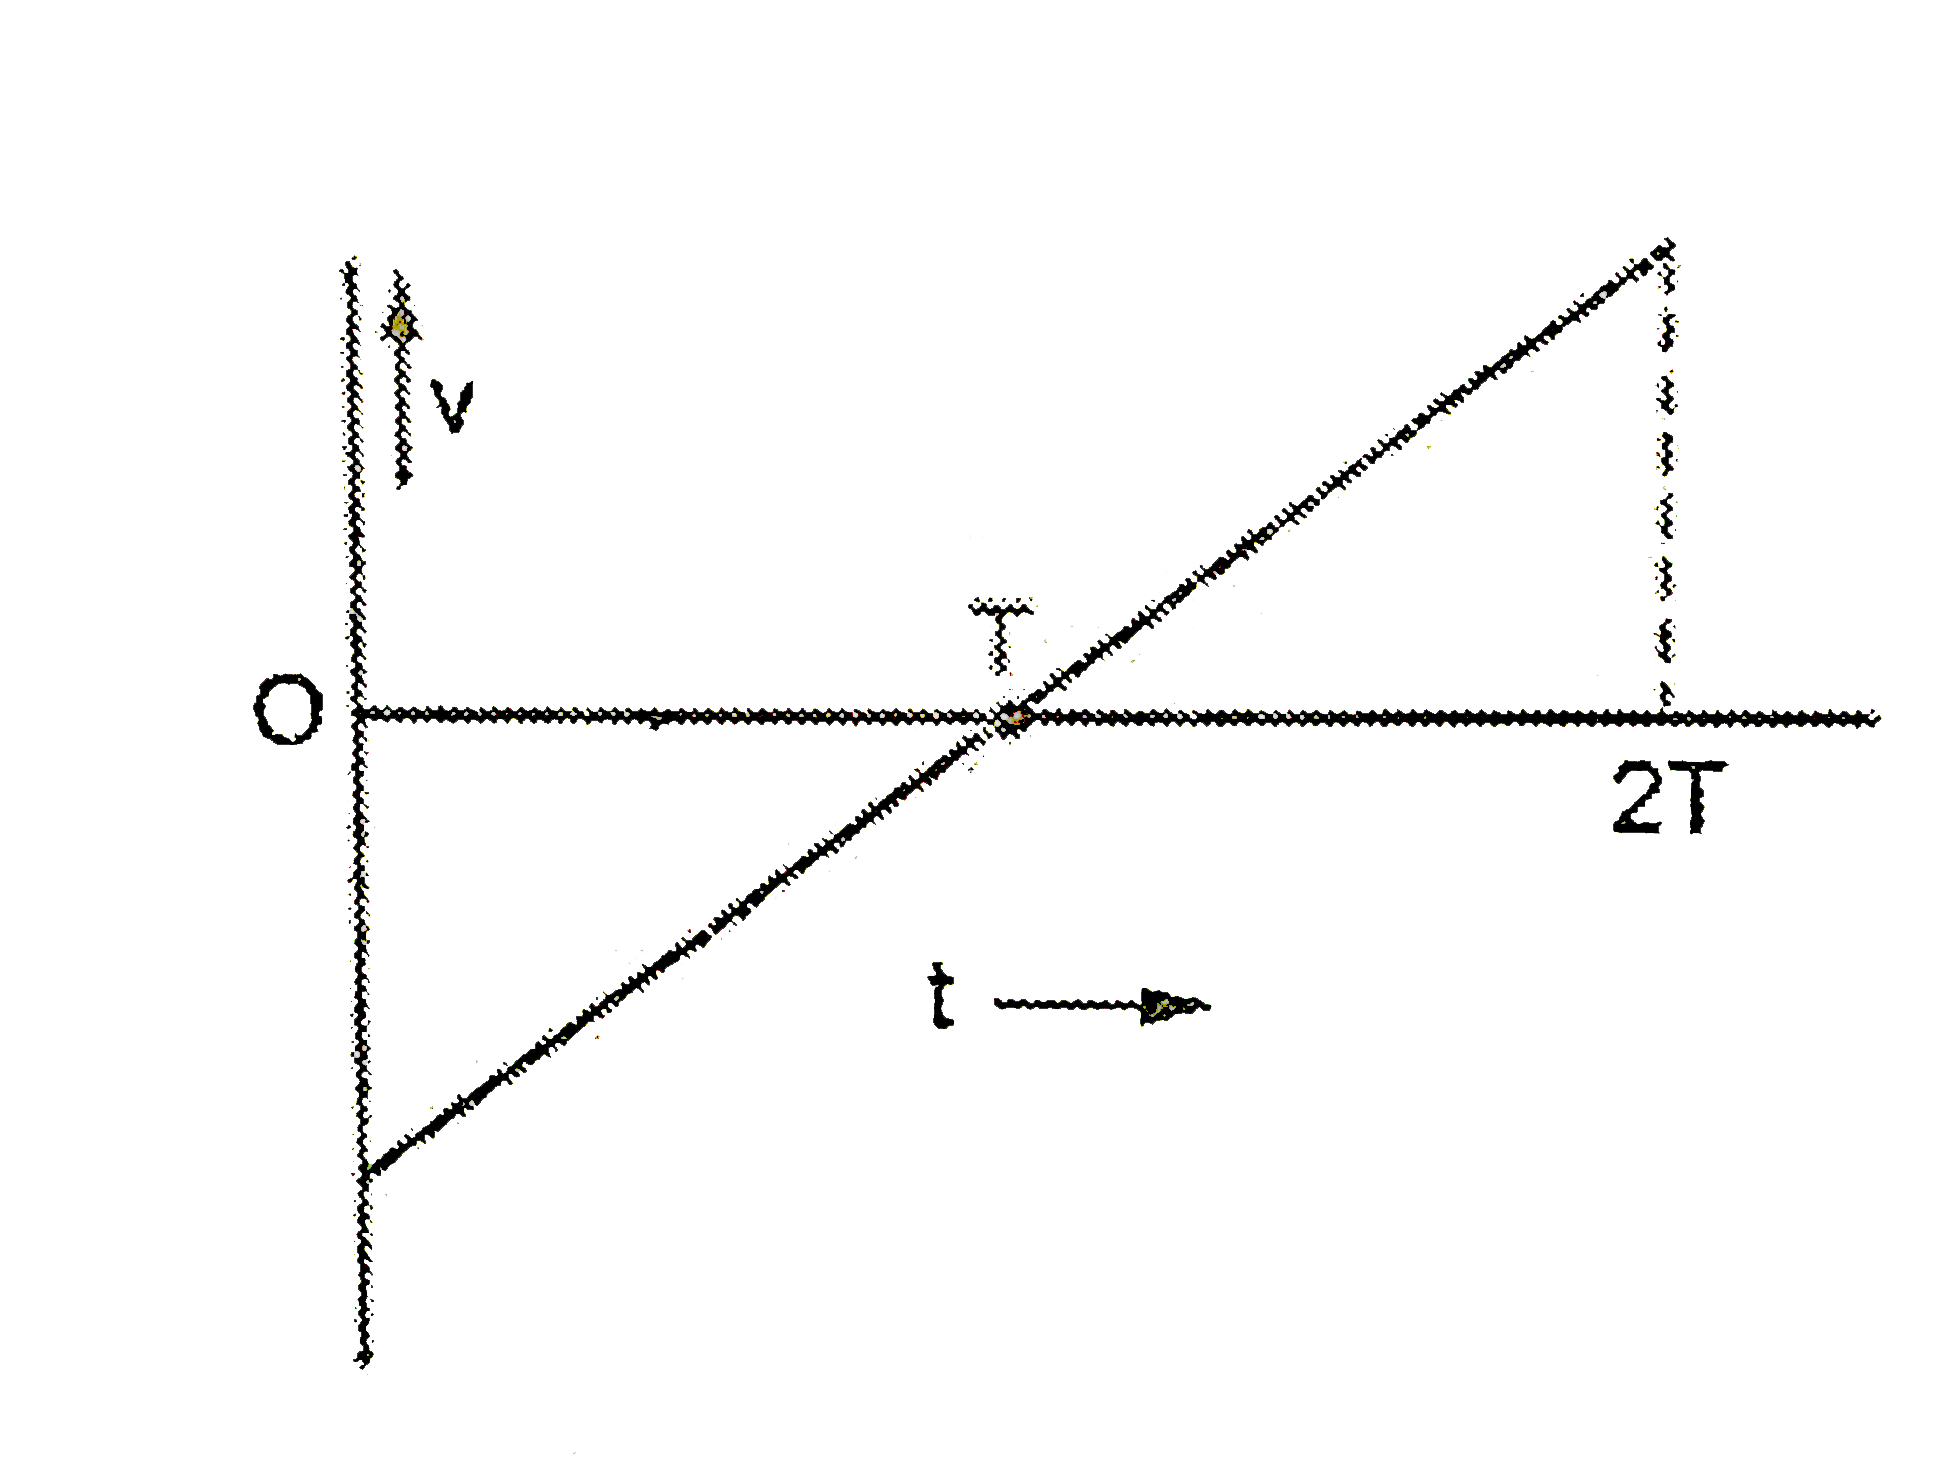
The particle changes its direction of motion at some point
The acceleration of the particle remains constant
The displacement of the particle is zero
The initial and final speeds of the particle are the same.
The correct Answer is:A, B, C, D
Step by step video, text & image solution for The figure shows the velocity (v) of a particle ploted against time (t). by Physics experts to help you in doubts & scoring excellent marks in Class 12 exams.
Topper's Solved these Questions
- BOOK - D MUKHERJEECHAPTER - KINEMATICS, FORCESEXERCISE - Revision Exercise26videos
KINEMATICS, FORCES
- BOOK - D MUKHERJEECHAPTER - KINEMATICS, FORCESEXERCISE - Revision Exercise26videos
KINEMATICS, FORCES
- BOOK - D MUKHERJEECHAPTER - IIT QUESTIONS 5EXERCISE - Matrix matching type2videos
IIT QUESTIONS 5
- BOOK - D MUKHERJEECHAPTER - MISCELLANEOUS QUESTION 1EXERCISE - Miscellaneous Questions-1 (Straight-Objective Type)54videos
MISCELLANEOUS QUESTION 1
Similar Questions
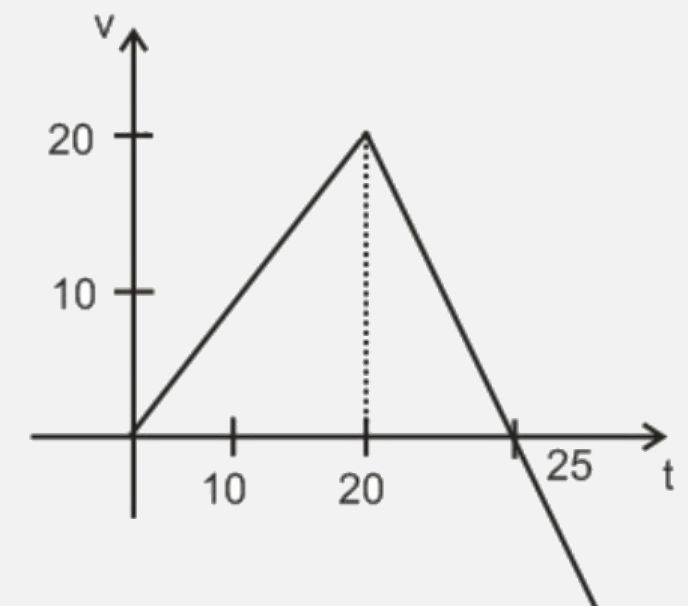
The figure shows the v−t graph of a particle moving in a straight line. Starting from rest, the time after which the particle returns to its starting position is
 View Solution
The figure shows a velocity-time graph of a particle moving along a straight line
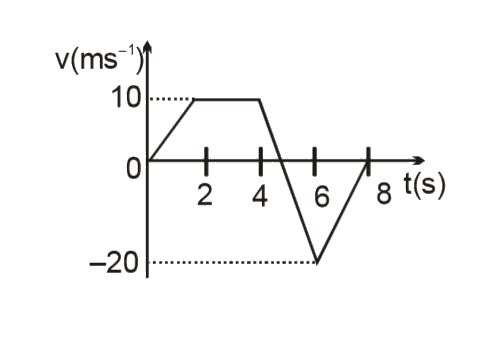
Q. The maximum of displacement of the particle isView Solution
Knowledge Check
- Question 1 - Select One or More
The figure shows the velocity (v) of a particle plotted against time (t).
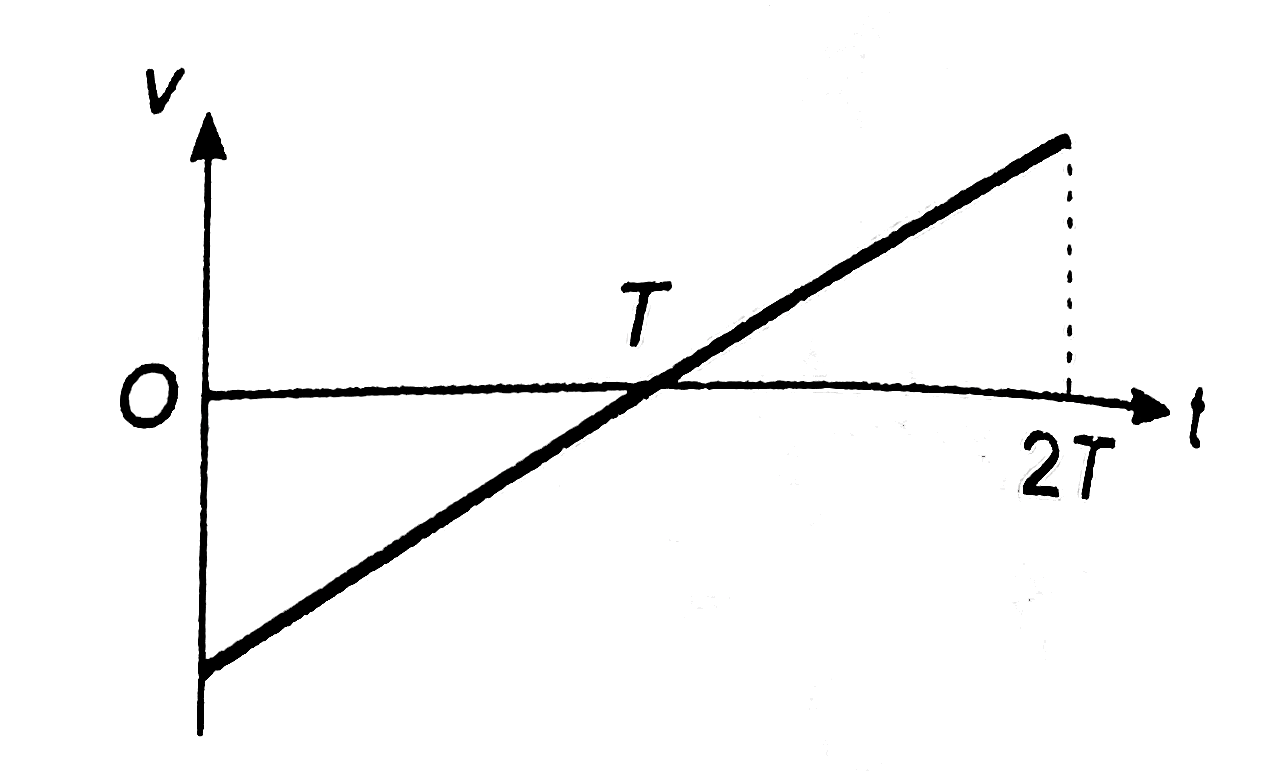 AThe particle changes its direction of motion at some point.BThe acceleration of the particle remains constantCThe displacement of the particle is zeroDThe initial and final speeds of the particle are the same
 - Question 2 - Select One
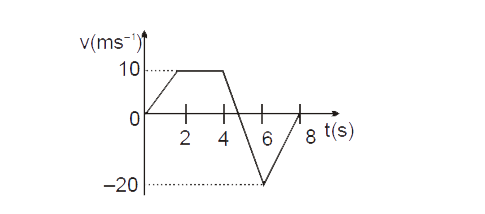
The figure shows a velocity-time graph of a particle moving along a straight line
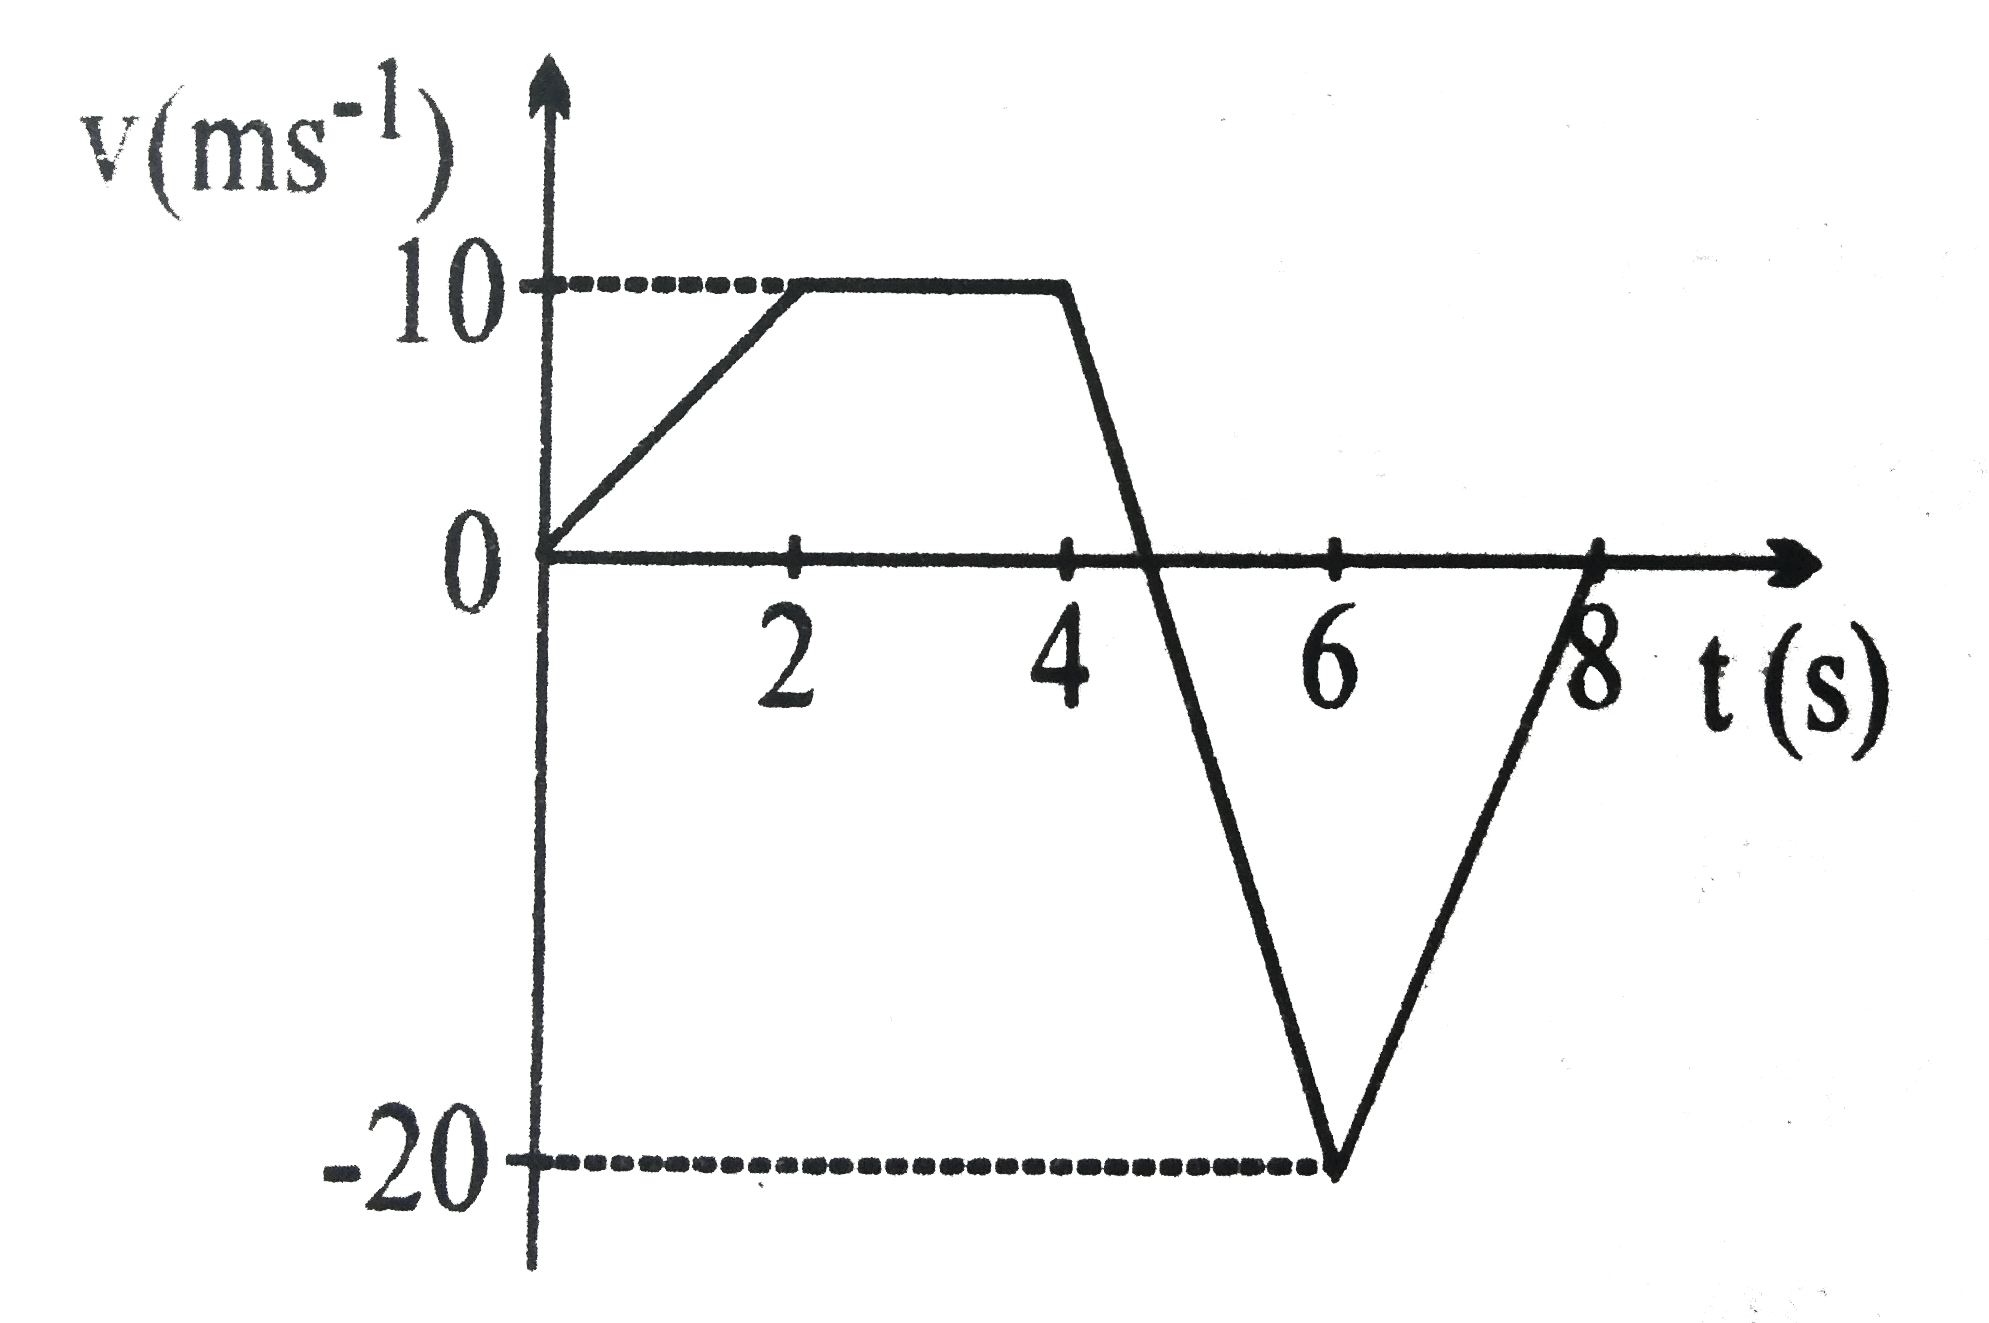
The maximum displacement of the particle isA33.3mB23.3mC18.3mDzero - Question 3 - Select One
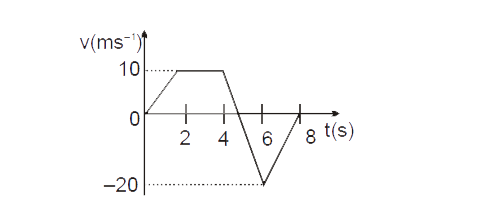
The figure shows a velocity-time graph of a particle moving along a straight line
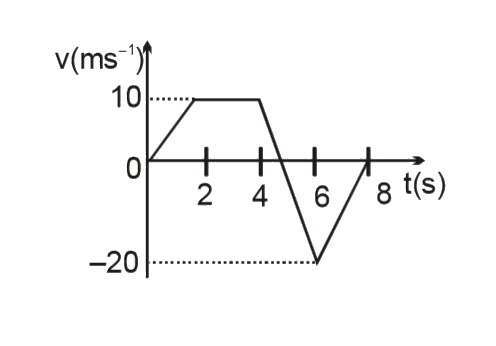
Q. The total distance travelled by the particle isA66.6 mB51.6 mCzeroD36.6m
The figure shows a velocity-time graph of a particle moving along a straight line
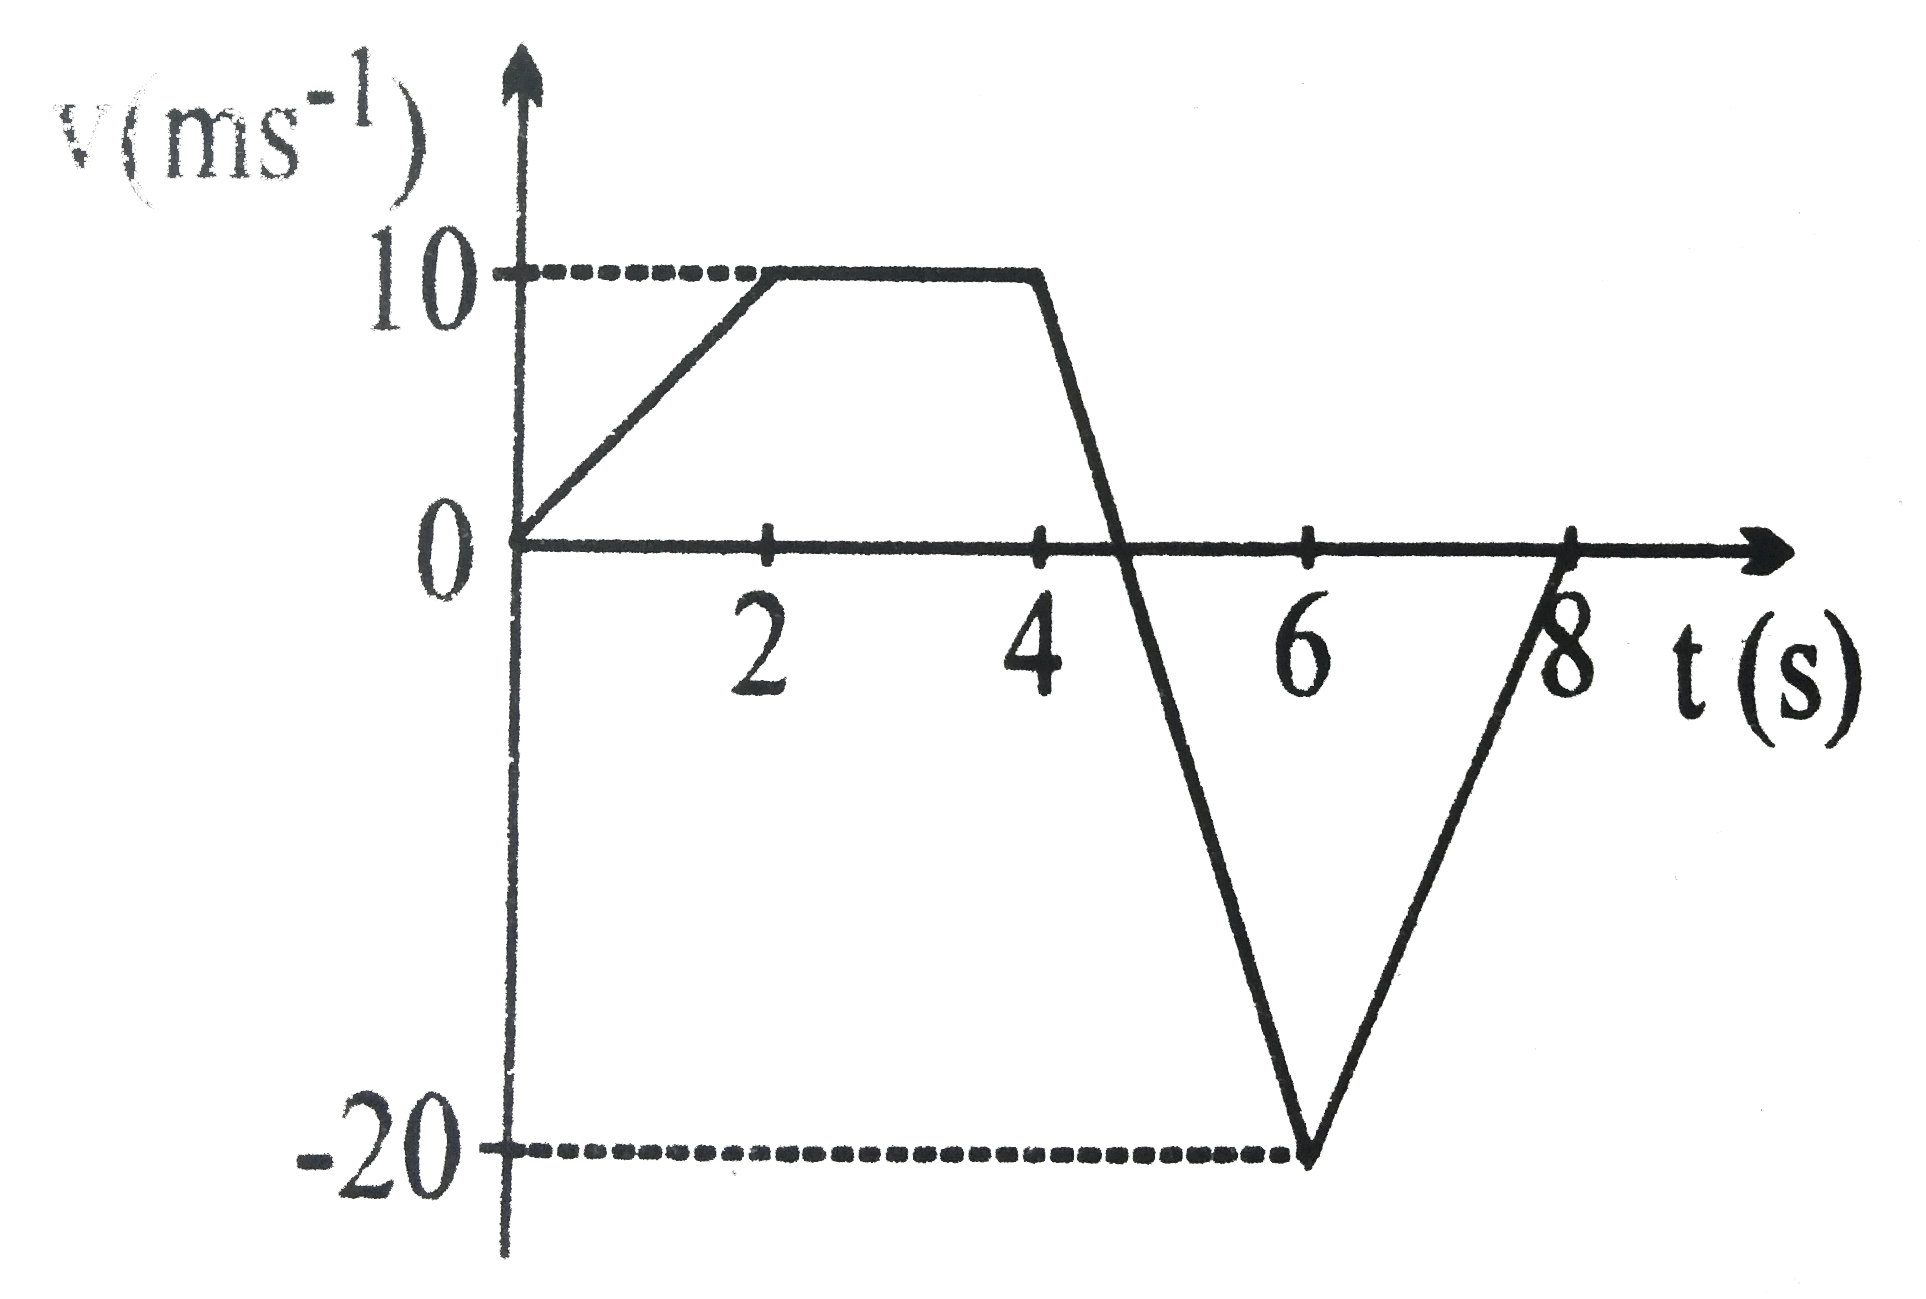
Choose the incorrect statement. The particle comes to rest atView SolutionThe figure shows a velocity-time graph of a particle moving along a straight line
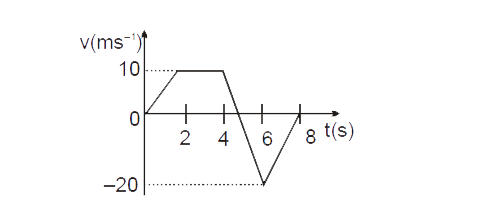
Choose the incorrect statement. The particle comes to rest atView SolutionThe figure shows a velocity-time graph of a particle moving along a straight line
The maximum of displacement of the particle isView SolutionThe figure shows a velocity-time graph of a particle moving along a straight line
The total distance travelled by the particle isView SolutionThe figure shows a velocity-time graph of a particle moving along a straight line
Identify the region in which the rate of change of velocity ∣∣∣Δ¯vΔt∣∣∣ of the particle is maximumView Solution

