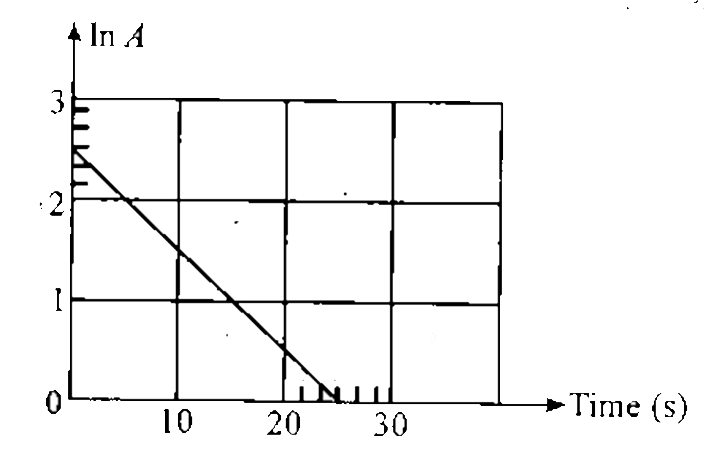
The graph shows how the count-rate A of a radioactive source varies with time t. A and t are related as: (assume in (12)=2.5)
A=2.5e−10t
A=12e10t
A=2.5e−(0.1t)
A=12e−(0.1t)
The correct Answer is:D
Step by step video, text & image solution for The graph shows how the count-rate A of a radioactive source varies with time t. A and t are related as: (assume in (12)=2.5) by Physics experts to help you in doubts & scoring excellent marks in Class 12 exams.
Updated on:21/07/2023Similar Questions
The graph in the figure shows how the count-rate A of adioactive source as measured by a Geiger counter varies with time t. The relationship between A and t is A=ke−0.1t. Find k. (Assume ln12=2.6)
'(## CEN_KSR_PHY_JEE_CO30_E01_036_Q02##)'
View SolutionIf displacements of a particle varies with time t as s=1t2 , then.
View Solution
Knowledge Check
The graph between the instantaneous concentration (N) of a radioactive element and time (t) is.
A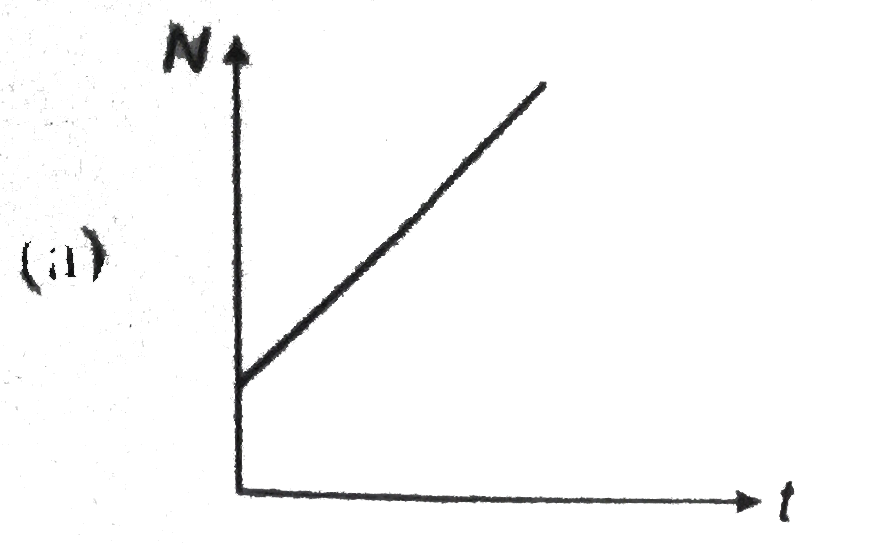 B
B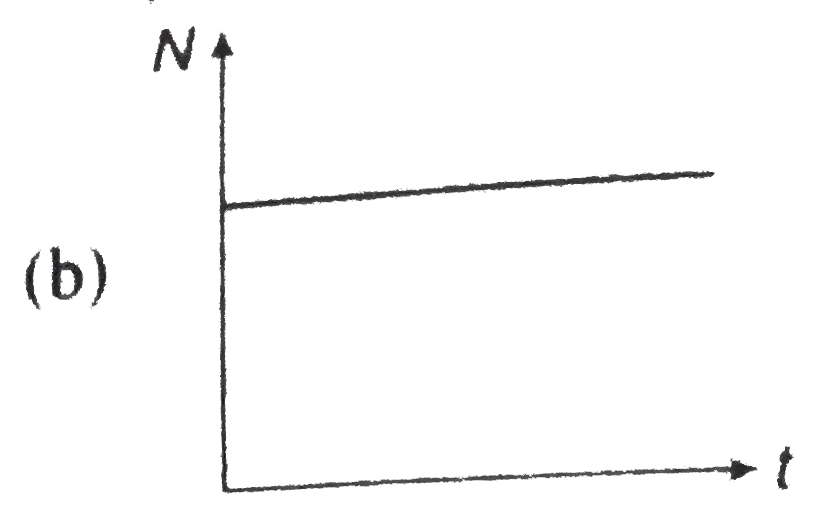 C
C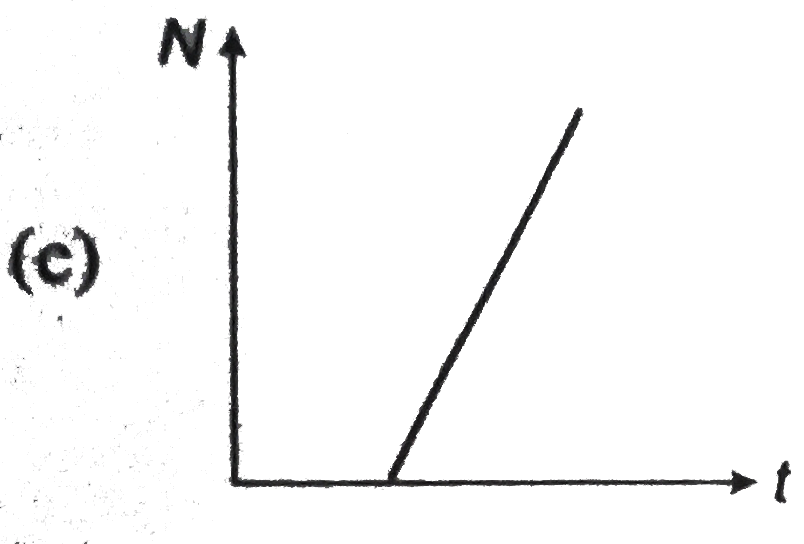 D
D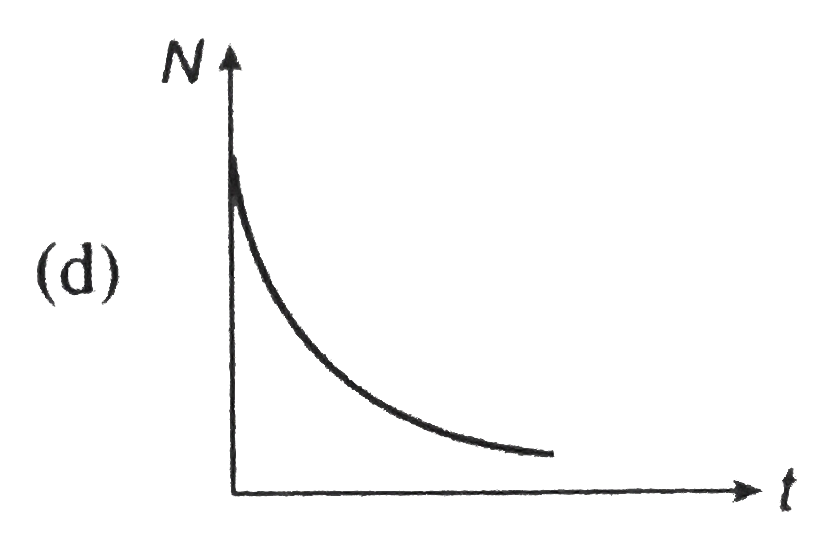
The graph between number of decayed atoms N' of a radioactive element and time t is.
A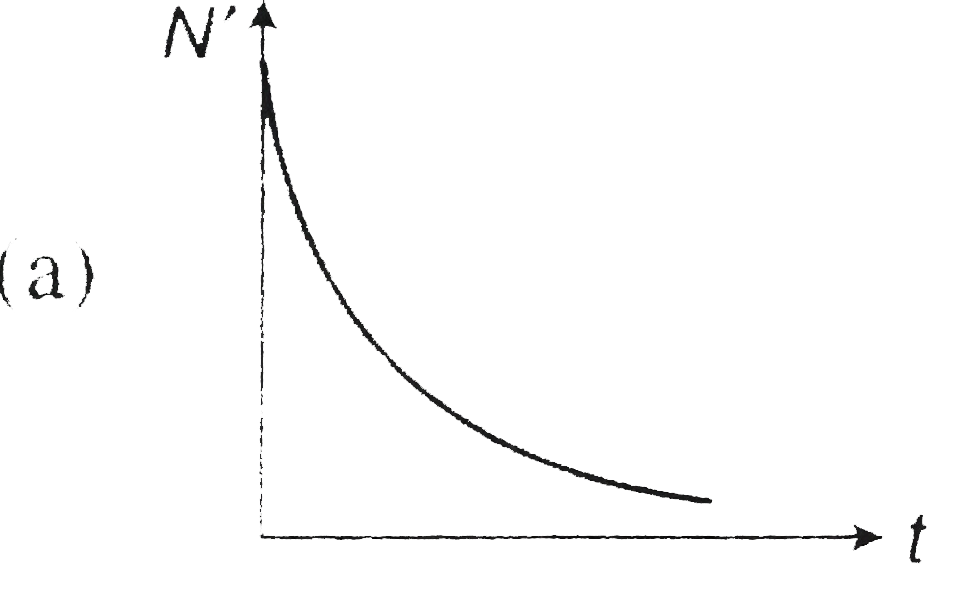 .B
.B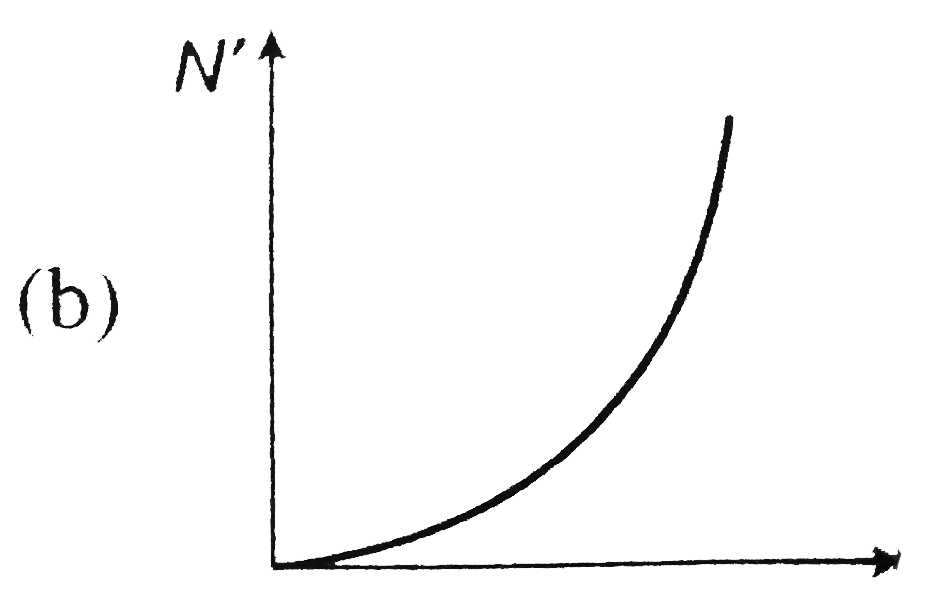 .C
.C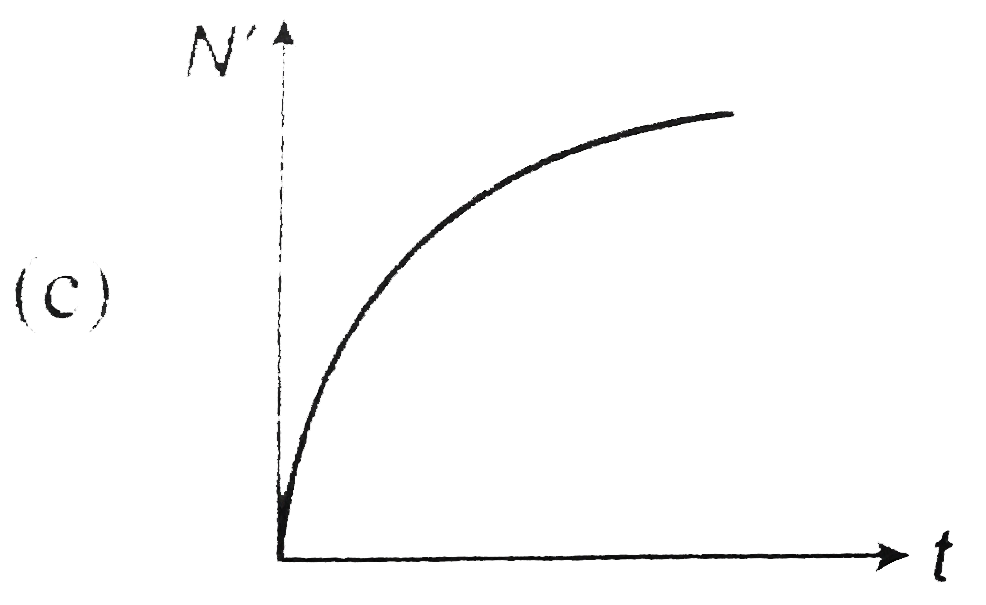 .D
.D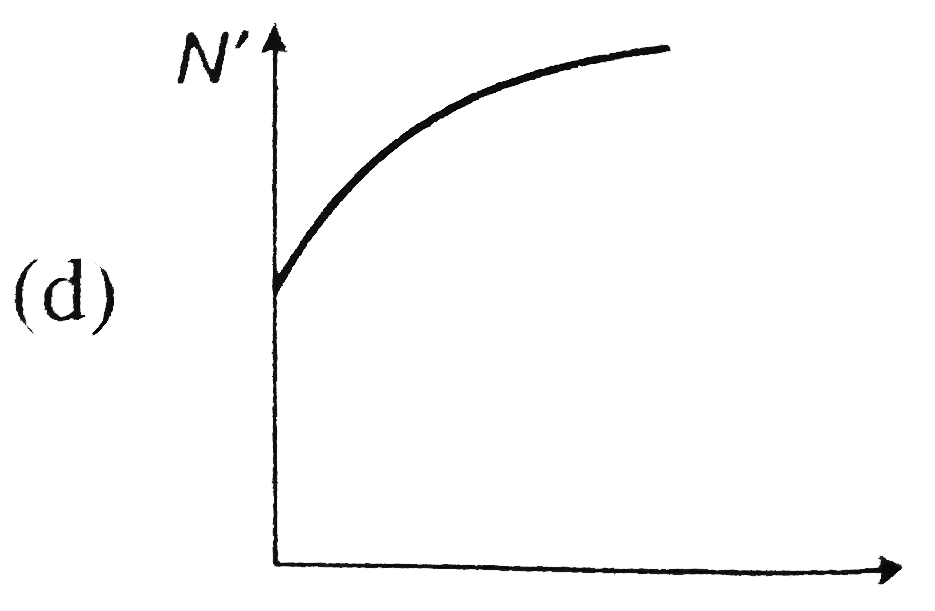 .
.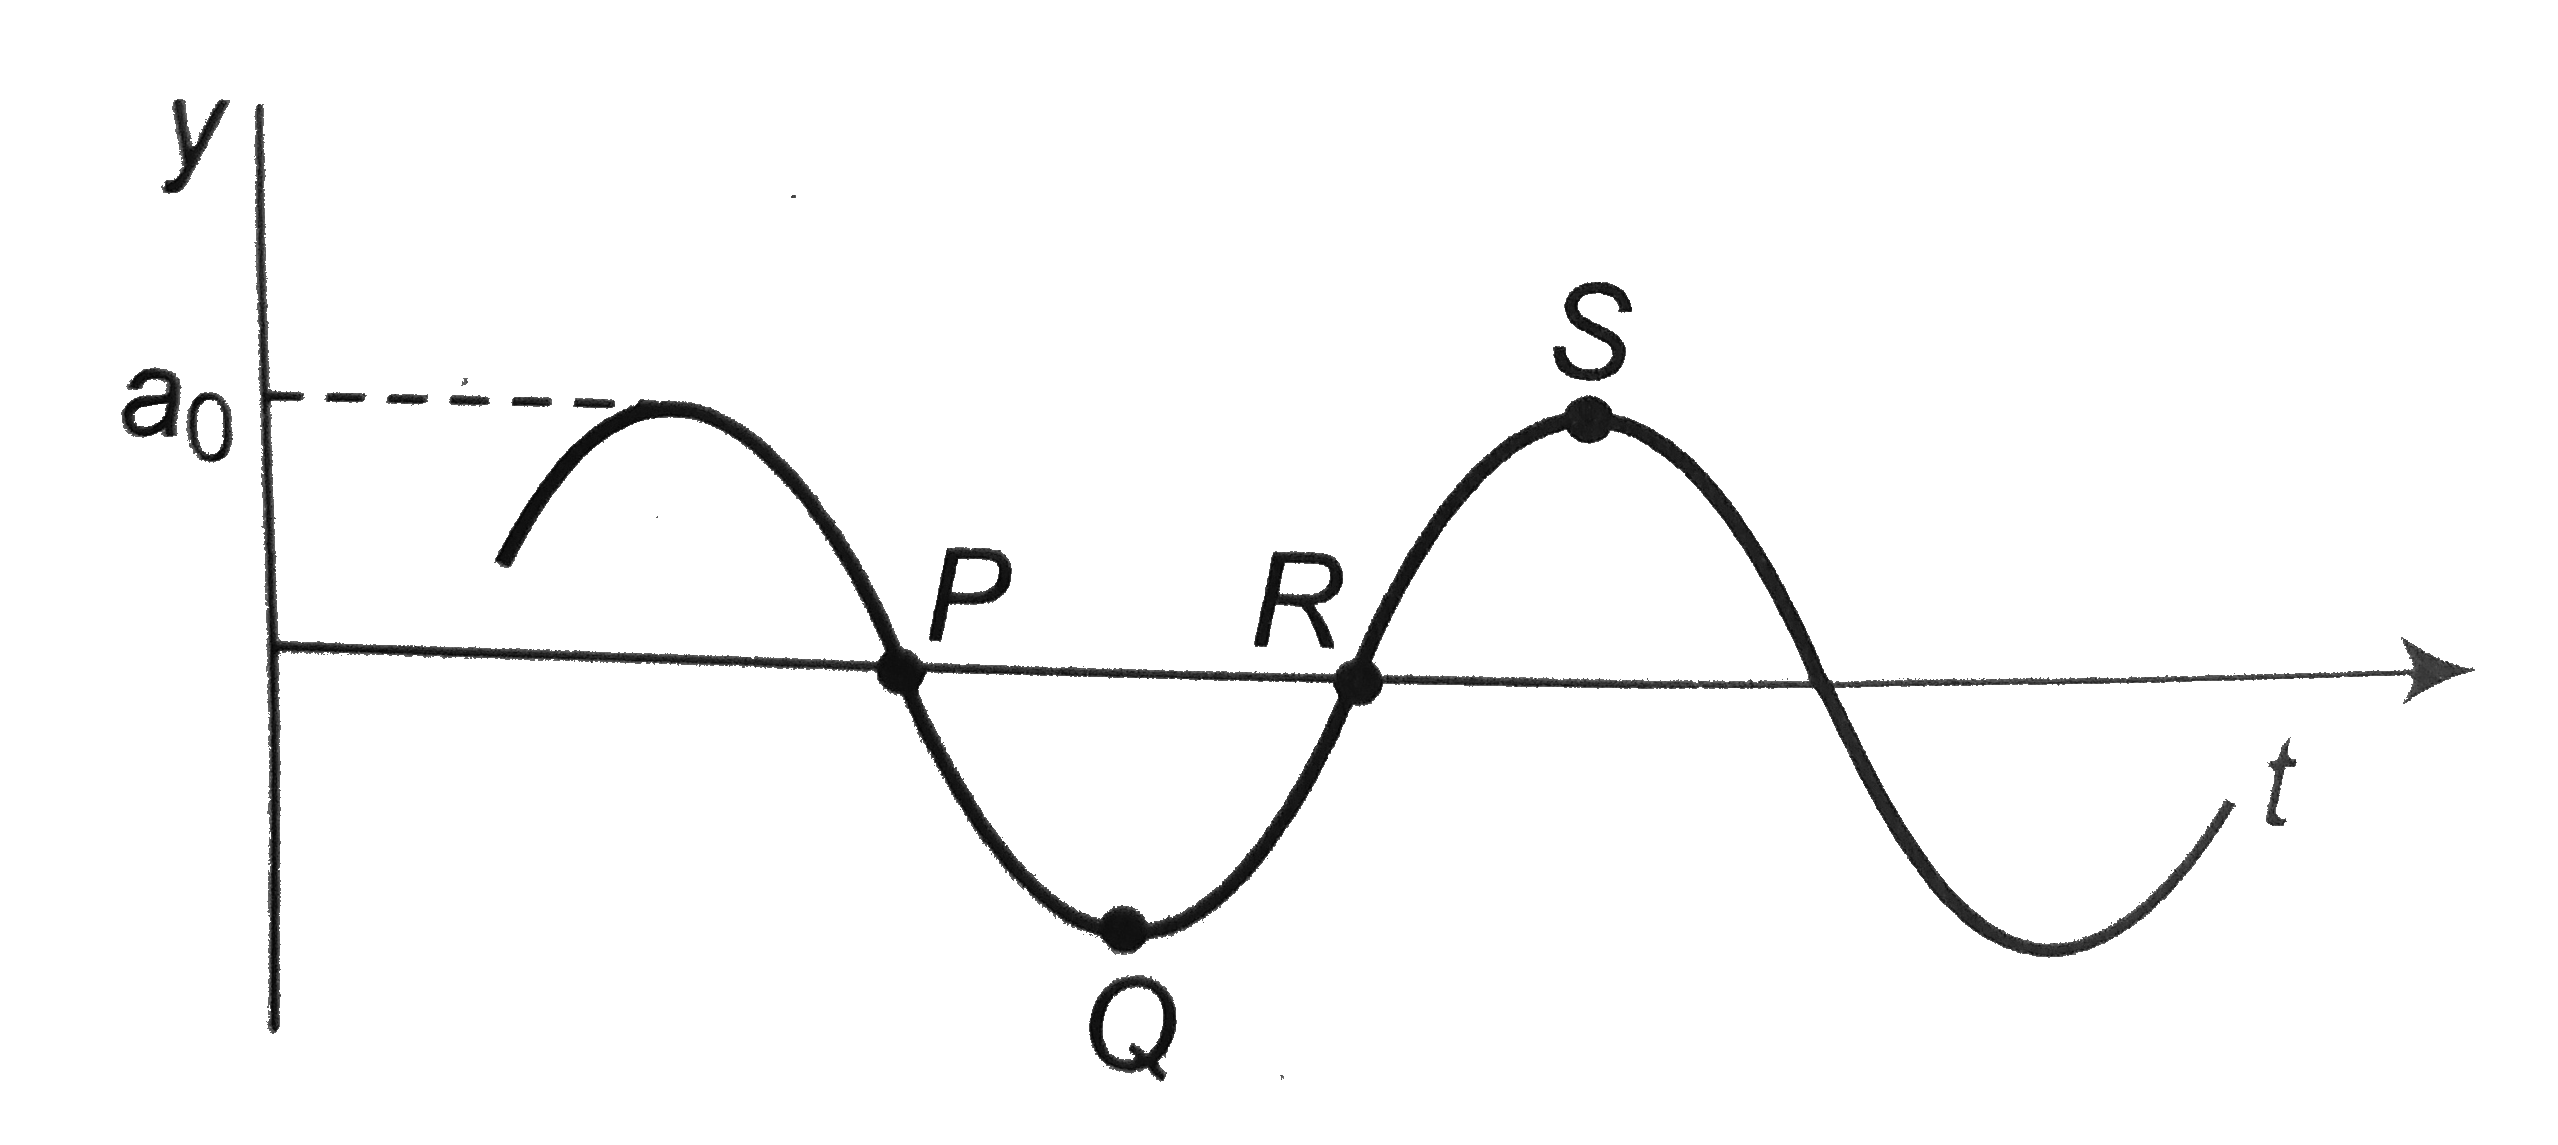
A wave motion has the function y=a0sin(ωt−kx). The graph in figure shows how the displacement y at a fixed point varies with time t. Which one of the labelled points Shows a displacement equal to that at the position x=π2k at time t=0?APBQCRDS
The count rate of a radioactive sample was 1600 count/s at t=0 and 100 counts at t=8 s . Select the correct alternatives
View SolutionThe voltage of an a.c. source varies with time according to relation
E=120 sin 100πtcos100πt then
View SolutionThe displacement of a particle varies with time according to the relation y=asinωt+bcosωt.
View SolutionThe graph shows the log of activity (logR) of a radioactive material as a function of time t in minutes

The half -life (in minutes) for the decay is closest to
View SolutionThe initial count rate for a radioactive source was found to be 1600 count/sec.and t = 8 sec this rate was 100 count/sec. What was the count rate at t = 6 [in counts/sec]-
View Solution

