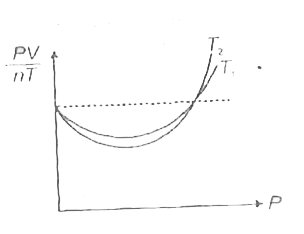
Why is the PV vs P plot for an ideal gas at a given temperature parallel to P axis?Solution in Bengali
At a given temperature for a given amoun of gas PV is always is constant, irrespective of the value of P.
Topper's Solved these Questions
- STATES OF MATTER : GASES AND LIQUIDSBook:CHHAYA PUBLICATIONChapter:STATES OF MATTER : GASES AND LIQUIDSExercise:EXERCISE (FILL IN THE BLANKS)
Explore 13 Videos
- STATES OF MATTER : GASES AND LIQUIDSBook:CHHAYA PUBLICATIONChapter:STATES OF MATTER : GASES AND LIQUIDSExercise:EXERCISE (SHORT TYPE QUESTIONS)
Explore 31 Videos
- STATES OF MATTER : GASES AND LIQUIDSBook:CHHAYA PUBLICATIONChapter:STATES OF MATTER : GASES AND LIQUIDSExercise:MCQ HOTSPOT (MORE THAN ONE CORRECT TYPE)
Explore 20 Videos
- SOME BASIC CONCEPTS OF CHEMISTRYBook:CHHAYA PUBLICATIONChapter:SOME BASIC CONCEPTS OF CHEMISTRYExercise:PRACTICE SET
Explore 13 Videos
- STRUCTURE OF ATOMBook:CHHAYA PUBLICATIONChapter:STRUCTURE OF ATOMExercise:PRACTICE SET
Explore 15 Videos
Similar Questions
0.1 ATM=_____Pa=_______torr.
View SolutionAccording to Charles' law, at constant pressure volume of a given mass of gas at −273∘C is zero. How far is this statement true?
View SolutionAt 27∘C, average translational kinetic energies of the molecules in 8g of CH4,8g of O2 and 8g of He are ¯¯¯¯¯¯¯∈1,¯¯¯¯¯¯¯∈2 and ¯¯¯¯¯¯¯∈3 respectively and total kinetic energies of the molecules in these gases are E1,E2andE3 respectively. which of the following is true-
View SolutionWhat do you mean by semimolar NaOH solution?
View SolutionWhat accelerating potential is needed to produce an electron beam with an effective wavelength of 0.090Å-
View SolutionBased upon Boyle's law, draw the plot of P vs V and also PV vs P.
View SolutionThe graph between PV vs P at constant temperature is linear parallel to the pressure axis.
View SolutionThe plot of PV vs P at particular temperature is called isovbar.
View SolutionFor a certain gas which deviates a little from ideal behaviour, a plot between P/p vs P was found to be non- linear . The intercept on y-axis will be :
View SolutionWhat will the nature of PV vs P graph be for a real gas at Boyle temperature?
View SolutionWhat is the slope of the plot of log P vs log V for a given amount of an ideal gas at a givem temperature?
View Solutionfor a given mass of an ideal gas at constant temperature draw and explain the graphs (i) PV^(2) vs V (ii) P^(2)V vs V.
View SolutionThe figure shows the plot of PVnT vs P, for oxygen gas at two different temperatures then

View SolutionFor a certain gas which deviates a little from ideal behaviour, a plot between P/p vs P was found to be non- linear . The intercept on y-axis will be :
View SolutionWhy real gas shows deviation of ideal gas at fixed temperature in geaph of pV → p and p→V.
View Solution

