The graph between number of decayed atoms N' of a radioactive element and time t is.
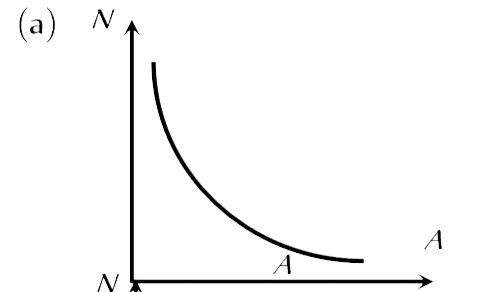
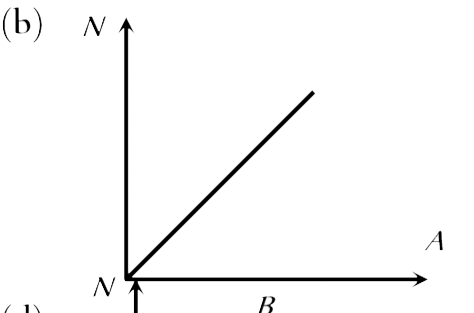
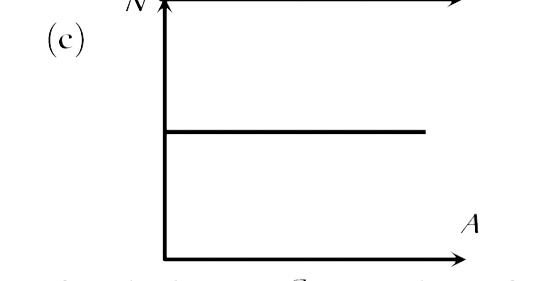
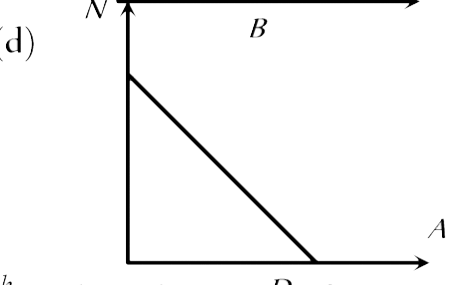
The correct Answer is:D
Step by step video, text & image solution for The graph between number of decayed atoms N' of a radioactive element and time t is. by Physics experts to help you in doubts & scoring excellent marks in Class 12 exams.
Updated on:21/07/2023Topper's Solved these Questions
- ATOMIC AND NUCLEAR PHYSICSBOOK - ERRORLESS CHAPTER - ATOMIC AND NUCLEAR PHYSICSEXERCISE - Ordinary
15 Videos
- ATOMIC AND NUCLEAR PHYSICSBOOK - ERRORLESS CHAPTER - ATOMIC AND NUCLEAR PHYSICSEXERCISE - Nuckeus, Nuclear Reaction
2 Videos
- ALTERNATING CURRENTBOOK - ERRORLESS CHAPTER - ALTERNATING CURRENTEXERCISE - SET
15 Videos
- COMMUNICATION SYSTEMBOOK - ERRORLESS CHAPTER - COMMUNICATION SYSTEMEXERCISE - S E T
14 Videos
Similar Questions
Knowledge Check
The graph between the instantaneous concentration (N) of a radioactive element and time (t) is.
A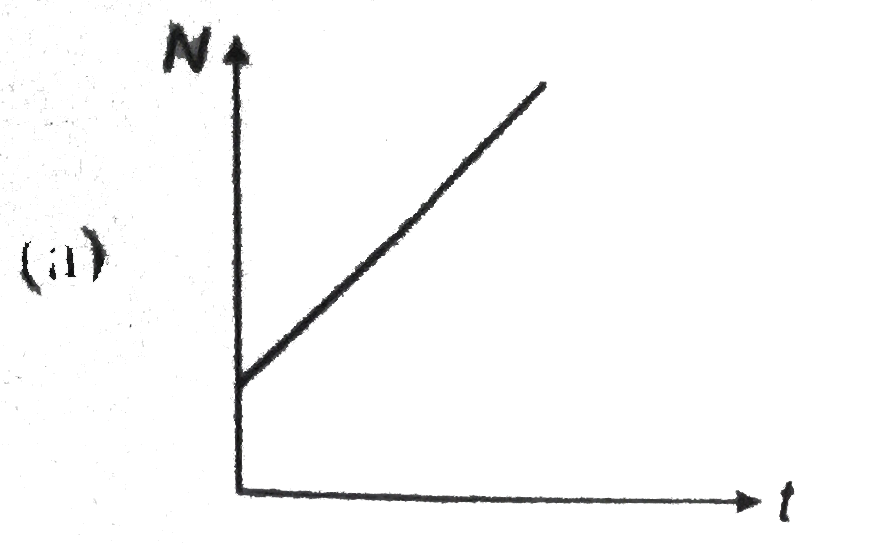 B
B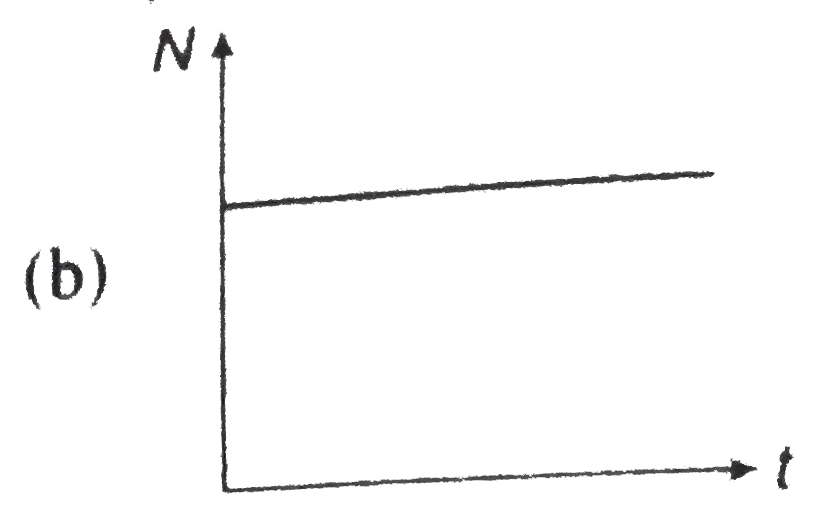 C
C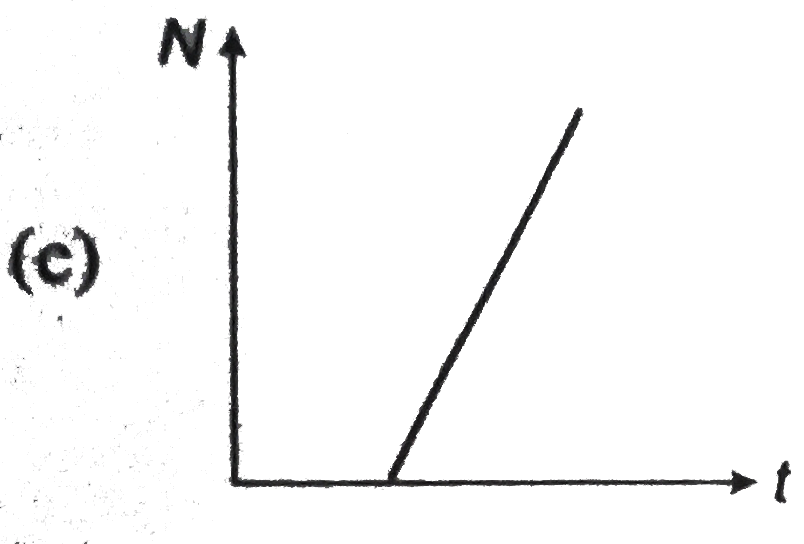 D
D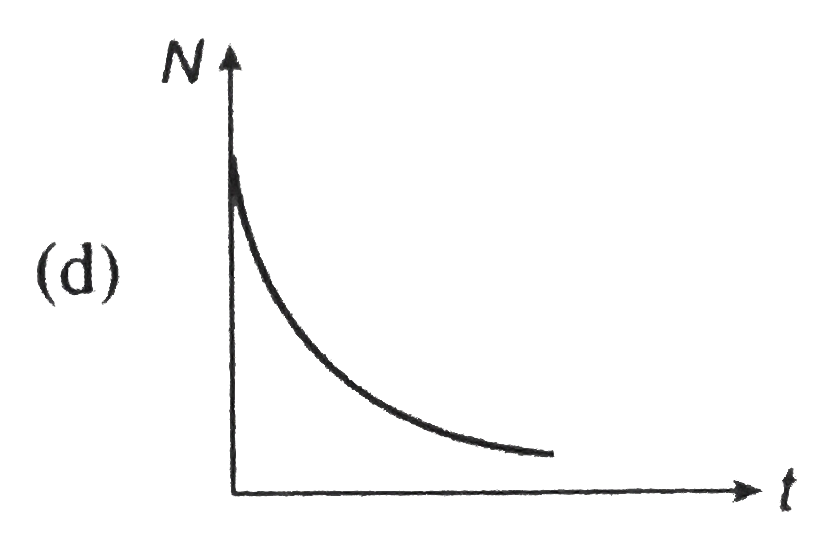
The rate of decay of radioactive element
Ais constantBdecreases inversely with timeCincreases directly with timeDdecreases exponentially with time99% of a radioactive element will decay between
A6 and 7 half-livesB7 and 8 half-livesC8 and 9 half-livesD9 half-lives
The graph between remaining radioactive atoms and time for a radioactive decay is
View SolutionThe plot of the number (N) of decayed atoms versus activity (R) of a radioactive substance is
View SolutionRate of radiocative decay for a radioactive element depends on :
View SolutionThe decay constant of a radioactive element is definded as the reciprocal of the time interval after which the number of atoms of the radioactive element falls to nearly
View SolutionThe decay constant of a radioactive element is defined as the reciprocal of the time interval after which the number of atoms of the radioactive element falls to neraly
View Solution
