The slope of the curves near origin corresponding to energy distribution and speed distribution for an ideal gas is given by:
A
Both V
B
Both '∞'
C
0','∞' respectively
D
'∞','0' respectively
Video Solution
Text Solution
The correct Answer is:d
|
Answer
Step by step video, text & image solution for The slope of the curves near origin corresponding to energy distribution and speed distribution for an ideal gas is given by: by Chemistry experts to help you in doubts & scoring excellent marks in Class 11 exams.
Updated on:21/07/2023
Topper's Solved these Questions
Similar Questions
Knowledge Check
- Question 1 - Select One
Following curves are plotted according to Maxwell distribution of molecular speed.
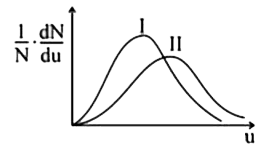 AFor He gas, temperature corresponding to I curve is higher than II curve.BAt same temperature, I and II curve may represent N2andO2 gas respectively.CFraction of molecules having Umps is more in curve I than curve II.DI and II curve may represent O2(g) at 300 K and SO2(g) at 500 K respectively.
 - Question 2 - Select One or More
Which of the following graphs regarding Maxwell distribution of speed are correct for ideal gases ?
A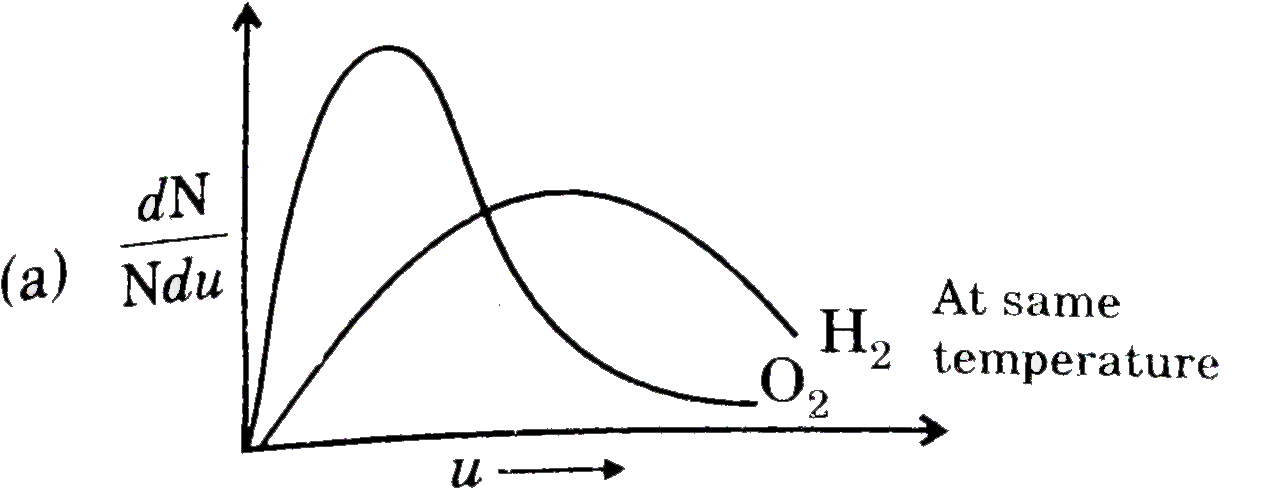 B
B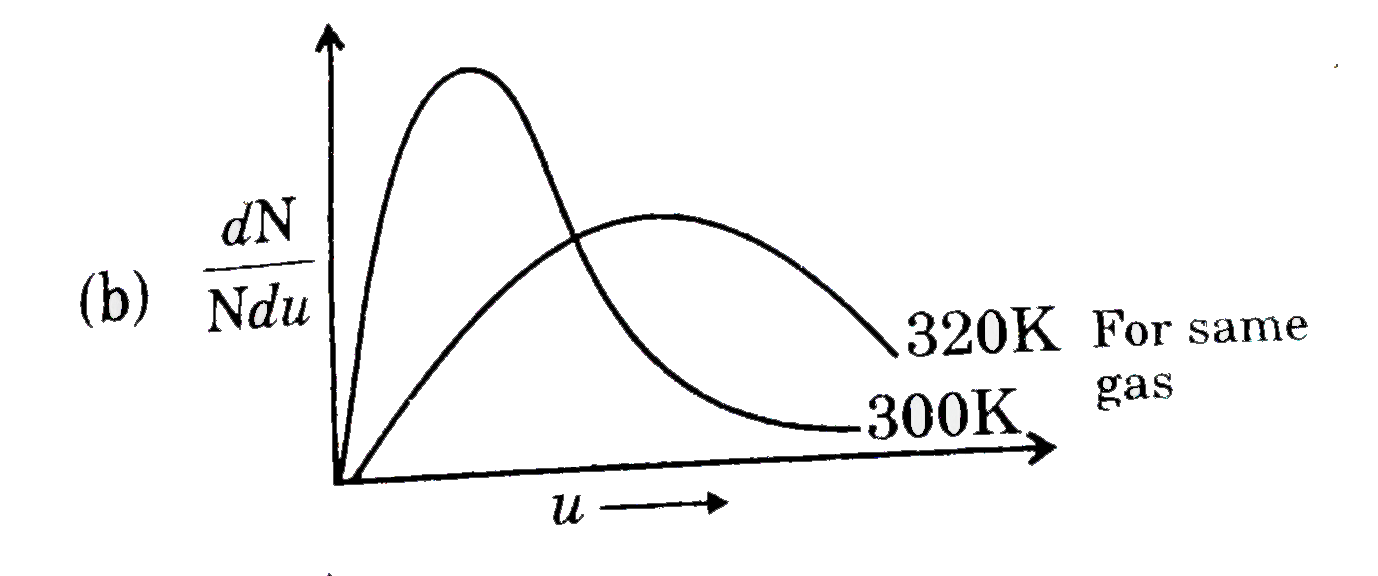 C
C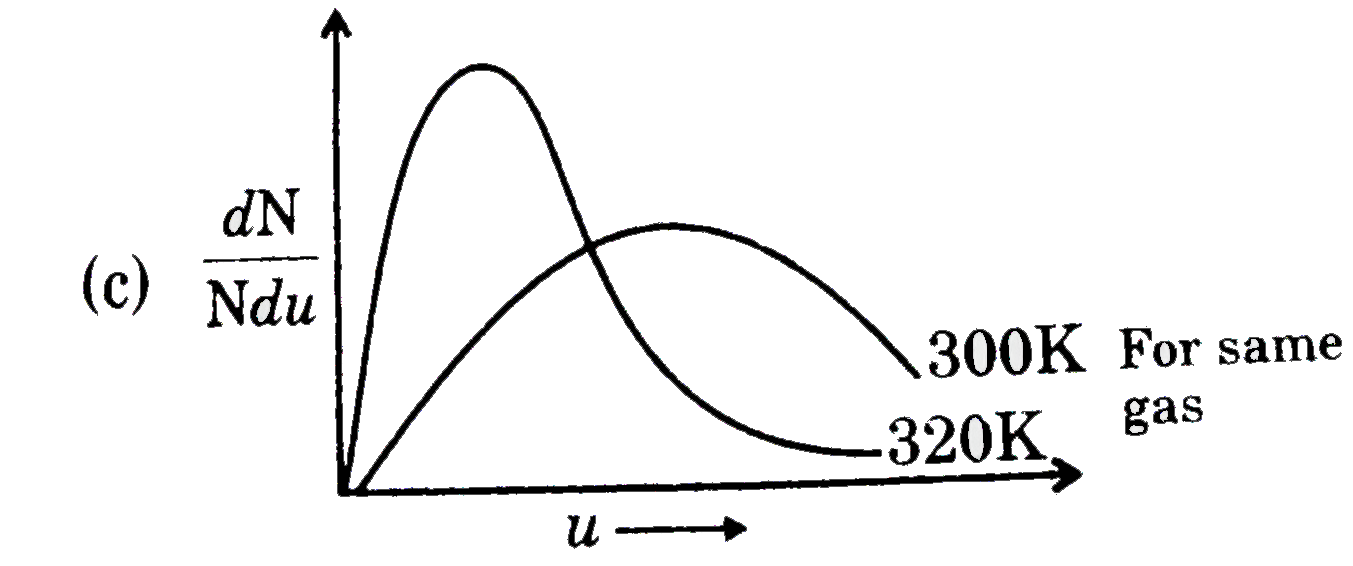 D
D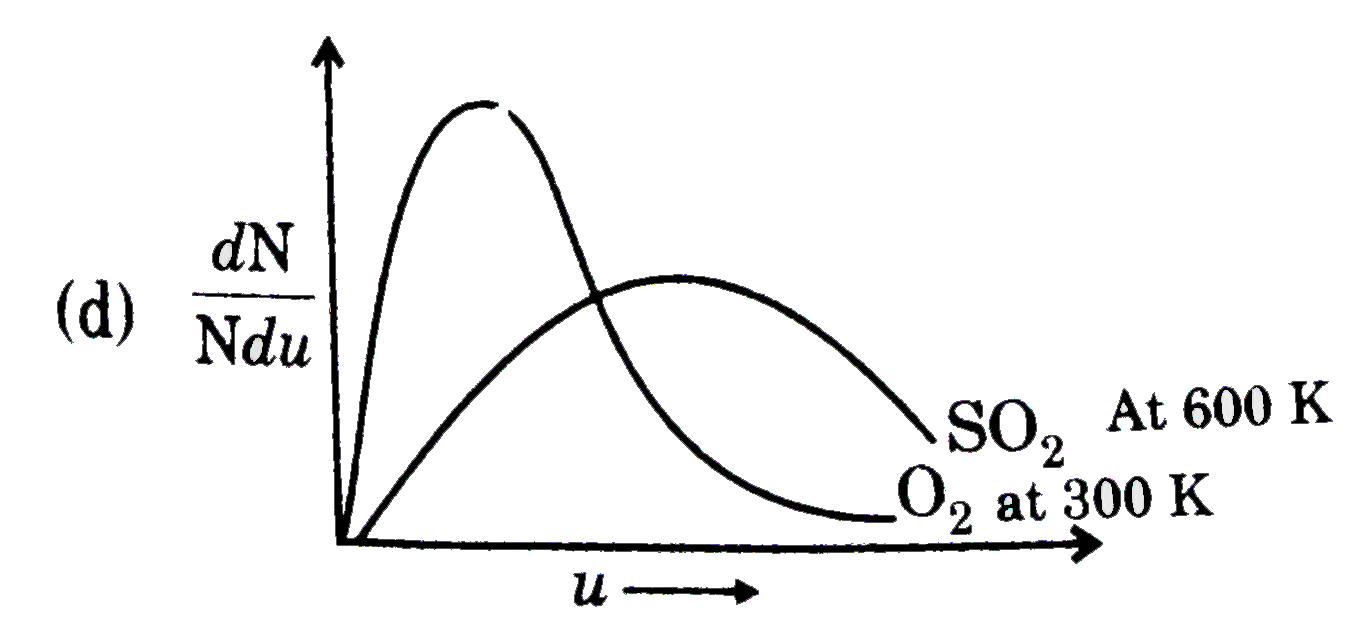
- Question 3 - Select One or More
According to Maxwell Boltzmann distribution of energy
Athe fraction of molecules with most probable kinetic energy decrease at higher temperaturesBthe fraction of molecules with most probable kinetic energy increases at higher temperaturesCmost probable kinetic energy decreases at higher temperaturesDmost probable kinetic energy decreases at higher temperatures.
Why is the energy distribution of β rays continuous?
View SolutionPotential due to continuous charge distribution and self energy
View SolutionFor the given frequency distribution find the median.
 View Solution
Given the distribution of 29 skull bones .
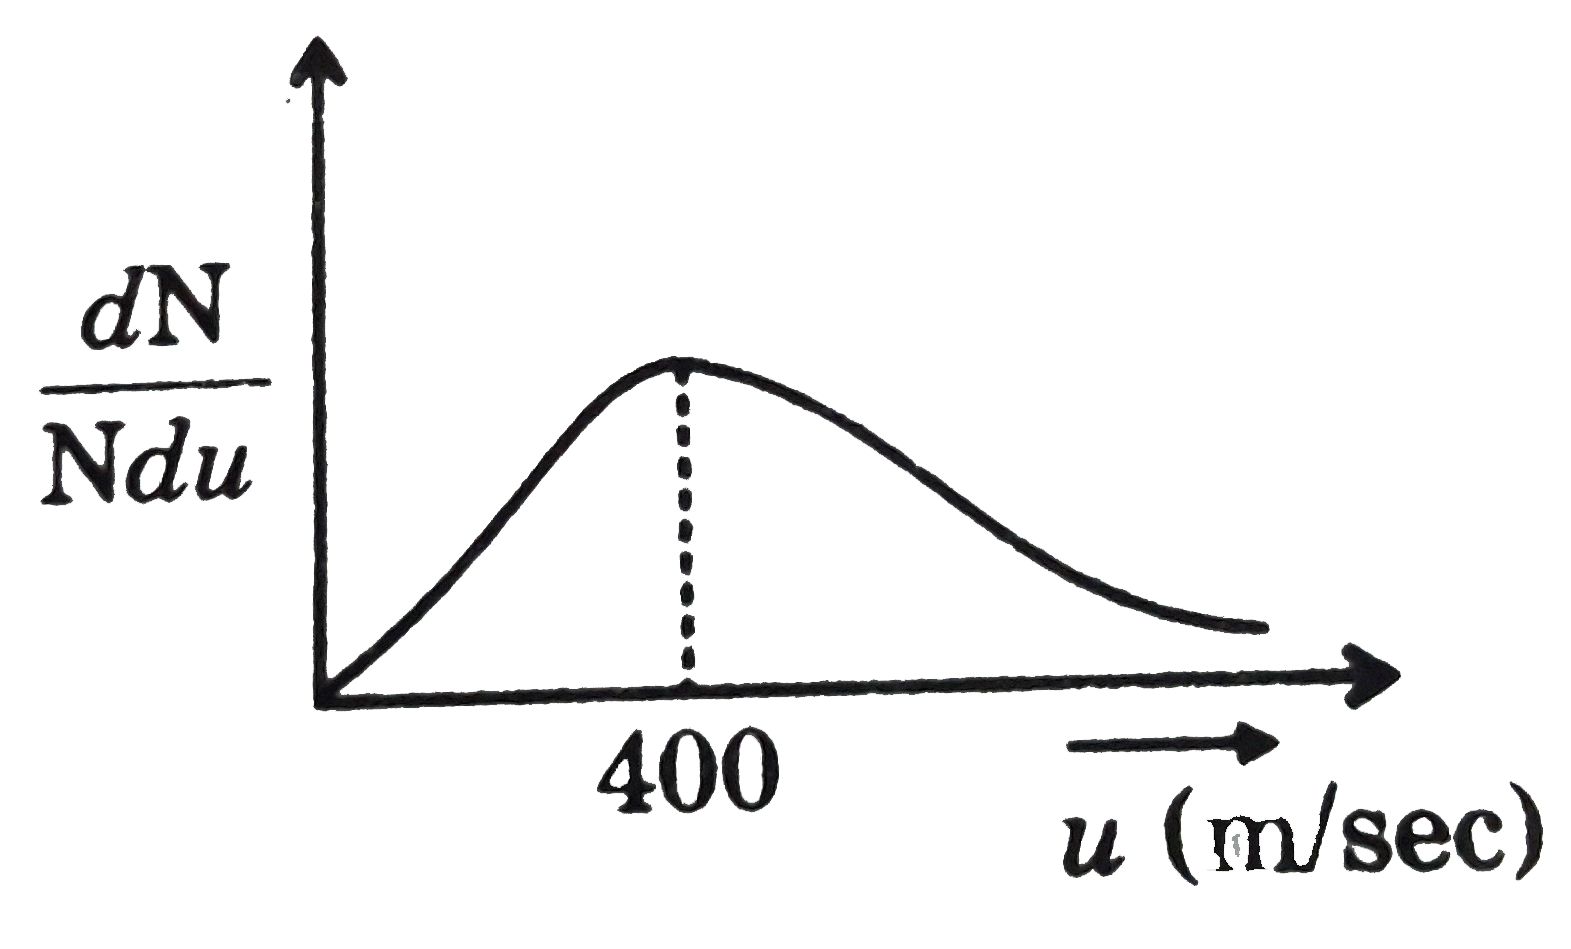
View SolutionFor ideal gas, observation as per Maxwell distribution
 View Solution

