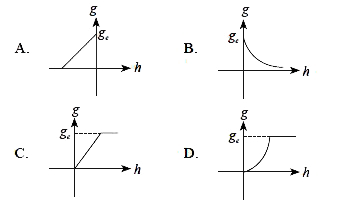
Assuming the earth to have a constant density, point out which of the following curves show the variation of acceleration due to gravity from the centre of earth to the points far away from the surface of earth
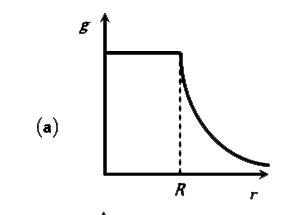
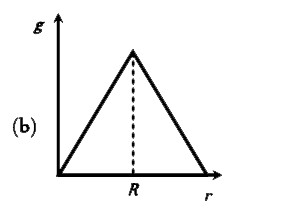
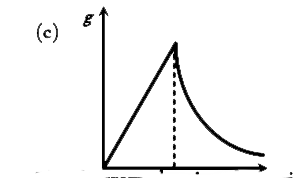

The correct Answer is:C
To solve the problem of how the acceleration due to gravity varies from the center of the Earth to points far away from its surface, we can break it down into several steps:
Step 1: Understand the behavior of gravity inside the Earth
Inside the Earth, assuming a constant density, the acceleration due to gravity (g') varies linearly with distance (d) from the center. The formula for this variation is:
g′=g(1−dR)
where:
- g is the acceleration due to gravity at the surface,
- R is the radius of the Earth,
- d is the distance from the center.
Step 2: Analyze the gravity at the center of the Earth
At the center of the Earth (d = 0), the acceleration due to gravity is:
g′=g(1−0R)=0
So, at the center, the acceleration due to gravity is zero.
Step 3: Determine the behavior of gravity at the surface of the Earth
At the surface of the Earth (d = R), the acceleration due to gravity is:
g′=g(1−RR)=g(1−1)=0
Thus, as we move from the center to the surface, the acceleration due to gravity increases from 0 to g.
Step 4: Analyze the behavior of gravity outside the Earth
Once we are outside the Earth, the acceleration due to gravity (g'') decreases with the square of the distance from the center of the Earth. The formula is:
g′′=g(1+hR)2
where:
- h is the height above the surface of the Earth.
Step 5: Combine the results to visualize the graph
- From the center to the surface, the graph will show a linear increase from 0 to g.
- Beyond the surface, the graph will show a decrease as h increases, following the inverse square law.
Conclusion
Based on the analysis, the correct curve that represents the variation of acceleration due to gravity from the center of the Earth to points far away from its surface is the one that shows a linear increase to g at the surface and then a decrease as we move away from the surface.
Final Answer
The correct option is C.
Inside the Earth, assuming a constant density, the acceleration due to gravity (g') varies linearly with distance (d) from the center. The formula for this variation is:
g′=g(1−dR)
where:
- g is the acceleration due to gravity at the surface,
- R is the radius of the Earth,
- d is the distance from the center.
At the center of the Earth (d = 0), the acceleration due to gravity is:
g′=g(1−0R)=0
So, at the center, the acceleration due to gravity is zero.
At the surface of the Earth (d = R), the acceleration due to gravity is:
g′=g(1−RR)=g(1−1)=0
Thus, as we move from the center to the surface, the acceleration due to gravity increases from 0 to g.
Once we are outside the Earth, the acceleration due to gravity (g'') decreases with the square of the distance from the center of the Earth. The formula is:
g′′=g(1+hR)2
where:
- h is the height above the surface of the Earth.
- From the center to the surface, the graph will show a linear increase from 0 to g.
- Beyond the surface, the graph will show a decrease as h increases, following the inverse square law.
Based on the analysis, the correct curve that represents the variation of acceleration due to gravity from the center of the Earth to points far away from its surface is the one that shows a linear increase to g at the surface and then a decrease as we move away from the surface.
The correct option is C.
Topper's Solved these Questions
- GRAVITATIONBook:ERRORLESS Chapter:GRAVITATIONExercise:Assertion and Reasons
Explore 33 Videos
- GRAVITATIONBook:ERRORLESS Chapter:GRAVITATIONExercise:SET
Explore 27 Videos
- GRAVITATIONBook:ERRORLESS Chapter:GRAVITATIONExercise:CT
Explore 18 Videos
- FRICTIONBook:ERRORLESS Chapter:FRICTIONExercise:MCQ S
Explore 125 Videos
- MOTION IN ONE DIMENSIONBook:ERRORLESS Chapter:MOTION IN ONE DIMENSIONExercise:Motion In One Dimension
Explore 24 Videos
Similar Questions
Knowledge Check
Acceleration due to gravity at the centre of the earth is :-
AgBg2CzeroDinfiniteWhich of the following graphs shows the variation of acceleration due to gravity g with depth h from the surface of the earth ?
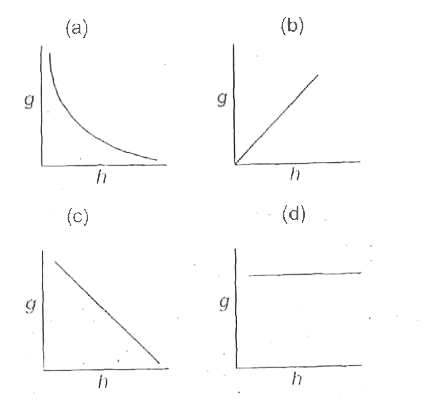 A(a)B(b)C(c )D(d)
The graph showing acceleration due to gravity of the earth from the center of the earth is
A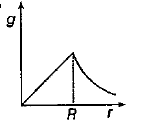 B
B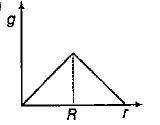 C
C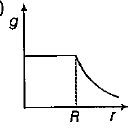 D
D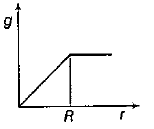
Draw graphs showing the variation of acceleration due to gravity with depth below the earth's surface.
View SolutionDraw graphs showing the variation of acceleration due to gravity with depth below the earth's surface.
View SolutionWhich of the following graphs shows an approximate variation of acceleration due to gravity g with height h above the Earth's surface?
View SolutionThe acceleration due to gravity is …………….. at the surface of earth and ………………… is at the centre of earth.
View SolutionAt the centre of earth the acceleration due to gravity is
View Solution

