Which of the following curve represent variation of density of water with temperature best-
A

B

C

D

Video Solution
Text Solution
The correct Answer is:A
|
Answer
Step by step video, text & image solution for Which of the following curve represent variation of density of water with temperature best- by Physics experts to help you in doubts & scoring excellent marks in Class 11 exams.
Updated on:21/07/2023Topper's Solved these Questions
- THERMOMETRY, THERMAL EXPANSION AND CALORIMETRY BOOK - ERRORLESS CHAPTER - THERMOMETRY, THERMAL EXPANSION AND CALORIMETRY EXERCISE - Assertion & Reason
14 Videos
- THERMOMETRY, THERMAL EXPANSION AND CALORIMETRY BOOK - ERRORLESS CHAPTER - THERMOMETRY, THERMAL EXPANSION AND CALORIMETRY EXERCISE - Self Evaluation Test
15 Videos
- THERMOMETRY, THERMAL EXPANSION AND CALORIMETRY BOOK - ERRORLESS CHAPTER - THERMOMETRY, THERMAL EXPANSION AND CALORIMETRY EXERCISE - Critical Thinking
27 Videos
- THERMODYNAMICSBOOK - ERRORLESS CHAPTER - THERMODYNAMICSEXERCISE - All Questions
304 Videos
- TRANSMISSION OF HEATBOOK - ERRORLESS CHAPTER - TRANSMISSION OF HEATEXERCISE - ET Self Evaluation Test
23 Videos
Similar Questions
Knowledge Check
which of the following graph represents the variation of resistivity (ρ) with temperature (T) for copper?
A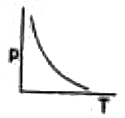 B
B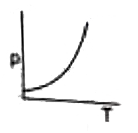 C
C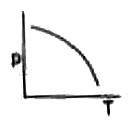 D
D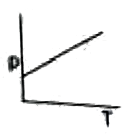
Which of the following curves represent the Henry's law
A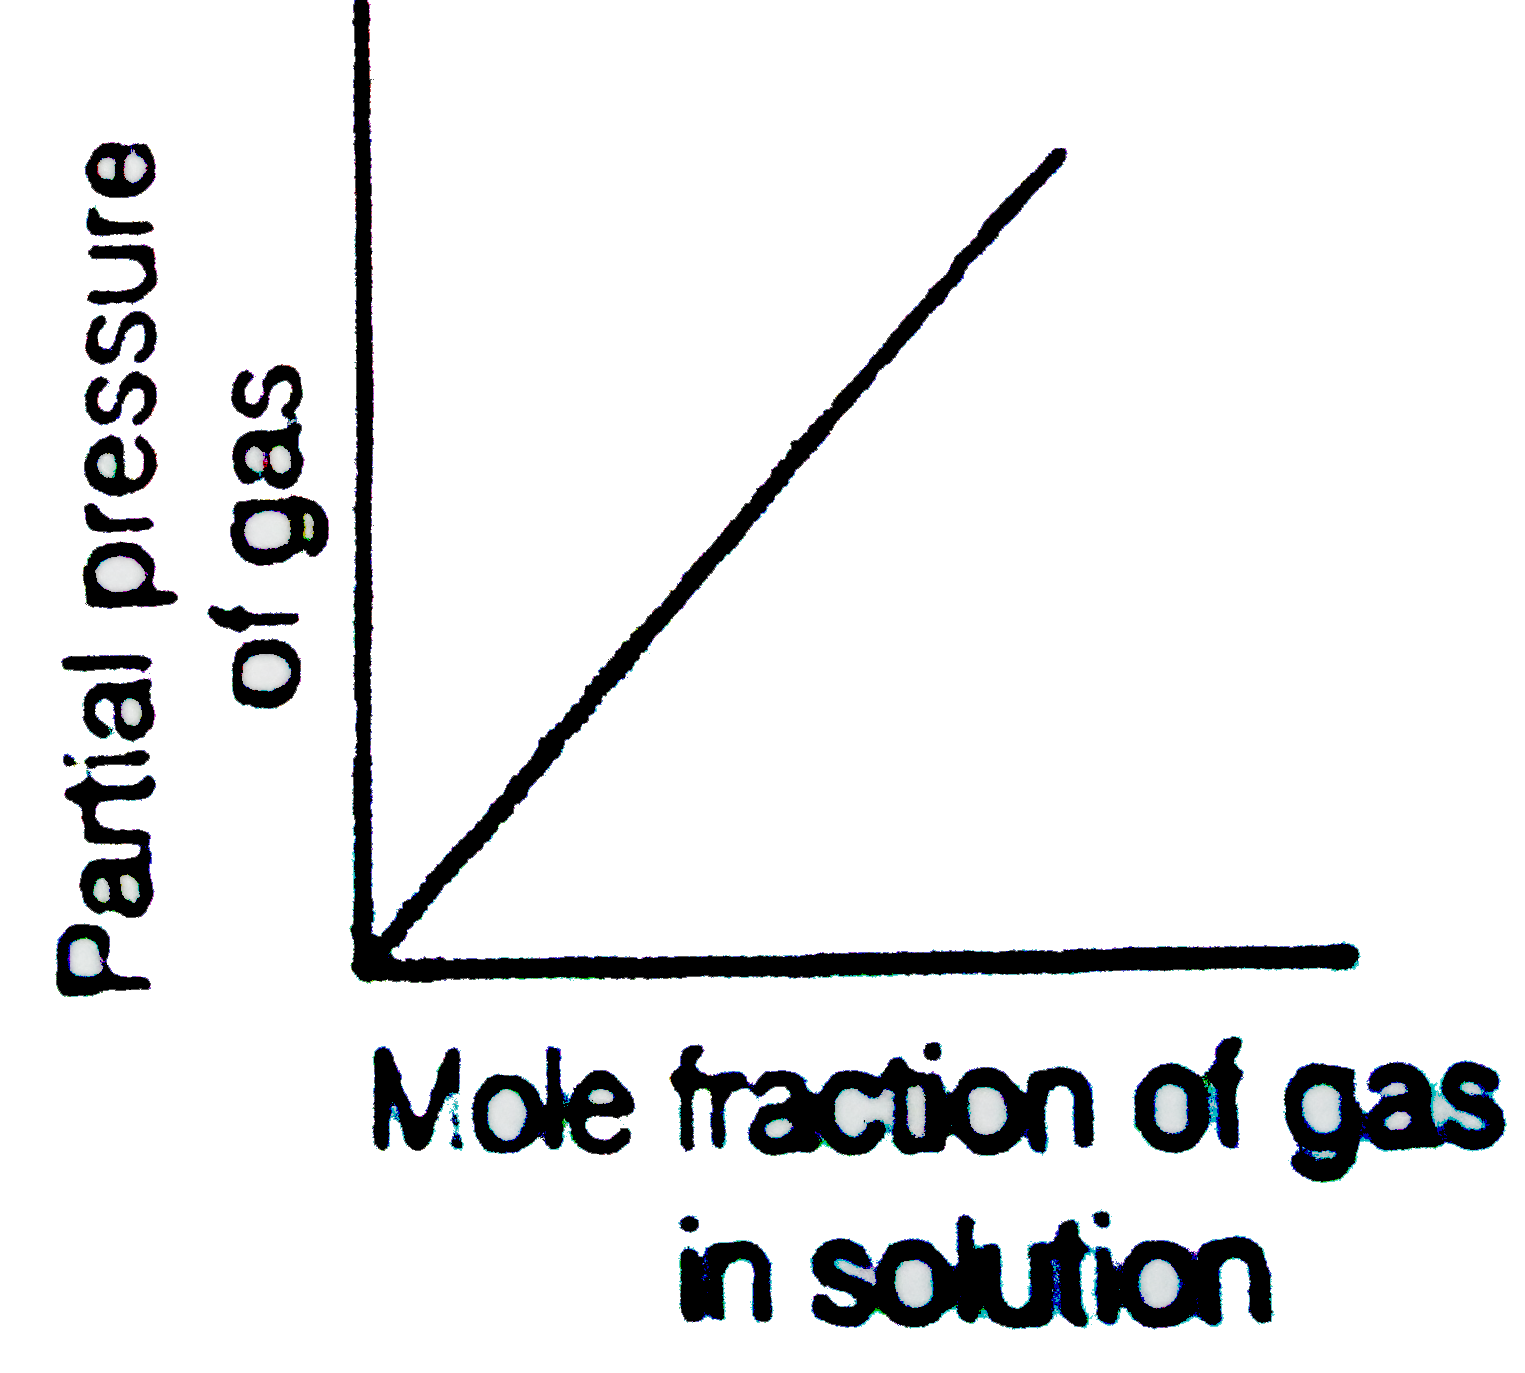 B
B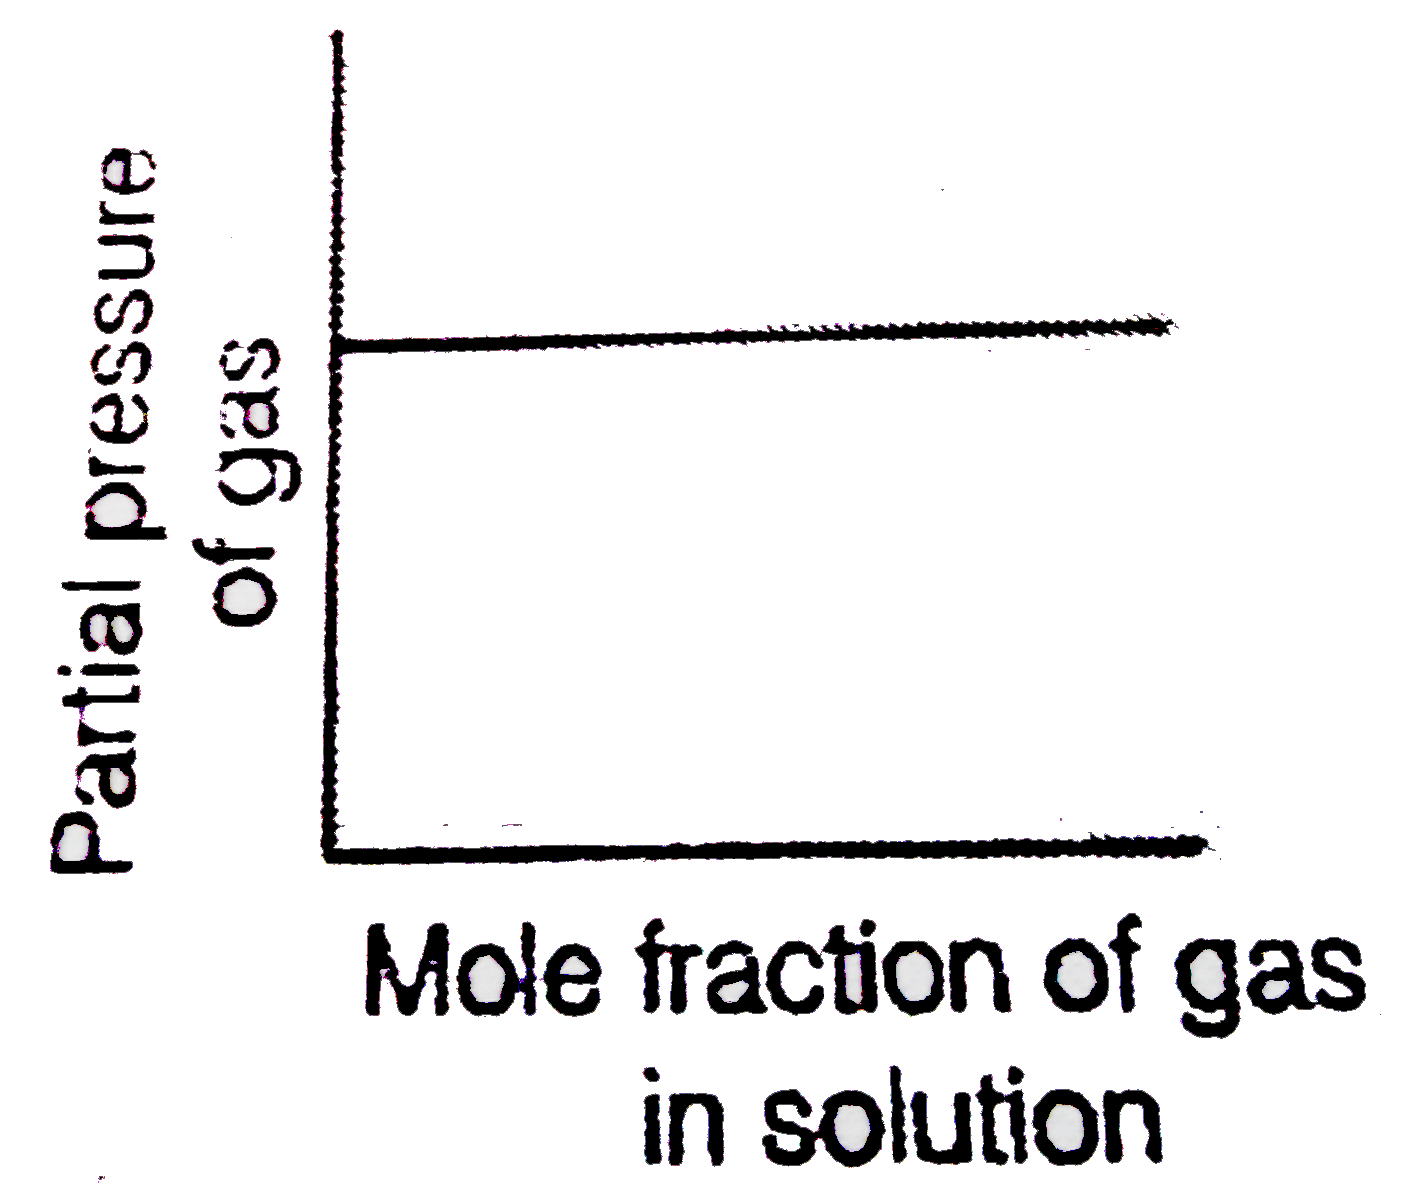 C
C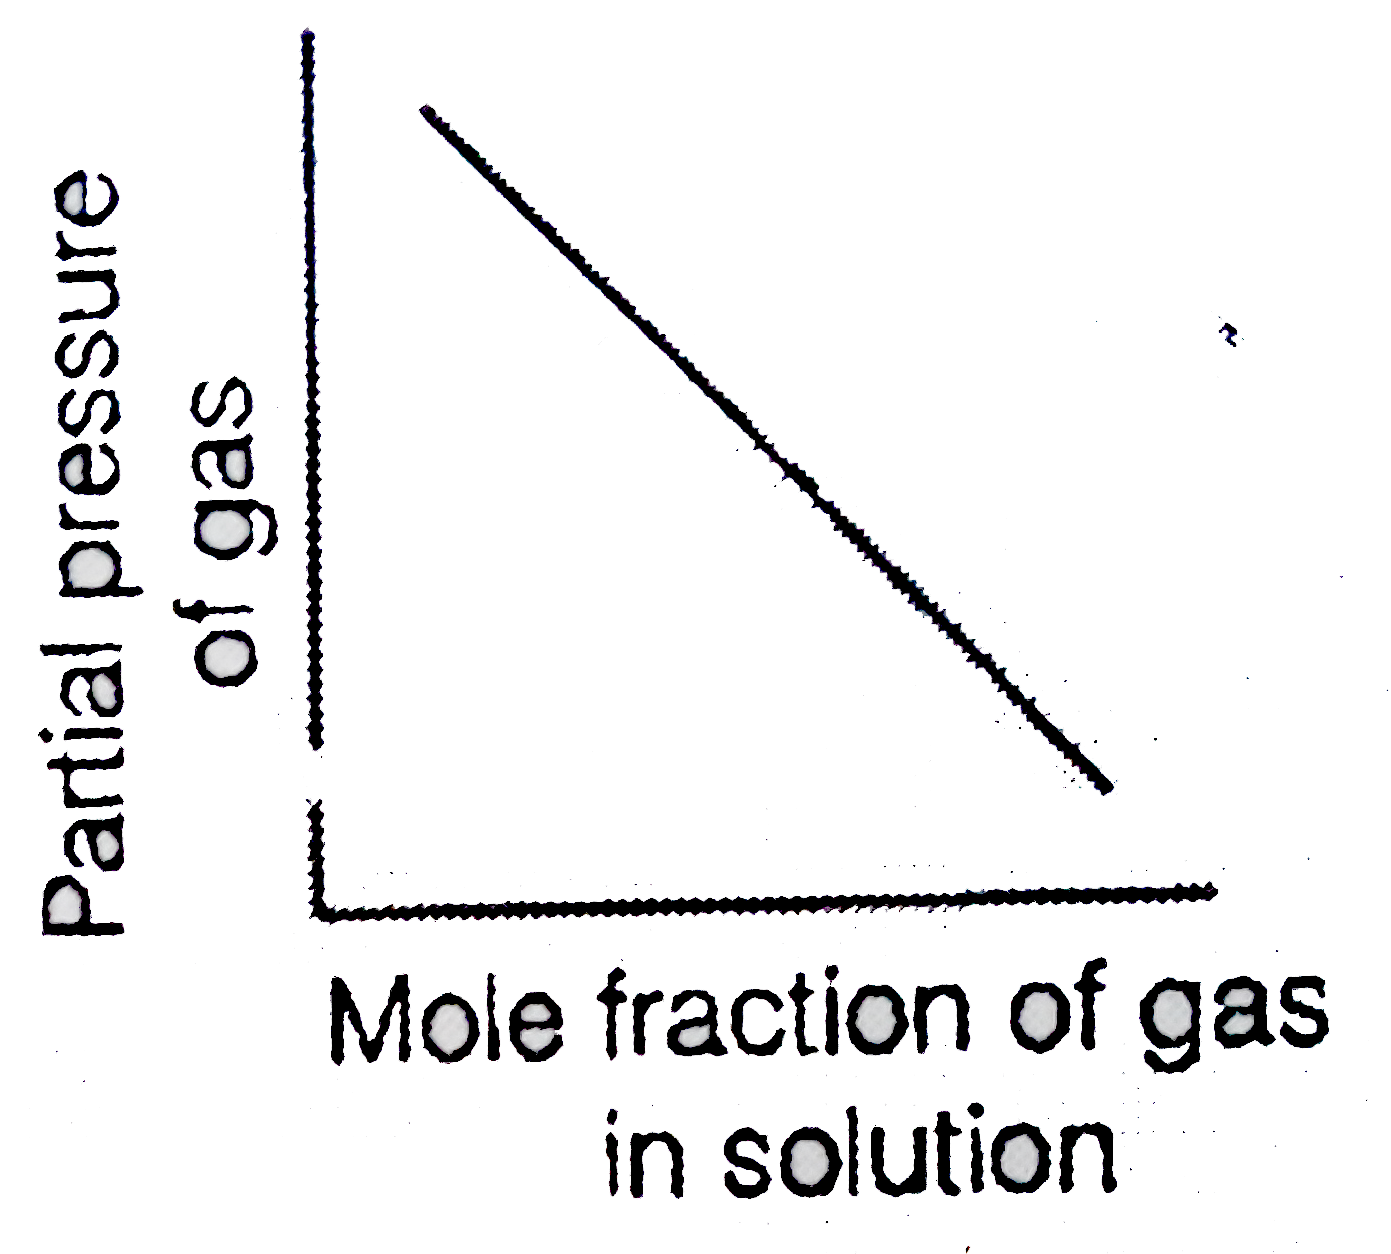 D
D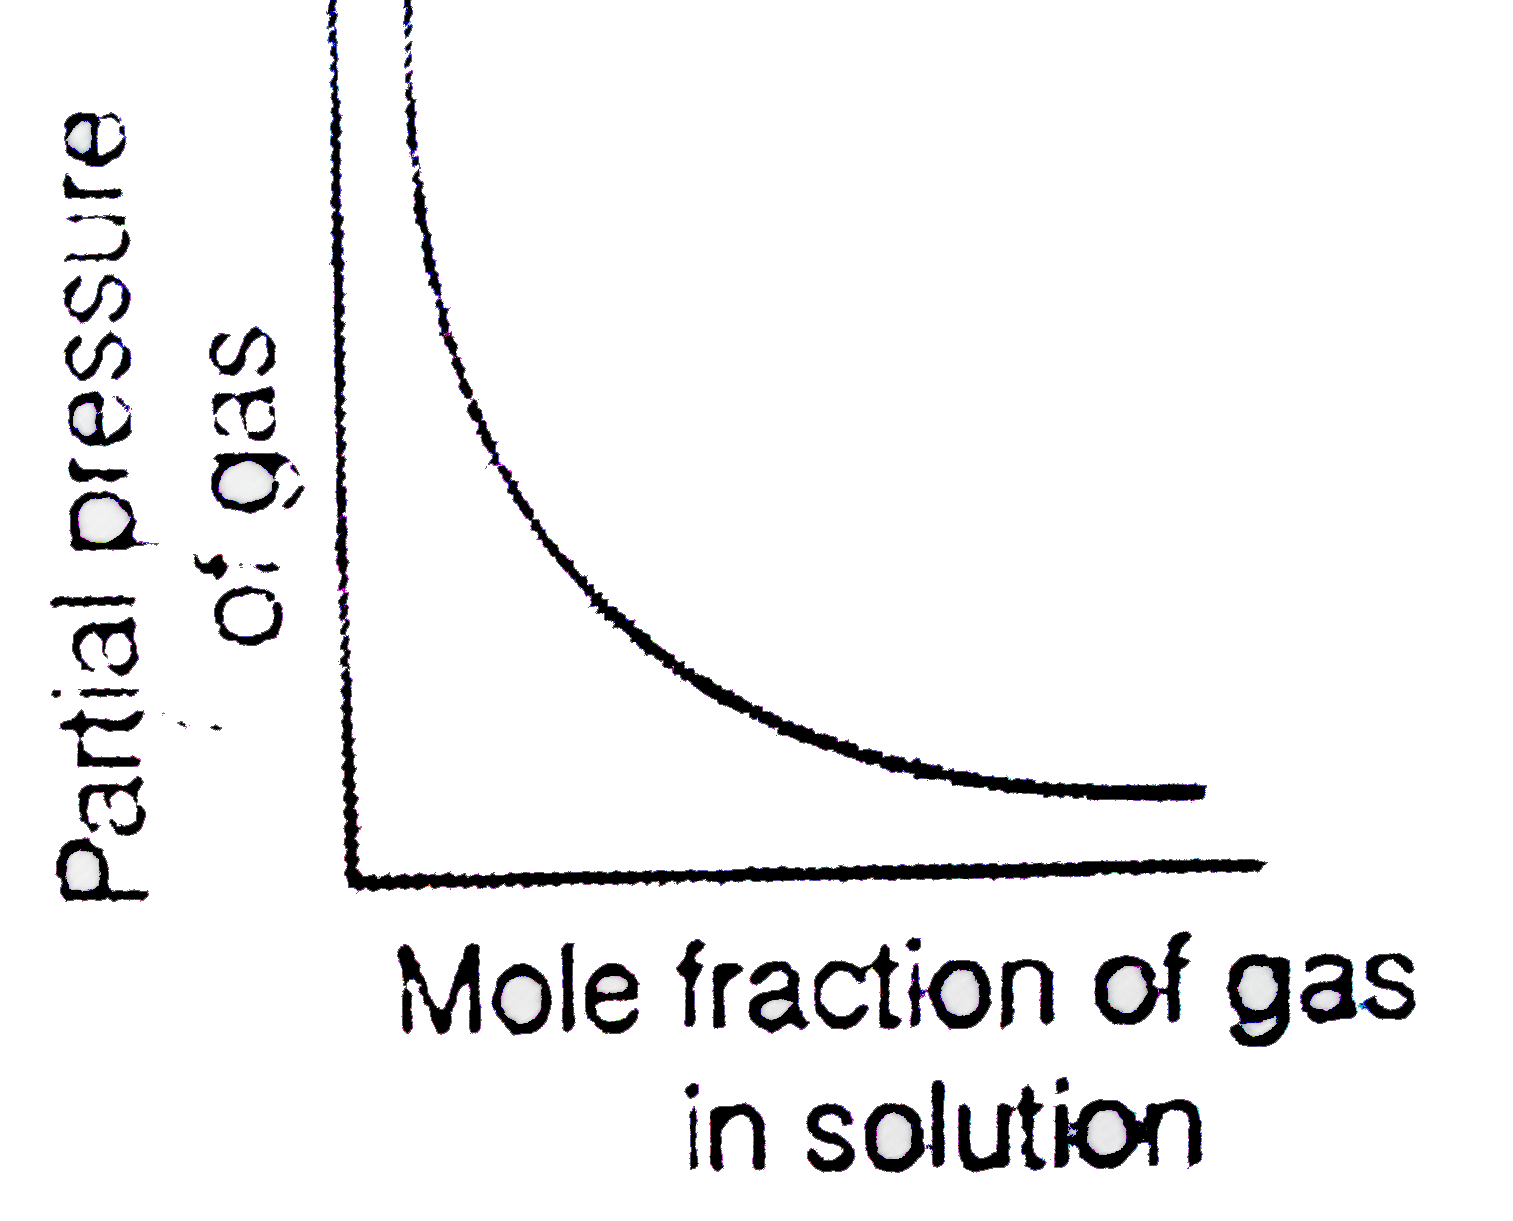
Which of the following graphs shows variation between density of water and temperature?
A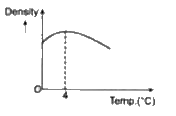 B
B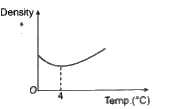 C
C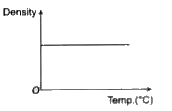 D
D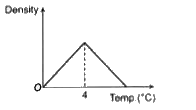
Which of the following curves represents the Henry's law ?
View SolutionWhich of the following graph shows the variationi of density of water increase in temperature ?
View SolutionWhich of the following curves represents the Henry's law ?
View SolutionWhich of the following curves represents a third order reaction ?
View SolutionWhich of the following curves represents a first order reaction.
View Solution