In the graph, point indicates
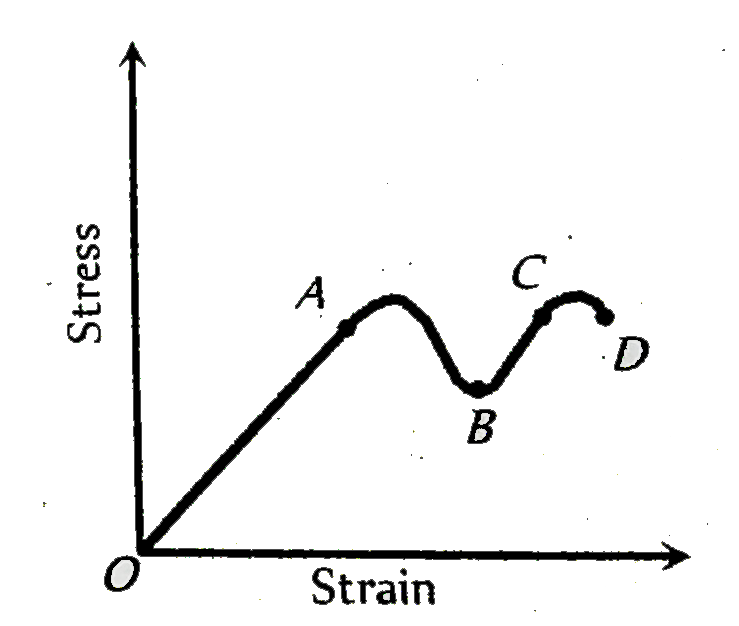
Limiting point
Yield point
Breaking point
None of the above
The correct Answer is:C
Step by step video, text & image solution for In the graph, point D indicates by Physics experts to help you in doubts & scoring excellent marks in Class 11 exams.
Updated on:21/07/2023Topper's Solved these Questions
- ELASTICITYBOOK - ERRORLESS CHAPTER - ELASTICITYEXERCISE - Assertion and Reason
12 Videos
- ELASTICITYBOOK - ERRORLESS CHAPTER - ELASTICITYEXERCISE - Self Evaluation Test
11 Videos
- ELASTICITYBOOK - ERRORLESS CHAPTER - ELASTICITYEXERCISE - Critical Thinking
8 Videos
- FLUID MECHANICSBOOK - ERRORLESS CHAPTER - FLUID MECHANICSEXERCISE - Fluid Mechanics
19 Videos
Similar Questions
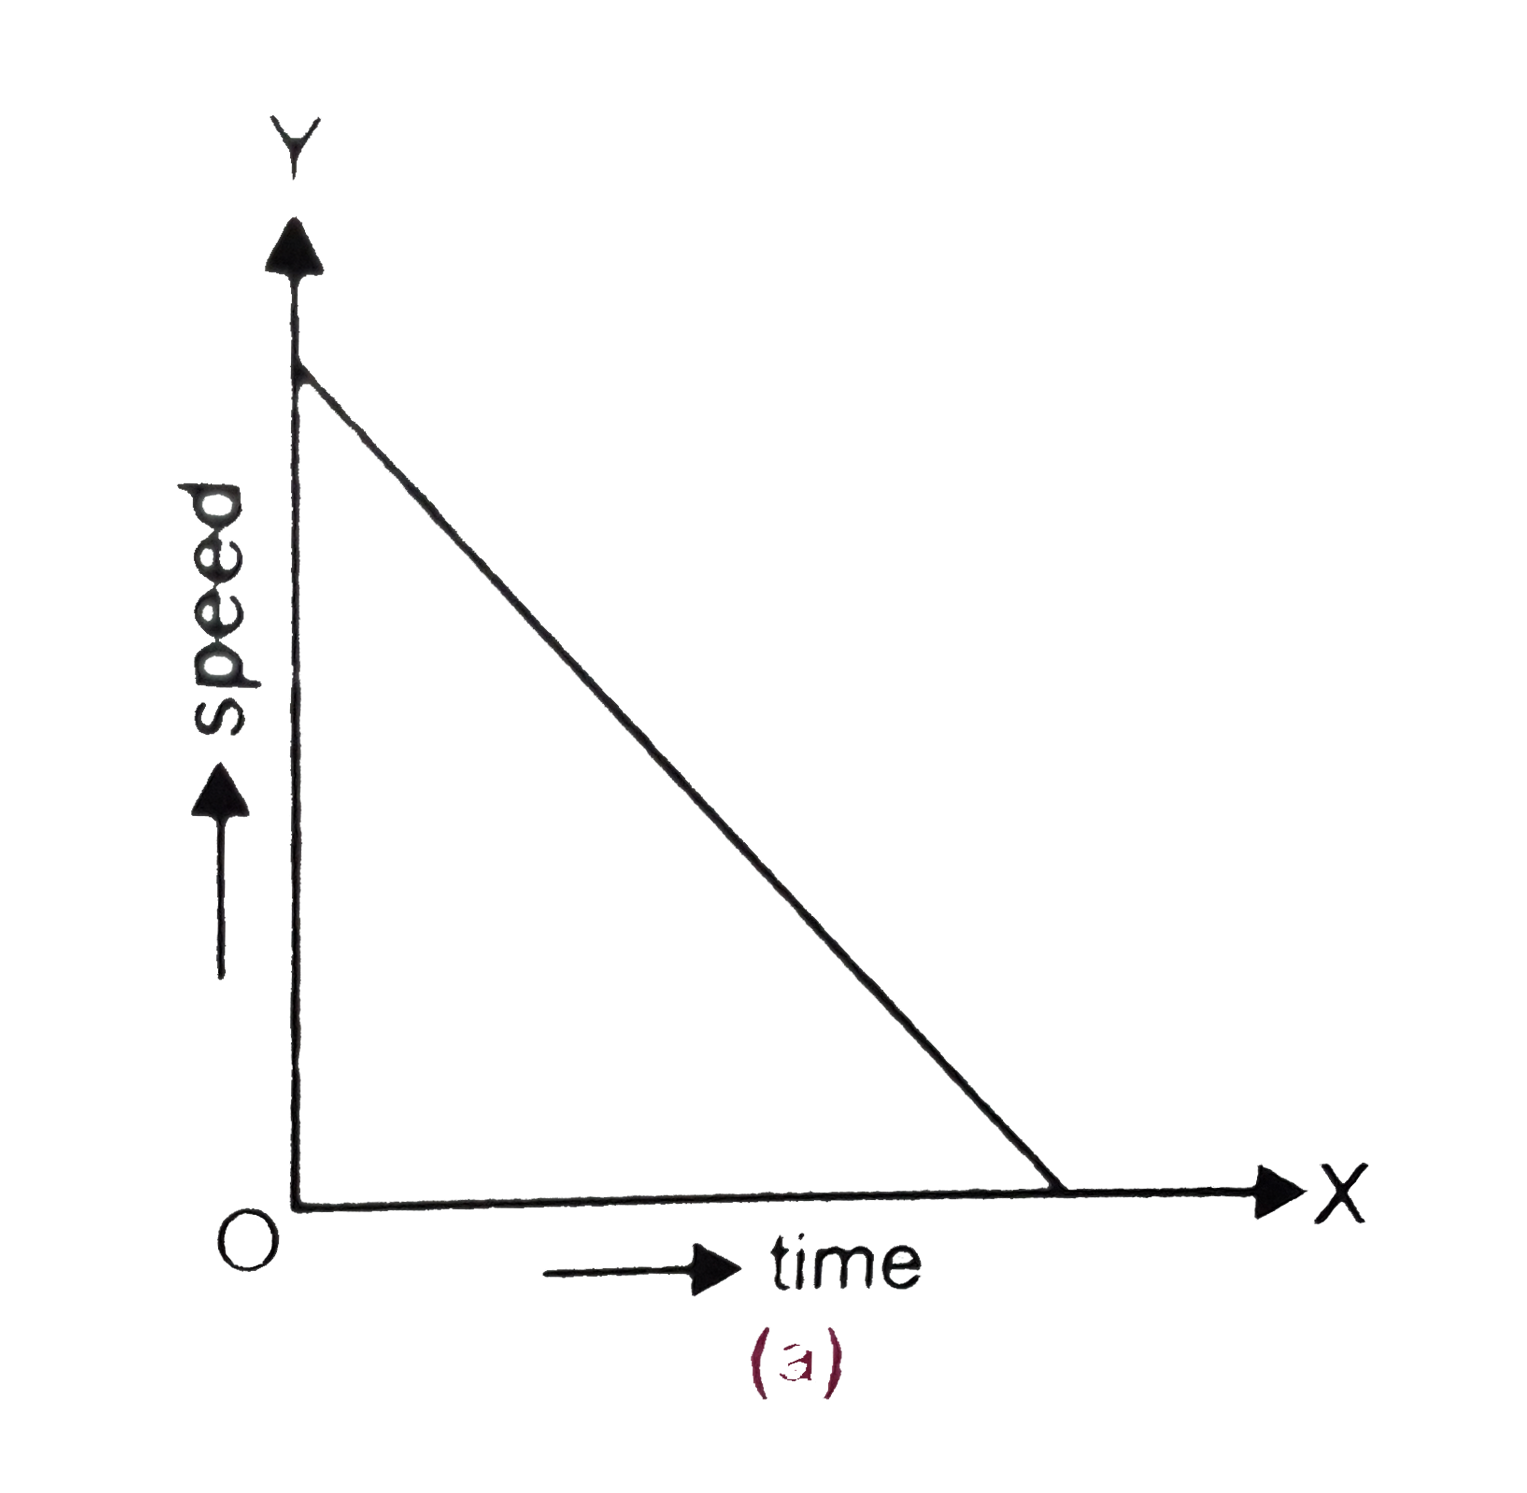
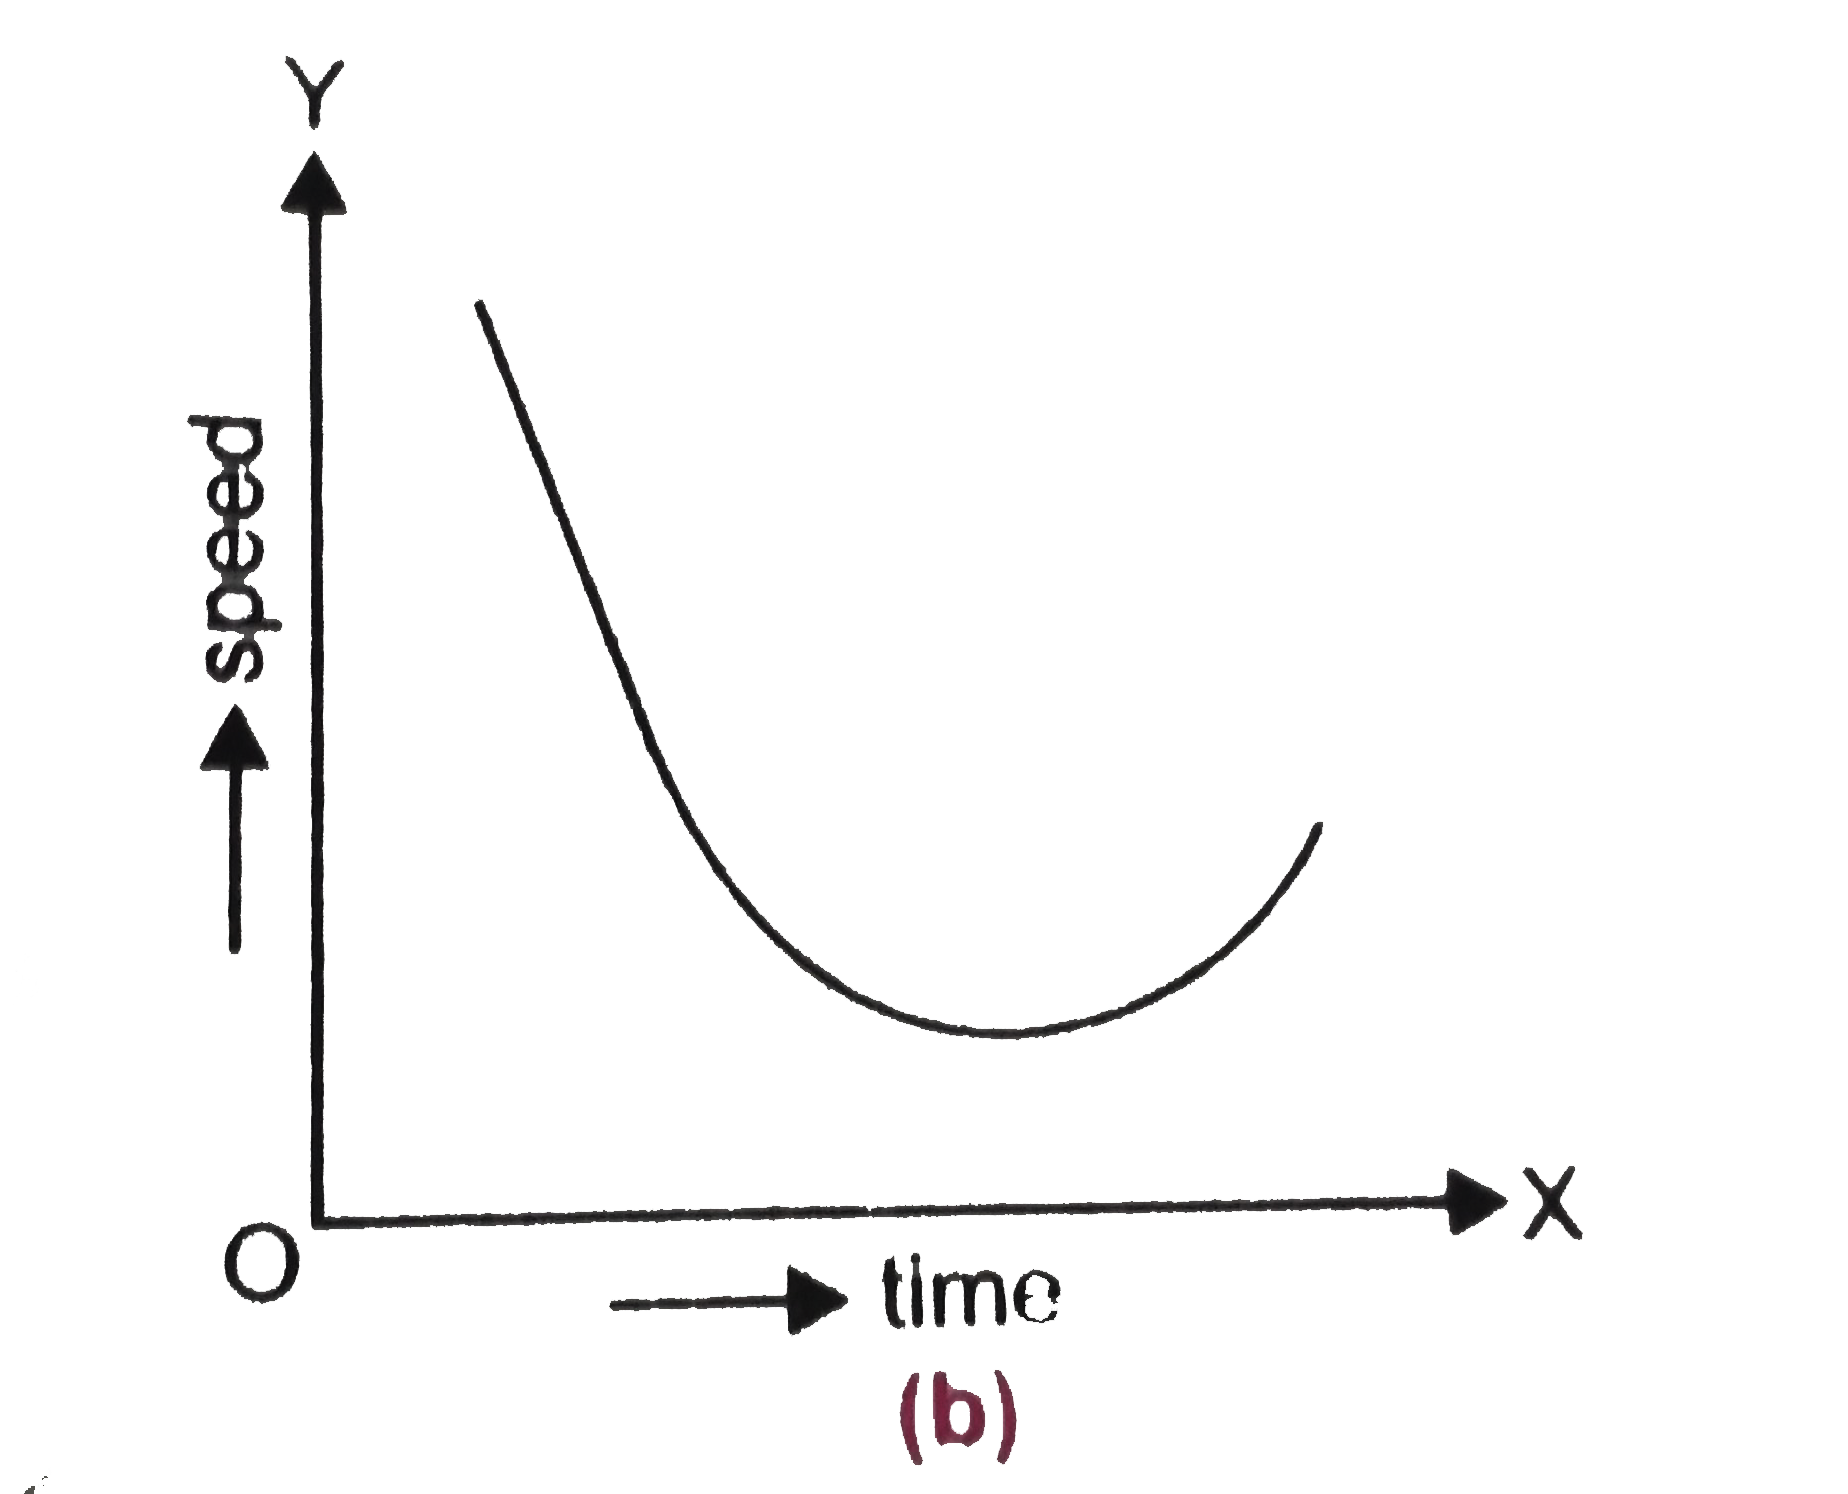
What do the graph shown in Figure indicate ?
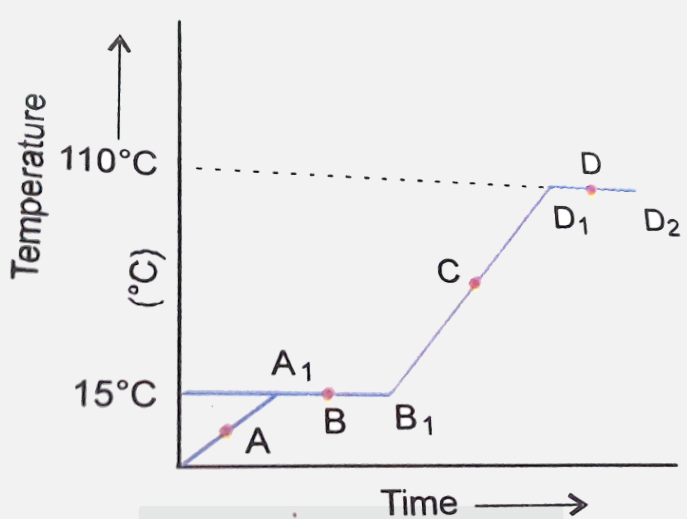
View SolutionThe temperature-time graph below shows the heating curve for pure wax. From the graph answer the following :
(a) What is the physical state of the substance at the points A, B, C and D ?
(b) What is the melting point of the substance ?
(c ) What is its boiling point ?
(d) Which portions of the graph indicates that change of state is taking place.
(e ) Name the terms used for heat absorbed during change of states involved in above processes.
View Solution
Knowledge Check
In the above graph, point D indicates
ALimiting PoointBYield pointCBreaking pointDElastic limitIn the above graph, point B indicates.
ABreaking pointBLimiting pointCYield pointDNone of the aboveIn the above graph, point B indicates
ABreaking pointBLimiting PoointCYield pointDElastic limit
Direction: The bar graph shown below indicate the number of books owned and the number of books issued by the 5 different libraries A, B, C, D, and E. Based on the given bar graph answer the question given below:
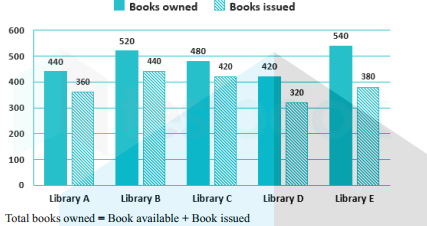
Books available in library D is how much percent of books owned by library B and C together?
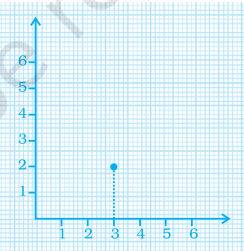
View SolutionIn the given graph the coordinates of point x are
View SolutionFor the above problem, the direction of the gravitational intensity at an arbitrary point P is indicated by the arrow (i) d, (ii), e, (iii) f (iv) g.
View SolutionDirection: The bar graph shown below indicate the number of books owned and the number of books issued by the 5 different libraries A, B, C, D, and E. Based on the given bar graph answer the question given below:
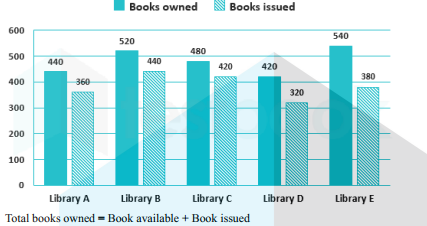
Find the average number of books owned in all 5 library.
View SolutionThe heating curve of a paritcular substance in solid state is as shown in the figure .choose the correct alternative
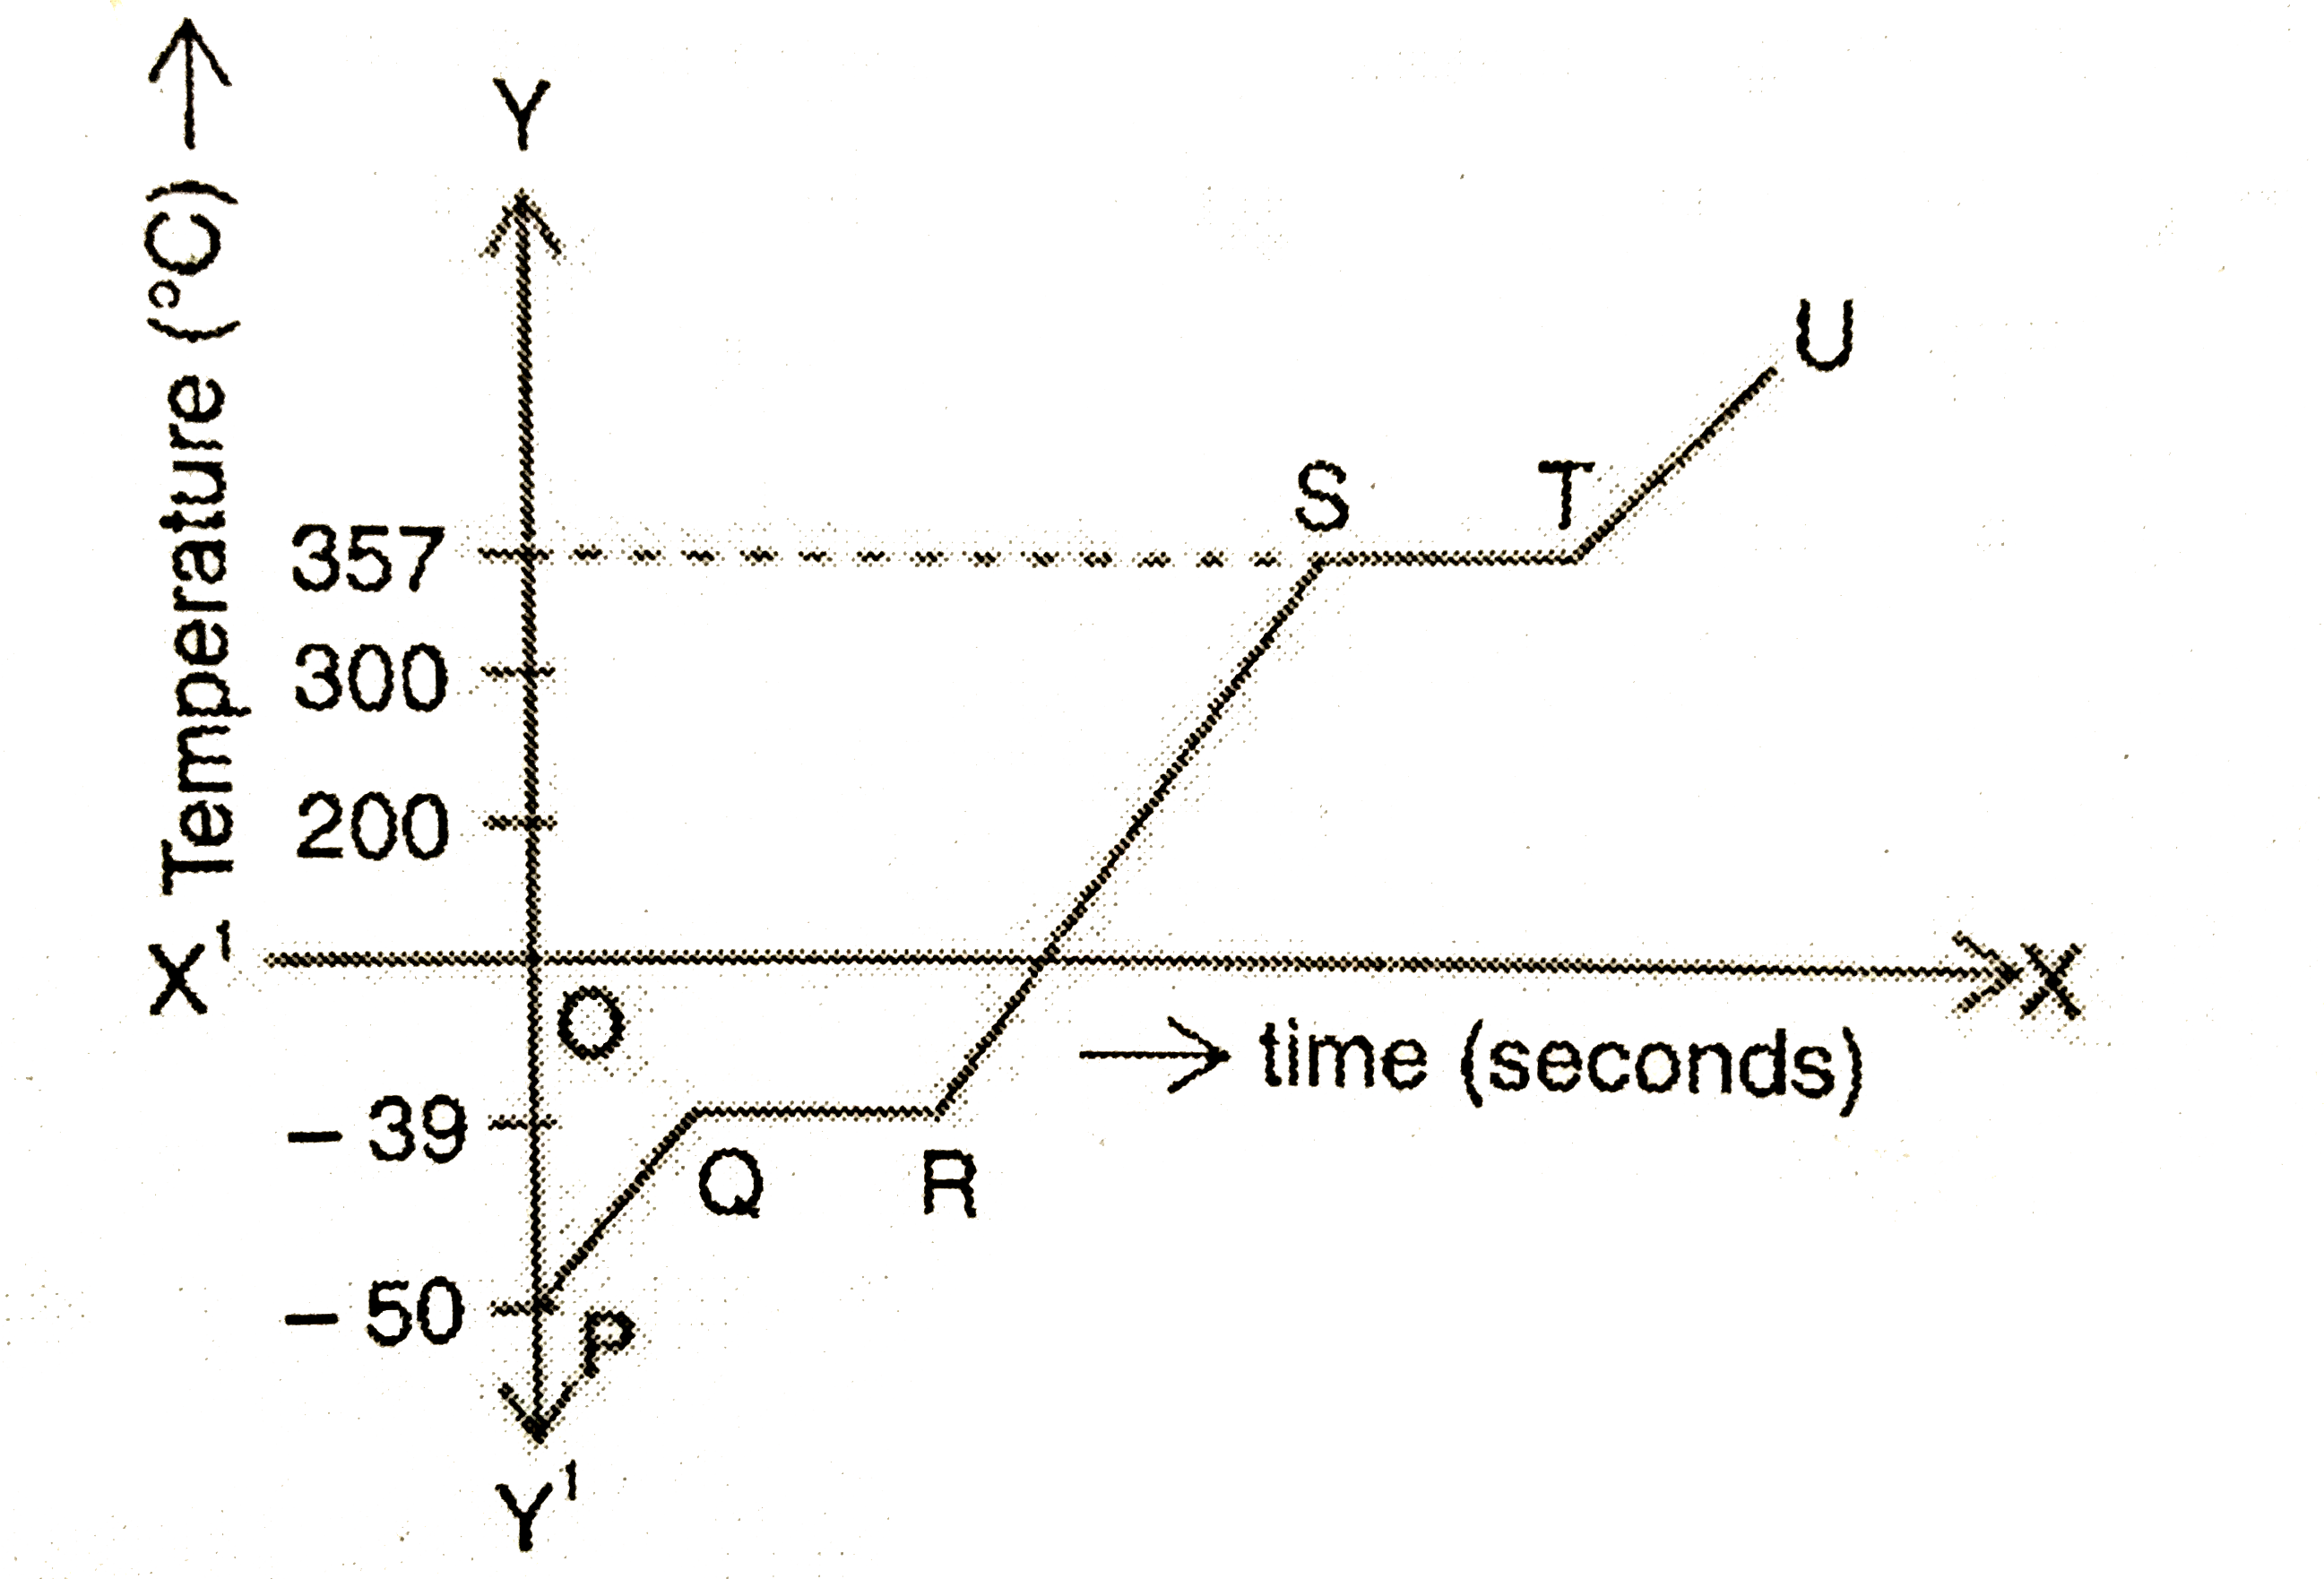
The porition QR of the graph indicates
View Solution
