the curve given below shows wnzymatic acitvity with relation to three conditions (pH , temperature and substrate concentration ).
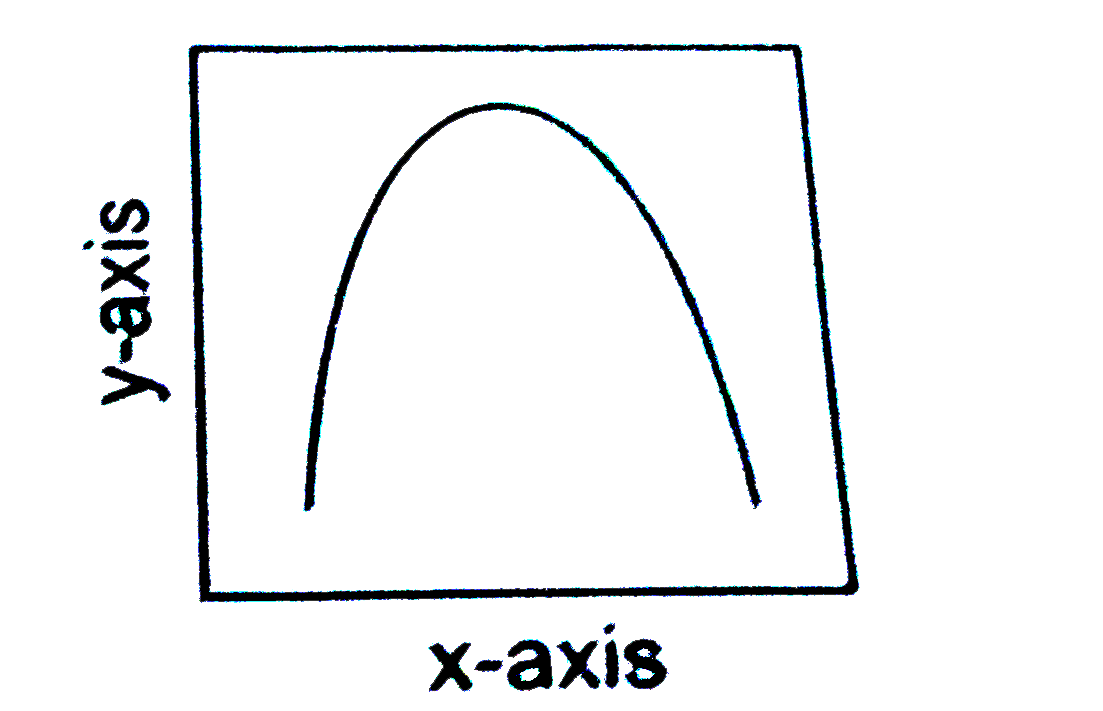
what do the two axes ( x and y) represent ?
X-axisY-axis(a)Enzymatic activityTemperature
X-axisY-axis(b)Enzymatic activitypH
X-axisY-axis(c)TemperatureEnzyme Acitivity
X-axisY-axis(d)Substrate concentrationEnzymatic Activity
The correct Answer is:C
(c) X-axis represent temperature and Y-axis represent enzyme activity. All enxymes act at an optimum temperature, above and below this temperature the enzyme activity declines.
Topper's Solved these Questions
Similar Questions
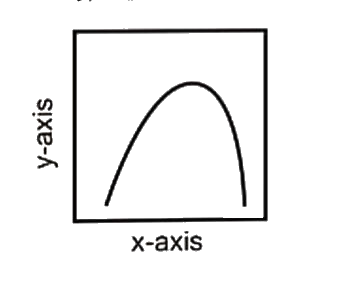
The curve given below shows enzymatic activity with relation to three conditions (pH, temperature and substrate concentration). What does the two axis (x and y) represent ?
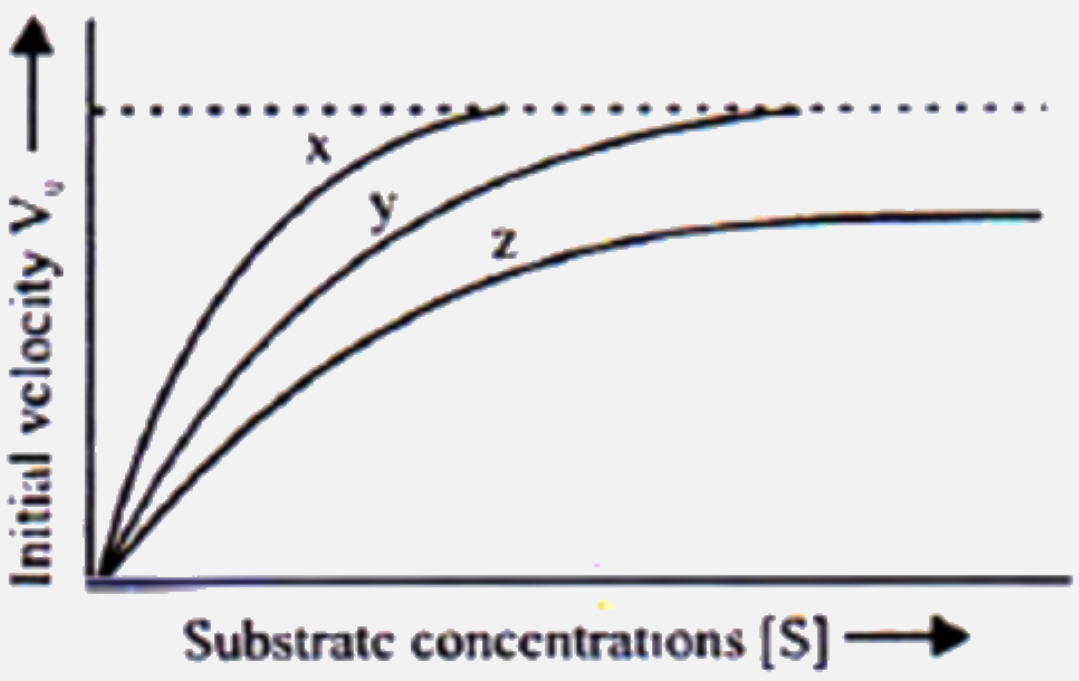
View SolutionThe Given figure shows three velocity-substrate concentration curves of an enzyme reaction. What do the curves X Y and Z depict respectively ?
View Solution
Knowledge Check
The curve given below shows enzymatic activity with relation to three conditions (pH, temperature and substrate concentration). What does the two axis (x and y) represent ?
 AX-axis: Enzymatic activity, Y-axis: pHBX-axis: Temperature, Y-axis: Enzyme activityCX-axis: Substrate concentration, Y-axis: Enzymatic activityDX-axis: Enzymatic activity, Y-axis: Temperature
The curve given show enzymatic activity with relation to three conditions (pH, temp: and substrate conc.). What do the two axises (x and y) represent?
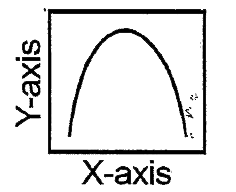 Ax-axis - Enzymatic activity, y-axis - pHBx-axis - Temperature, y-axis - Enzyme activityCx-axis - Substrate conc., y-axis - Enzymatic activityDx-axis - enzymatic activity, y-axis - temperature
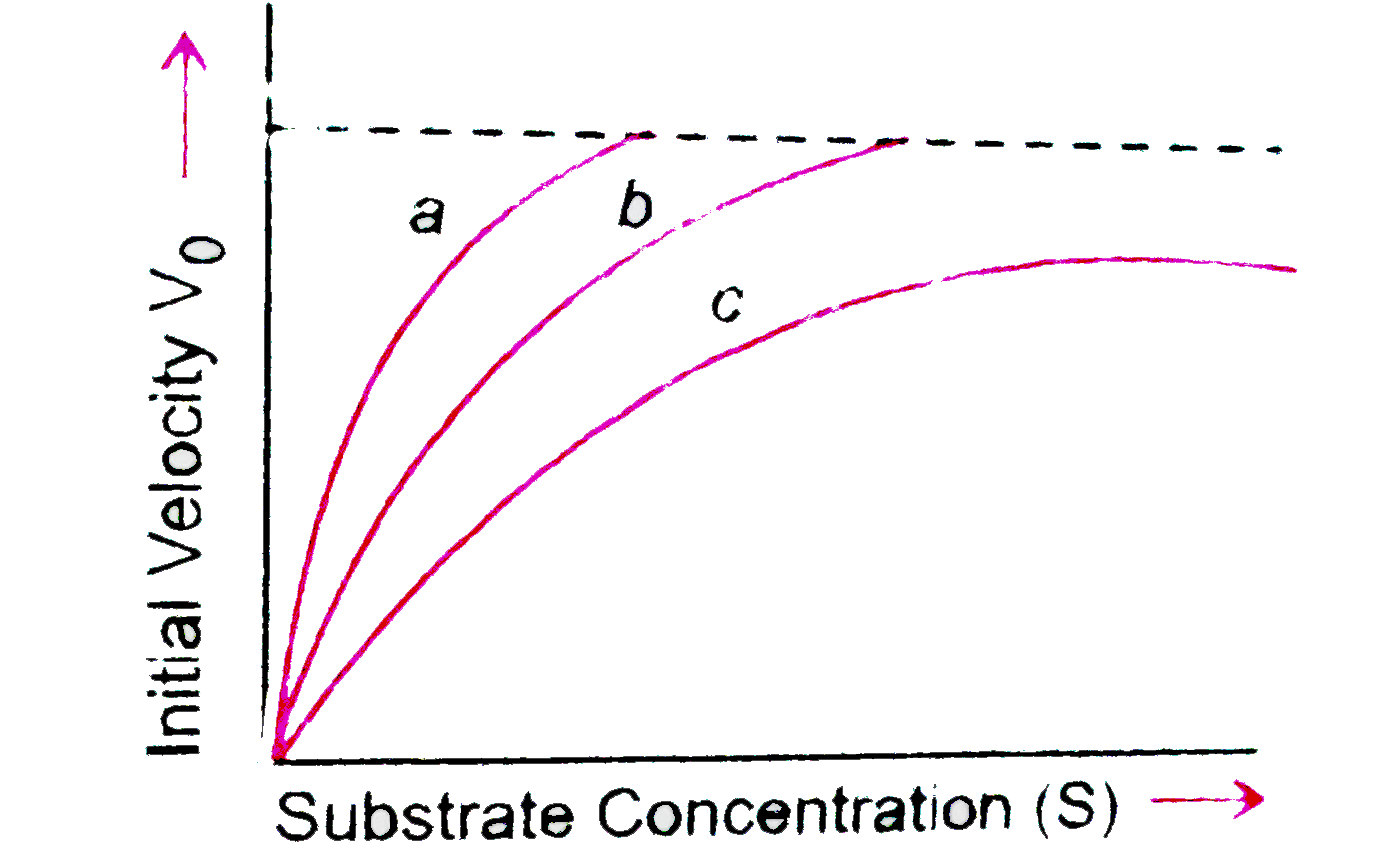
The given figure shows three velocity-substrate concentration curves for an enzyme reaction. What do the curves x, y and z depict respectively?
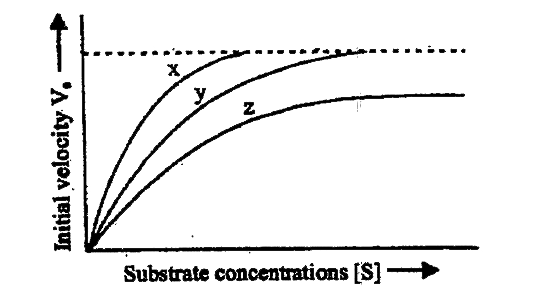 Ax-normal enzyme reaction, y-competitive inhibition, z-non-competitive inhibitionBx-enzyme with an allosteric modulator added, y-normal enzyme activity, 2-competitive inhibitionCX-enzyme with an allosteric stimulator, y-competitive inhibition added z-normal enzyme reactionDx-normal enzyme reaction, y-non-competitive inhibitor added z-allosteric inhibitor added
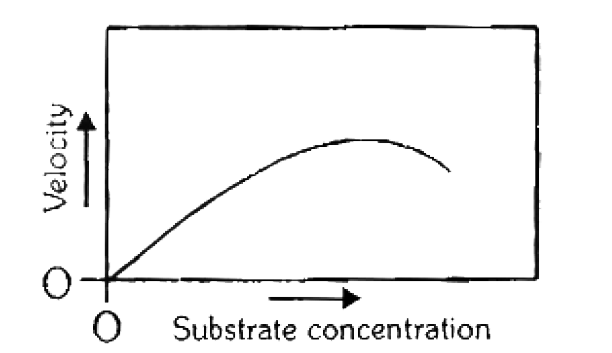
The graph given below shows the effect of substrate concentration on the rate of reaction of the enzyme green-gram-phosphatase What does the graph indicates?
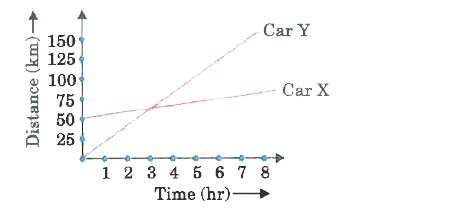
View SolutionThe figure given below shows the distance-time graph of the two cars, which began their journey together, in the same direction, from different points of start.
(i) find the speed of car X and Car Y.
(ii) When and where will car Y catch car X?
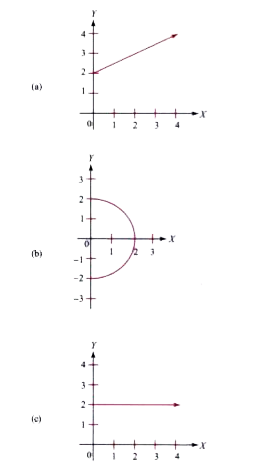
View SolutionThe diagrams given below represent relations from X to Y. Classify them as relation or function. If the relation is a function, classify it as one - one or many - one.
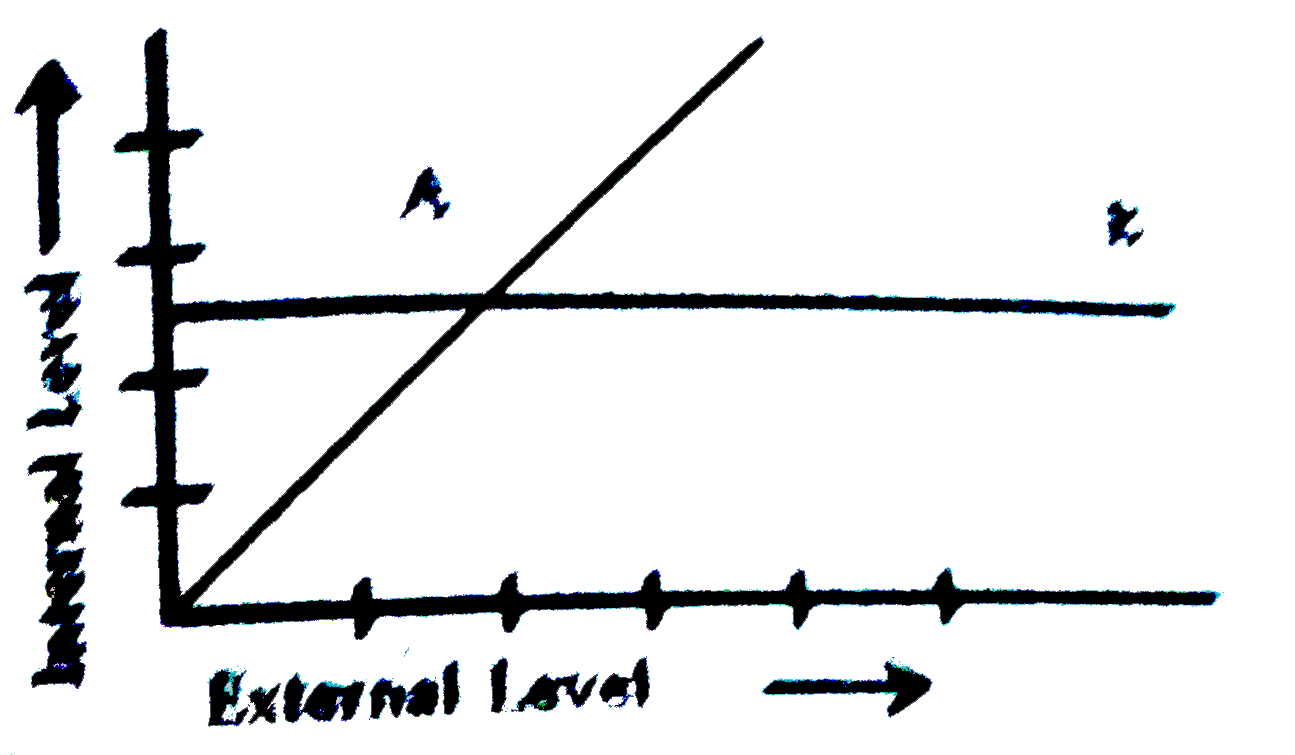
View Solution(a) The graph given below represents the organisms response to temperature as an environmental condition.
(i) Which one of the two lines represents conformers and why ?
(ii) What does the other line in the graph represent and why ?
(b) Mention the different adaptations the parasites have evolved with, to be able to successfully complete their life cycles in their hosts.
View SolutionFigure given below shows three velocity-substrate concentration curves for an enzyme reaxtion. What do the curves for an enzyme reaction. What do the curves depict
View Solution

