The final marks in mathematics of 30 students are as follows: 53,61,48,60,78,68,55,100,67,90,75,88,77,37,84 58,60,48,62,56,44,58,52,64,98,59,70,39,50,60 Arrange these marks in the ascending order, 30 to 39 one group, 40 to 49 second group etc. Now answer the following: What is the highest score? What is the lowest score? What is the range? If 40 is the pass marks how many have failed? How many have scored 75 or more? Which observations between 50 and 60 have not actually appeared? How many have scored less than 50?
To solve the problem step by step, we will first arrange the marks in ascending order and then answer the questions based on that arrangement.
Step 1: Arrange the Marks in Ascending Order
The final marks of the 30 students are:
53, 61, 48, 60, 78, 68, 55, 100, 67, 90, 75, 88, 77, 37, 84,
58, 60, 48, 62, 56, 44, 58, 52, 64, 98, 59, 70, 39, 50, 60.
Ascending Order:
- Group 30 to 39: 37, 39
- Group 40 to 49: 44, 48, 48
- Group 50 to 59: 50, 52, 53, 55, 56, 58, 58, 59
- Group 60 to 69: 60, 60, 60, 61, 62, 64, 67, 68
- Group 70 to 79: 70, 75, 77, 78
- Group 80 to 89: 84, 88
- Group 90 to 99: 90, 98
- Group 100: 100
Step 2: Answer the Questions
1. What is the highest score?
- The highest score is 100.
2. What is the lowest score?
- The lowest score is 37.
3. What is the range?
- Range = Highest score - Lowest score = 100 - 37 = 63.
4. If 40 is the pass marks, how many have failed?
- The students who scored less than 40 are 37 and 39.
- Therefore, 2 students have failed.
5. How many have scored 75 or more?
- The scores 75 and above are: 75, 77, 78, 84, 88, 90, 98, 100.
- There are 8 students who scored 75 or more.
6. Which observations between 50 and 60 have not actually appeared?
- The numbers between 50 and 60 are: 50, 51, 52, 53, 54, 55, 56, 57, 58, 59, 60.
- The numbers that did not appear are 51, 54, and 57.
7. How many have scored less than 50?
- The scores less than 50 are: 37, 39, 44, 48, 48.
- Therefore, 5 students scored less than 50.
Summary of Answers:
1. Highest score: 100
2. Lowest score: 37
3. Range: 63
4. Students failed: 2
5. Students scored 75 or more: 8
6. Missing observations between 50 and 60: 51, 54, 57
7. Students scored less than 50: 5
The final marks of the 30 students are:
53, 61, 48, 60, 78, 68, 55, 100, 67, 90, 75, 88, 77, 37, 84,
58, 60, 48, 62, 56, 44, 58, 52, 64, 98, 59, 70, 39, 50, 60.
- Group 30 to 39: 37, 39
- Group 40 to 49: 44, 48, 48
- Group 50 to 59: 50, 52, 53, 55, 56, 58, 58, 59
- Group 60 to 69: 60, 60, 60, 61, 62, 64, 67, 68
- Group 70 to 79: 70, 75, 77, 78
- Group 80 to 89: 84, 88
- Group 90 to 99: 90, 98
- Group 100: 100
- The highest score is 100.
- The lowest score is 37.
- Range = Highest score - Lowest score = 100 - 37 = 63.
- The students who scored less than 40 are 37 and 39.
- Therefore, 2 students have failed.
- The scores 75 and above are: 75, 77, 78, 84, 88, 90, 98, 100.
- There are 8 students who scored 75 or more.
- The numbers between 50 and 60 are: 50, 51, 52, 53, 54, 55, 56, 57, 58, 59, 60.
- The numbers that did not appear are 51, 54, and 57.
- The scores less than 50 are: 37, 39, 44, 48, 48.
- Therefore, 5 students scored less than 50.
1. Highest score: 100
2. Lowest score: 37
3. Range: 63
4. Students failed: 2
5. Students scored 75 or more: 8
6. Missing observations between 50 and 60: 51, 54, 57
7. Students scored less than 50: 5
Topper's Solved these Questions
Similar Questions
The final marks in mathematics of 30 students are as follows: 53,61,48,60,78,68,55,100,67,90 75,88,77,37,84,58,60,48,62,56 44,58,52,64,98,59,70,39,50,60 Arrange these marks in the ascending order 30 to 39 one group, 40 to 49 second group, etc. What is the highest score? What is the lowest score? (iv) What is the range? If 40 is the pass mark how many have failed? How many have scored 75 or more? Which observations between 50 and 60 have not actually appeared? How many have scored less than 50?
View SolutionFind the variance for the following data : 65,58,68,44,48,45,60,62,60,50
View Solution
Knowledge Check
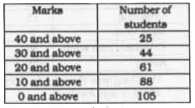
Refer the following data table and answer the question.

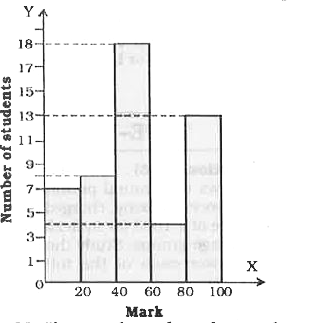
How many students have scored marks 20 or more but less than 40?A44B61C36D105Study the histogram of marks (in Mathematics) distribution of 50 students of class IX and answer the following questions.

The number of students who have scored between 39 and 80 is :A22B18C37D15A student has to score 60% to pass exam. He scores 225 marks & failed by 15%. Find the maximum marks of exam.
A400B500C600DCan't be determined

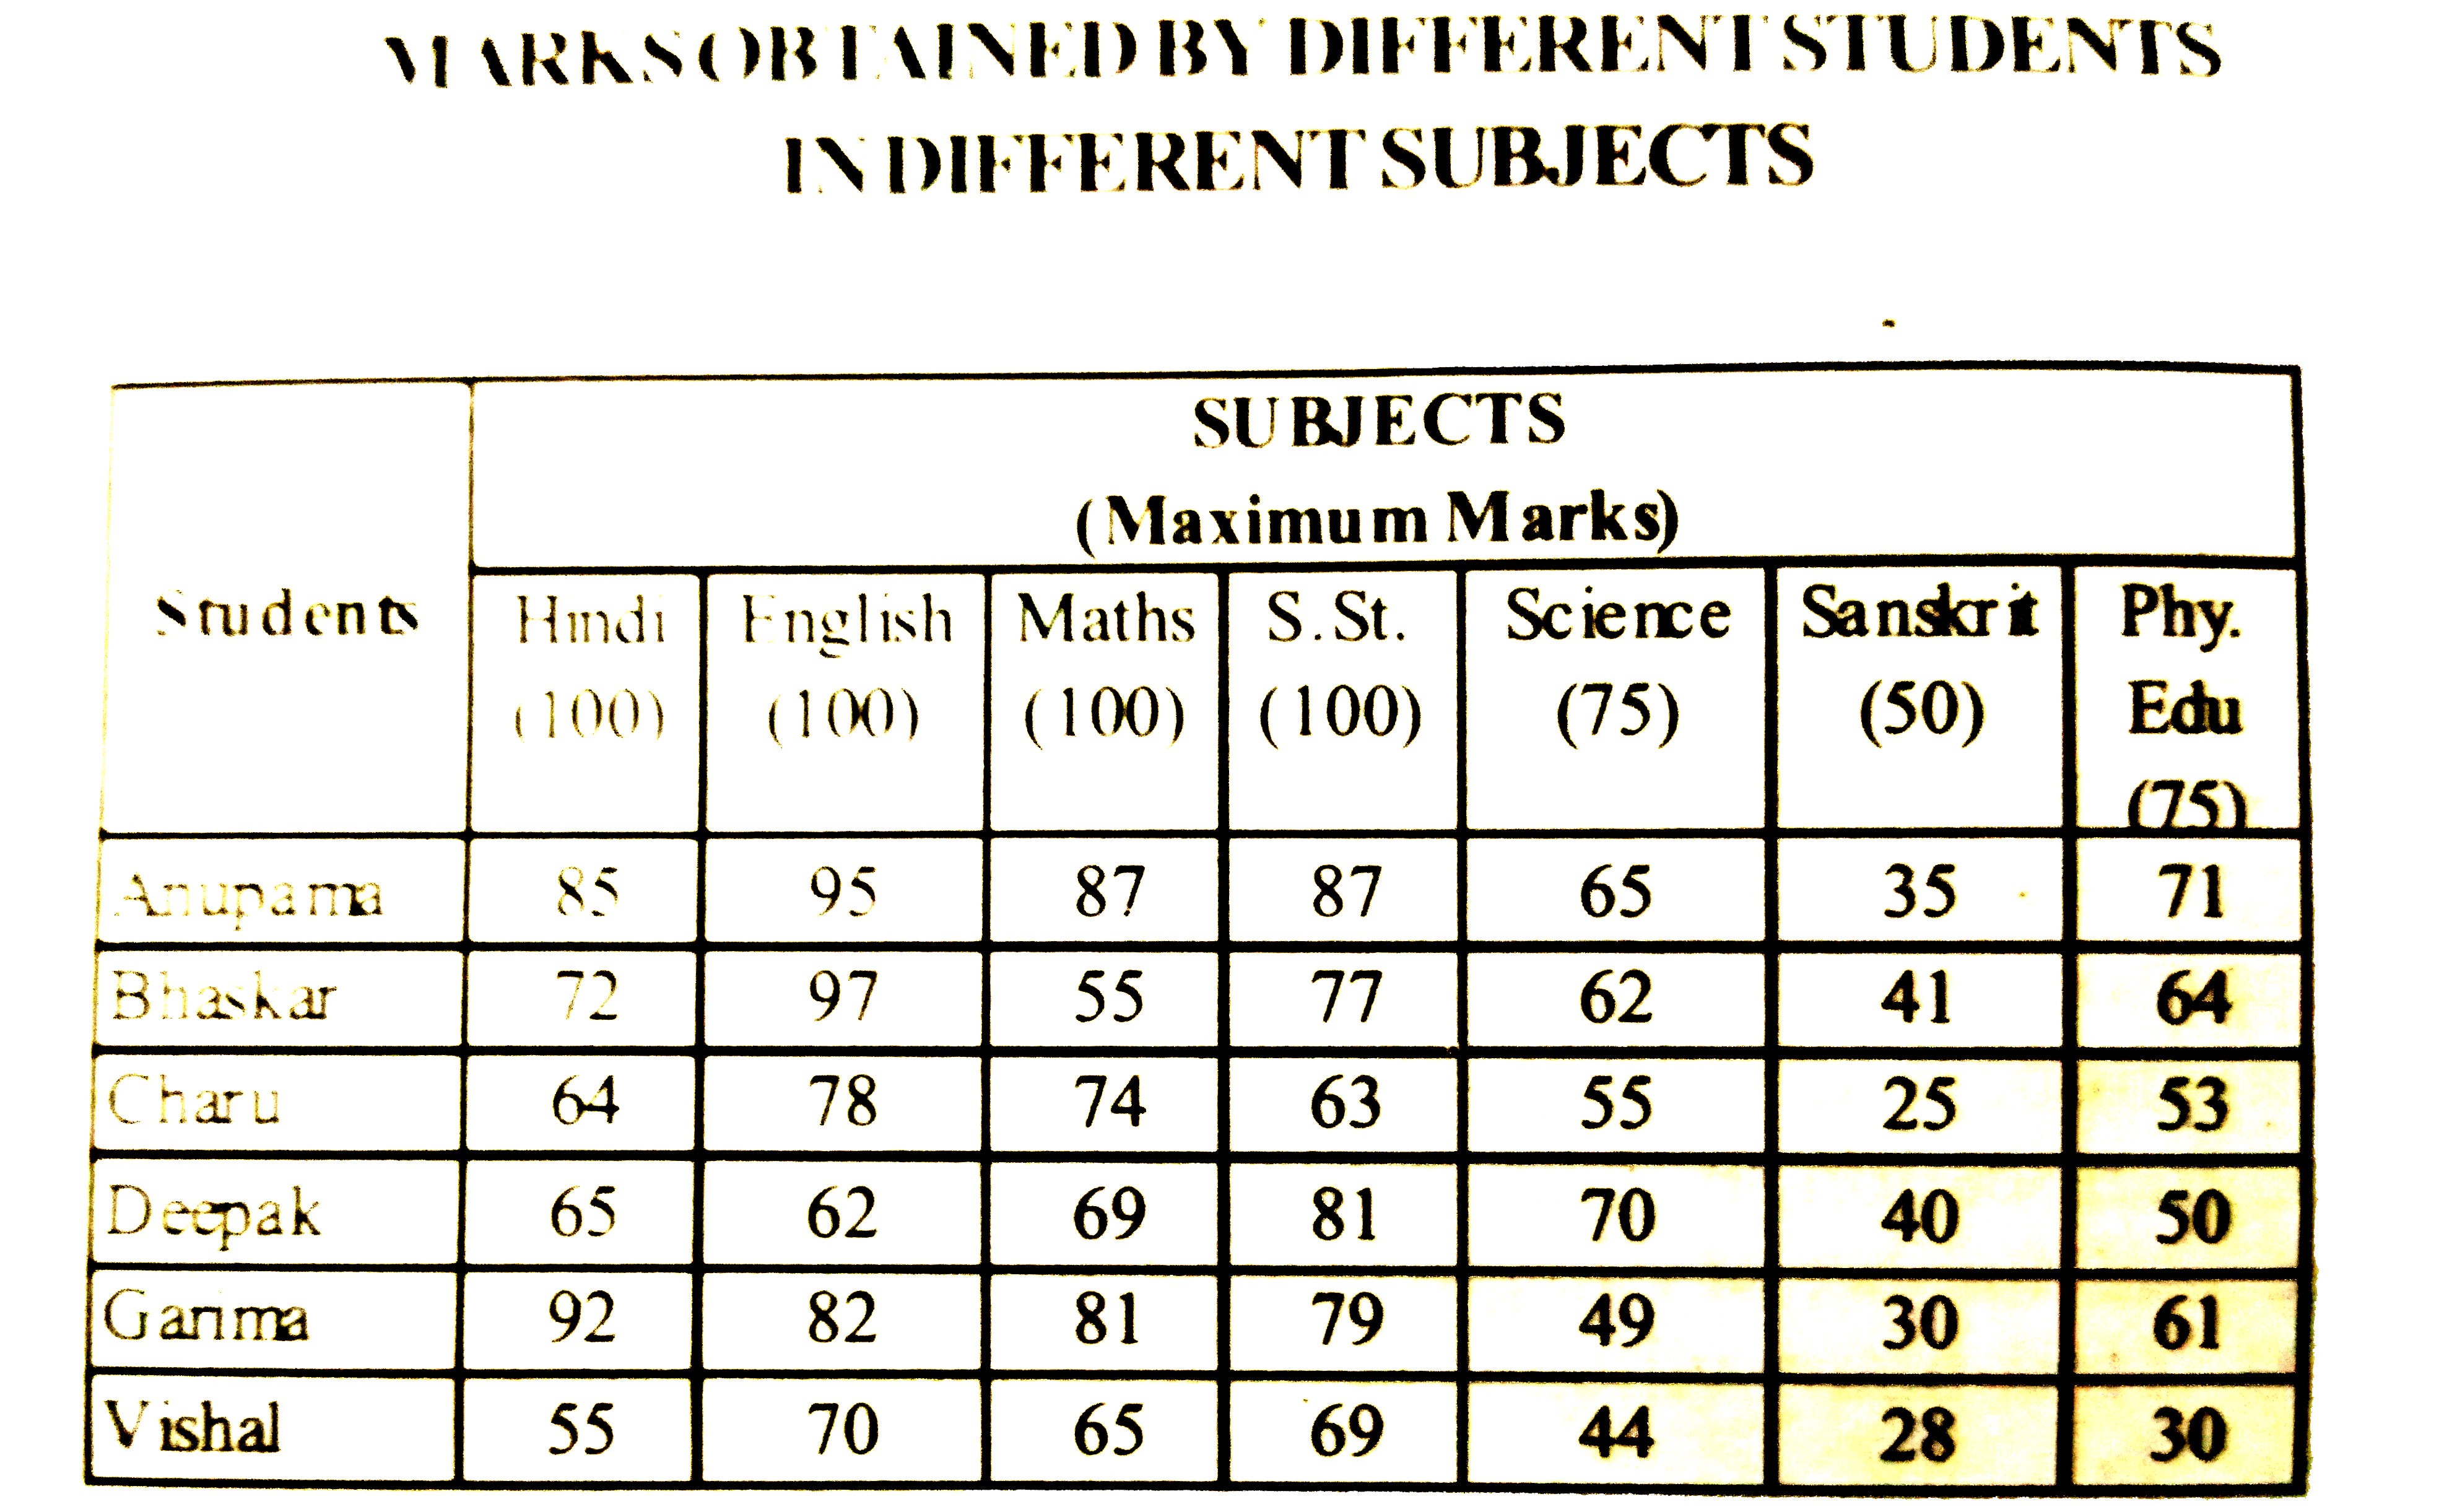
How many students have scored the lowest marks in two or more subjects ?
View SolutionThe number of runs scored by a cricket player in 25 innings are as follows: 26,35,94,48,82,105,53,0,39,42,71,0,64,15,34,67,0,42,124,84,54,48,139,64,47 Rearrange these runs in ascending order. Determine the player, is highest score. How many times did the player not score a run? How many centuries did he score? How many times did he score more than 50 runes?
View Solution
How many students have scored the highest marks in more than one subject ?
View SolutionGiven below are the marks (out of 100) in mathematics obtained by 20 students of a calss in an annual examination.
23,75,56,42,70,84,92,51,40,63,87,58,35,80,14,63,49,72,66,61.
Arrange the above data in ascending order and find
(i) The lowest marks obtained.
(ii) The highest marks obtained.
(iii) The range of the given data.
View SolutionThe maximum marks in a test are converted from 250 to 50 for the purpose of an Internal Assessment. The highest marks scored were 170 and lowest marks were 70. What is the difference between the maximum and minimum marks scored in the Internal Assessment?
View Solution

