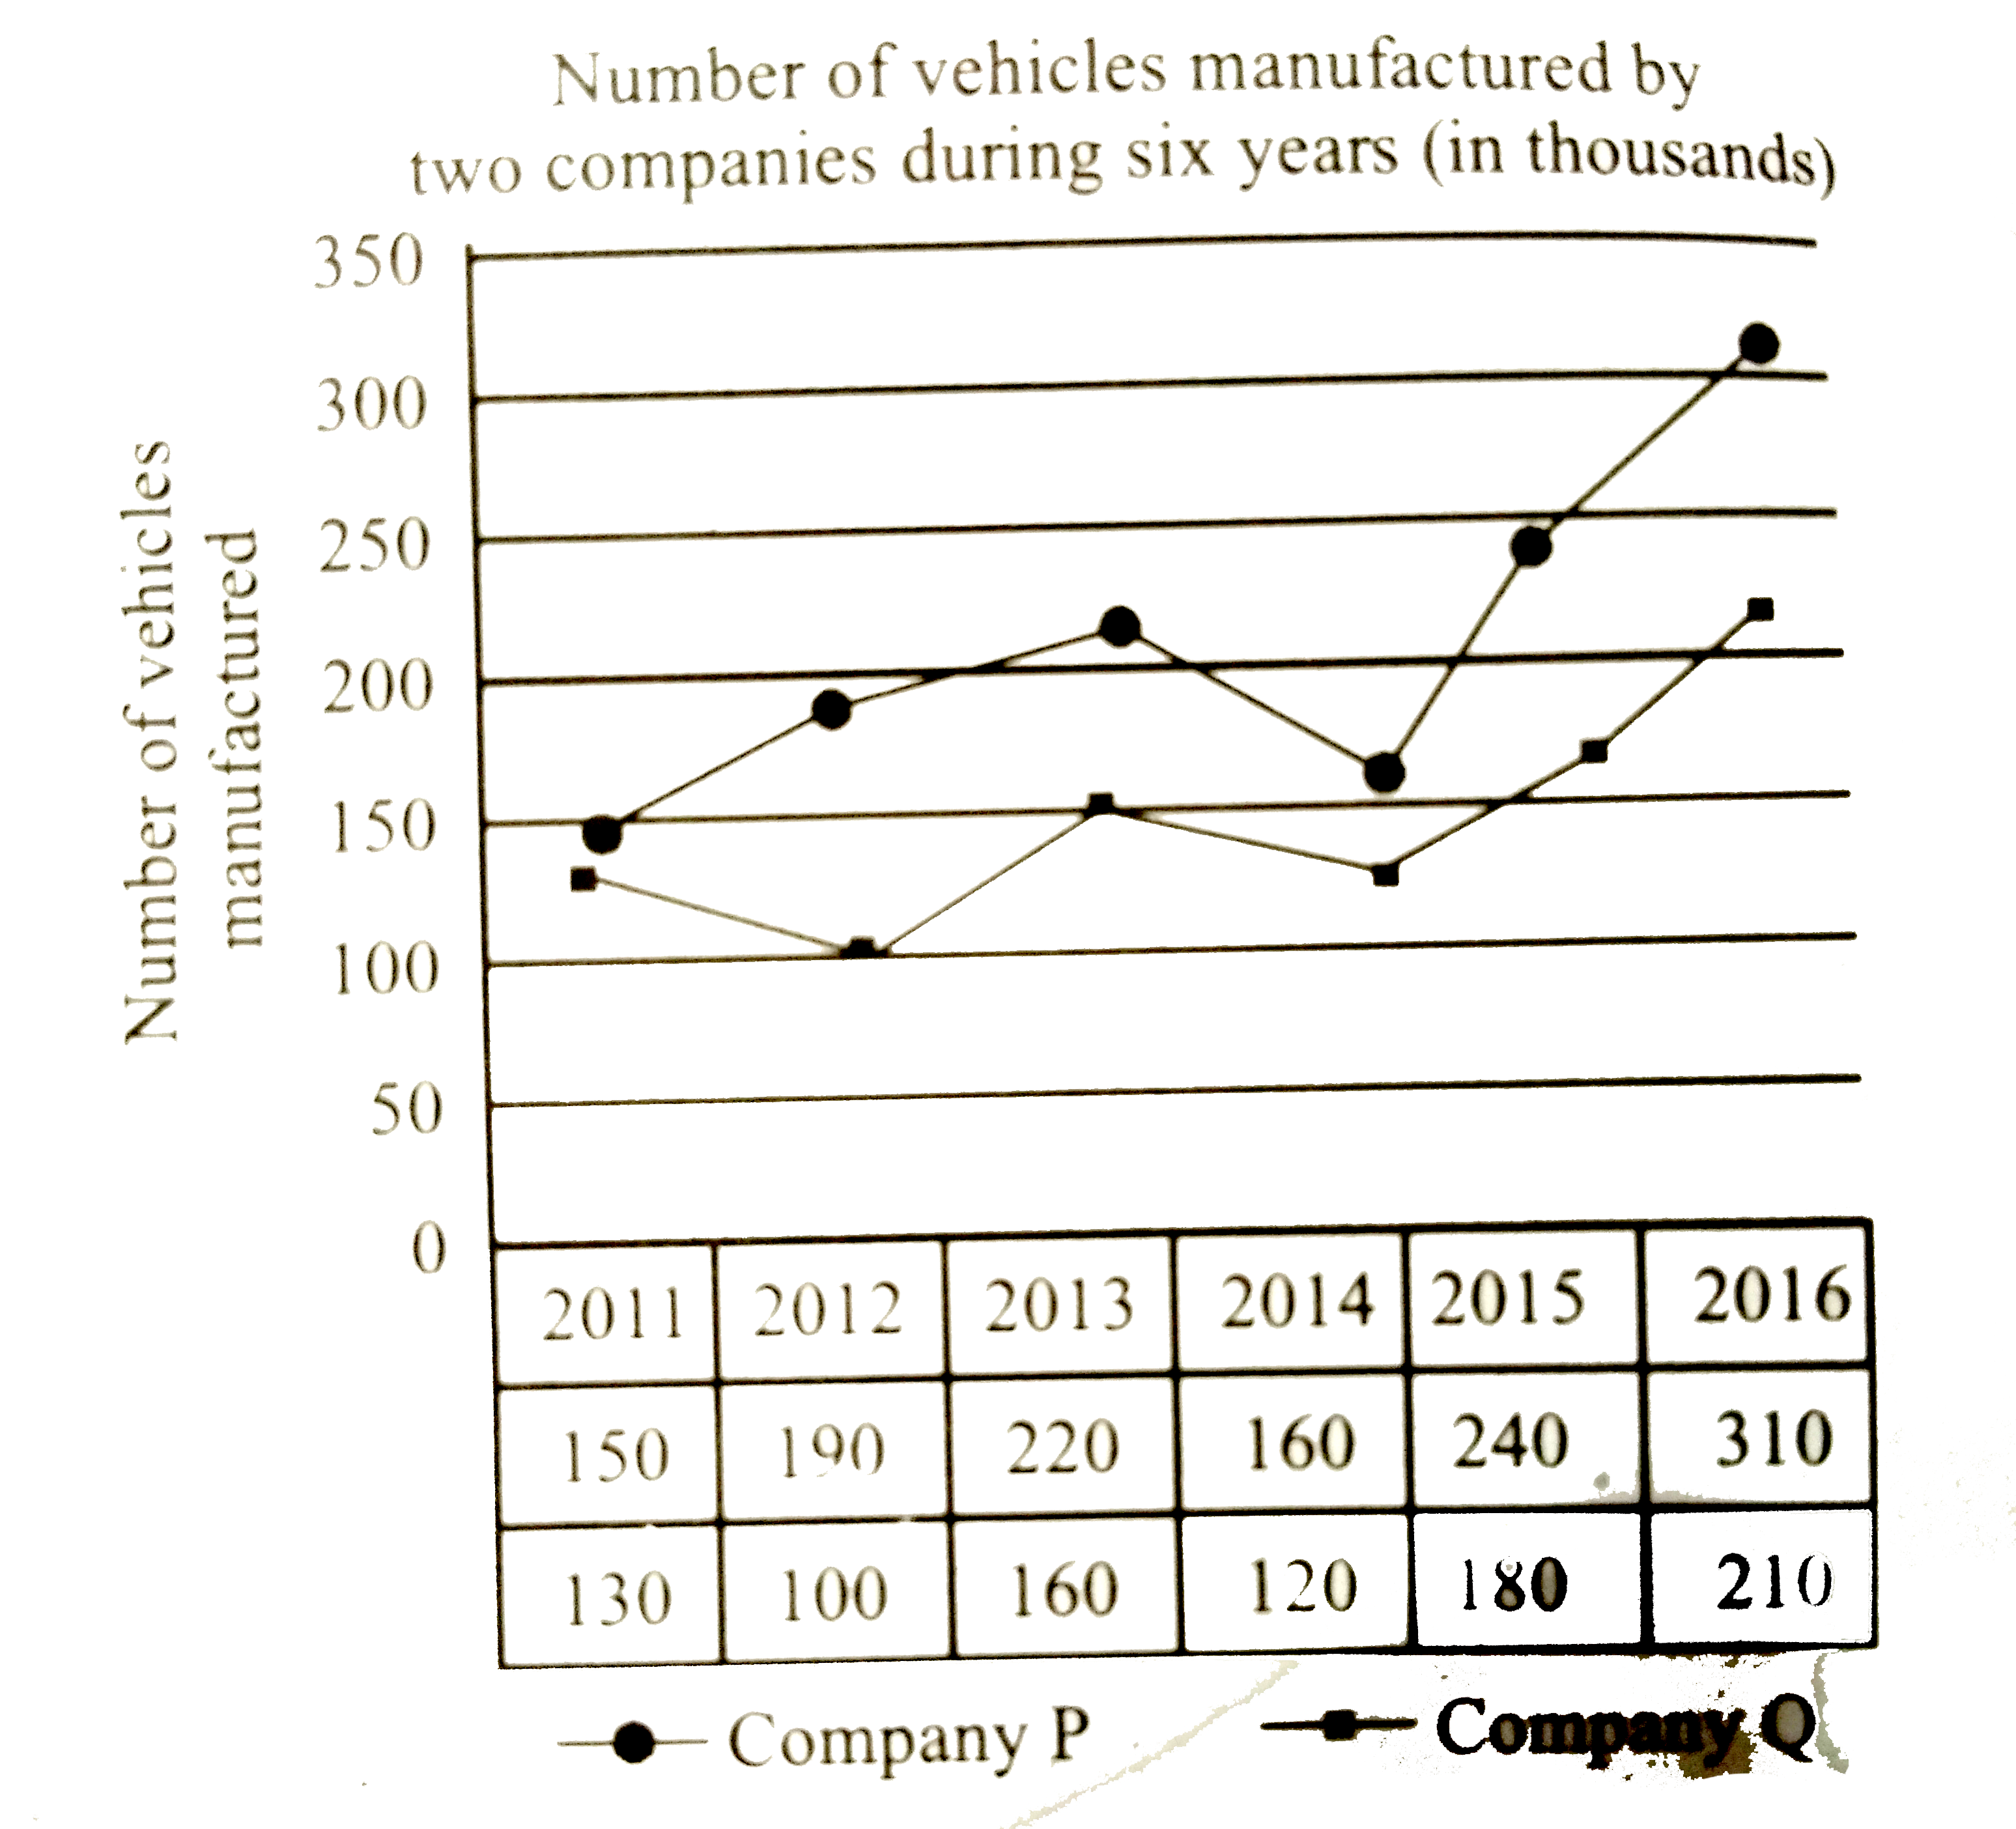
In year 2017, there was in increases of 30% in number of vehicles manufactured by company P as compared to vehicles manufactured by same company in the year 2012. What is the total number of vehicles manufactured by the same company in the year 2017 ?
A
a) 247
B
b) 297
C
c) 211
D
d) 310
Video Solution
Text Solution
The correct Answer is:A
Number of vehicles produced by P in the year 2012=190
Number of vehicles produced in 2017
=190×130100=247
|
Updated on:21/07/2023
Related Playlists
Knowledge Check
- Question 1 - Select One
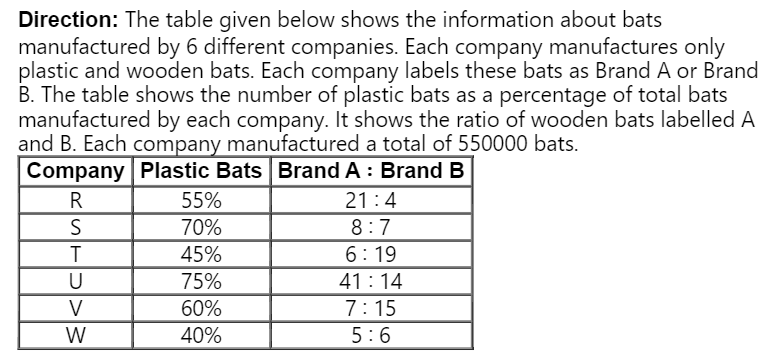
What is the total number of wooden bats of brand A manufactured by company T?A23420B22990C68920D72600 - Question 1 - Select One
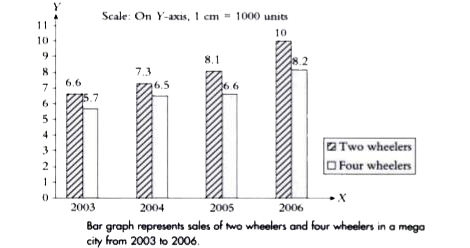
Find the ratio between number of vehicles sold in the year 2004 and in the year 2006.A41:46B69:91C147:182D46:49 - Question 1 - Select One
The Table shows the Number of Laptops and Desktops manufactured by a company.

What is the average number of laptops manufactured by a company from 2008 to 2012 ?A13550B16540C14260D16140 - Question 1 - Select One
The following graph gives the amount of manure (in thousand tonnes) manufactured by a company during some years.
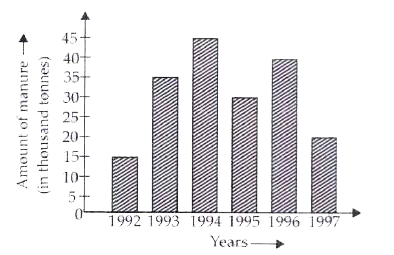
In which year the amonnt of manure manufactured by the company was minimum?A1992B1993C1995D1997 - Question 1 - Select One
The following graph gives the amount of manure (in thousand tonnes) manufactured by a company during some years.
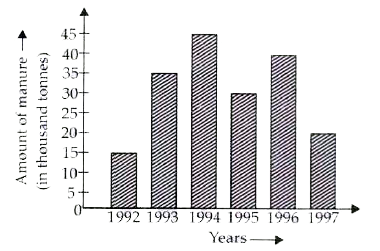
In which year the amount of manure manufactured by the company was maximum?A1993B1994C1996D1997 - Question 1 - Select One
The line chart given blow shows the number of cars manufactured (in 000') by company X in year 2015 from the month of July to December.
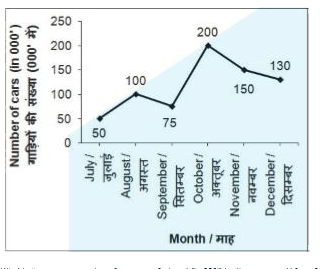
What is the average number of cars manufactured (in 000') by the company X from July to November?A105B100C115D141 - Question 1 - Select One
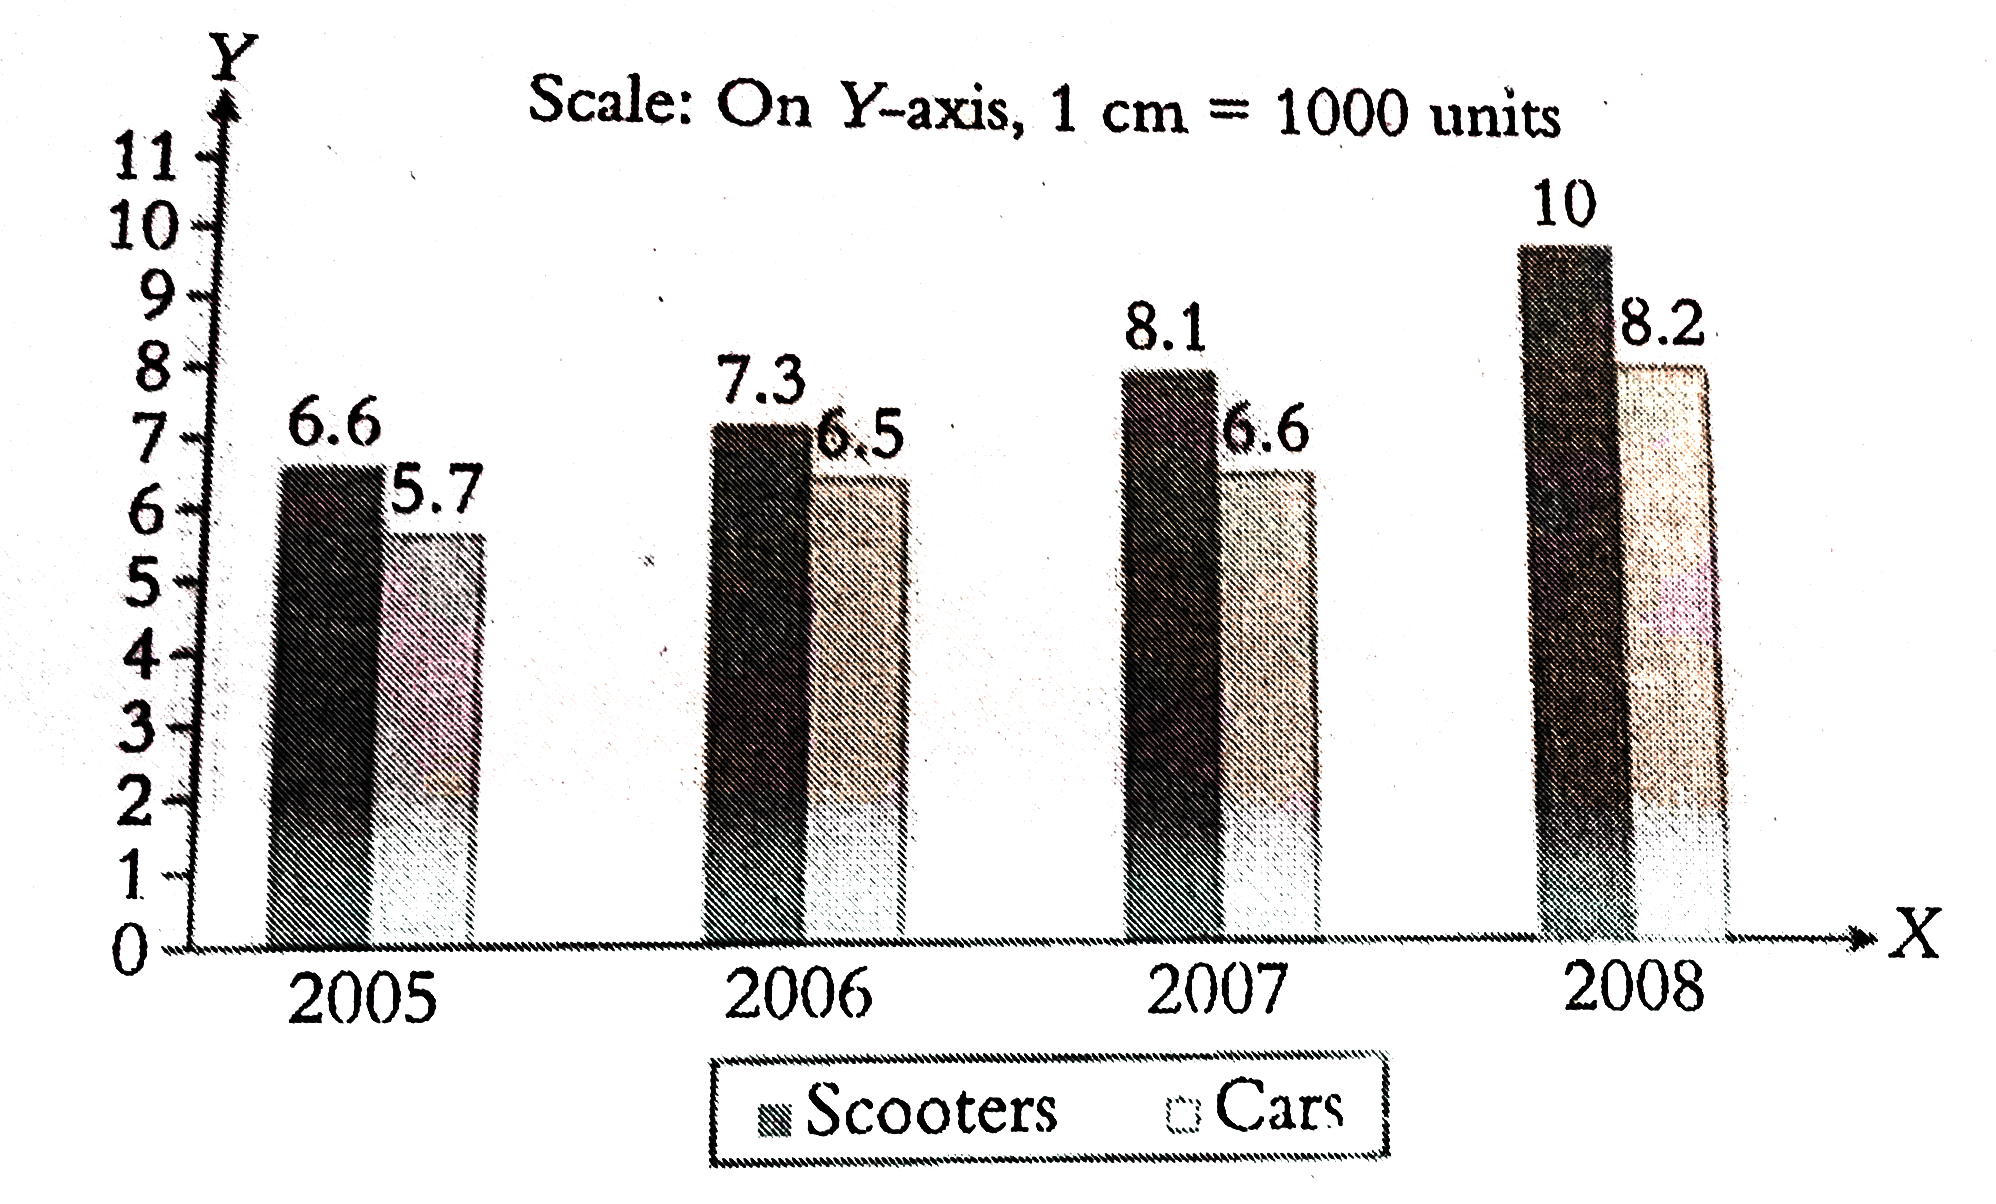
Find the ratio between the total number of vehicles sold (scooters and cars) in the year 2006 and that in the year 2008.A41:46B69:91C147:182D46:49
Similar Questions
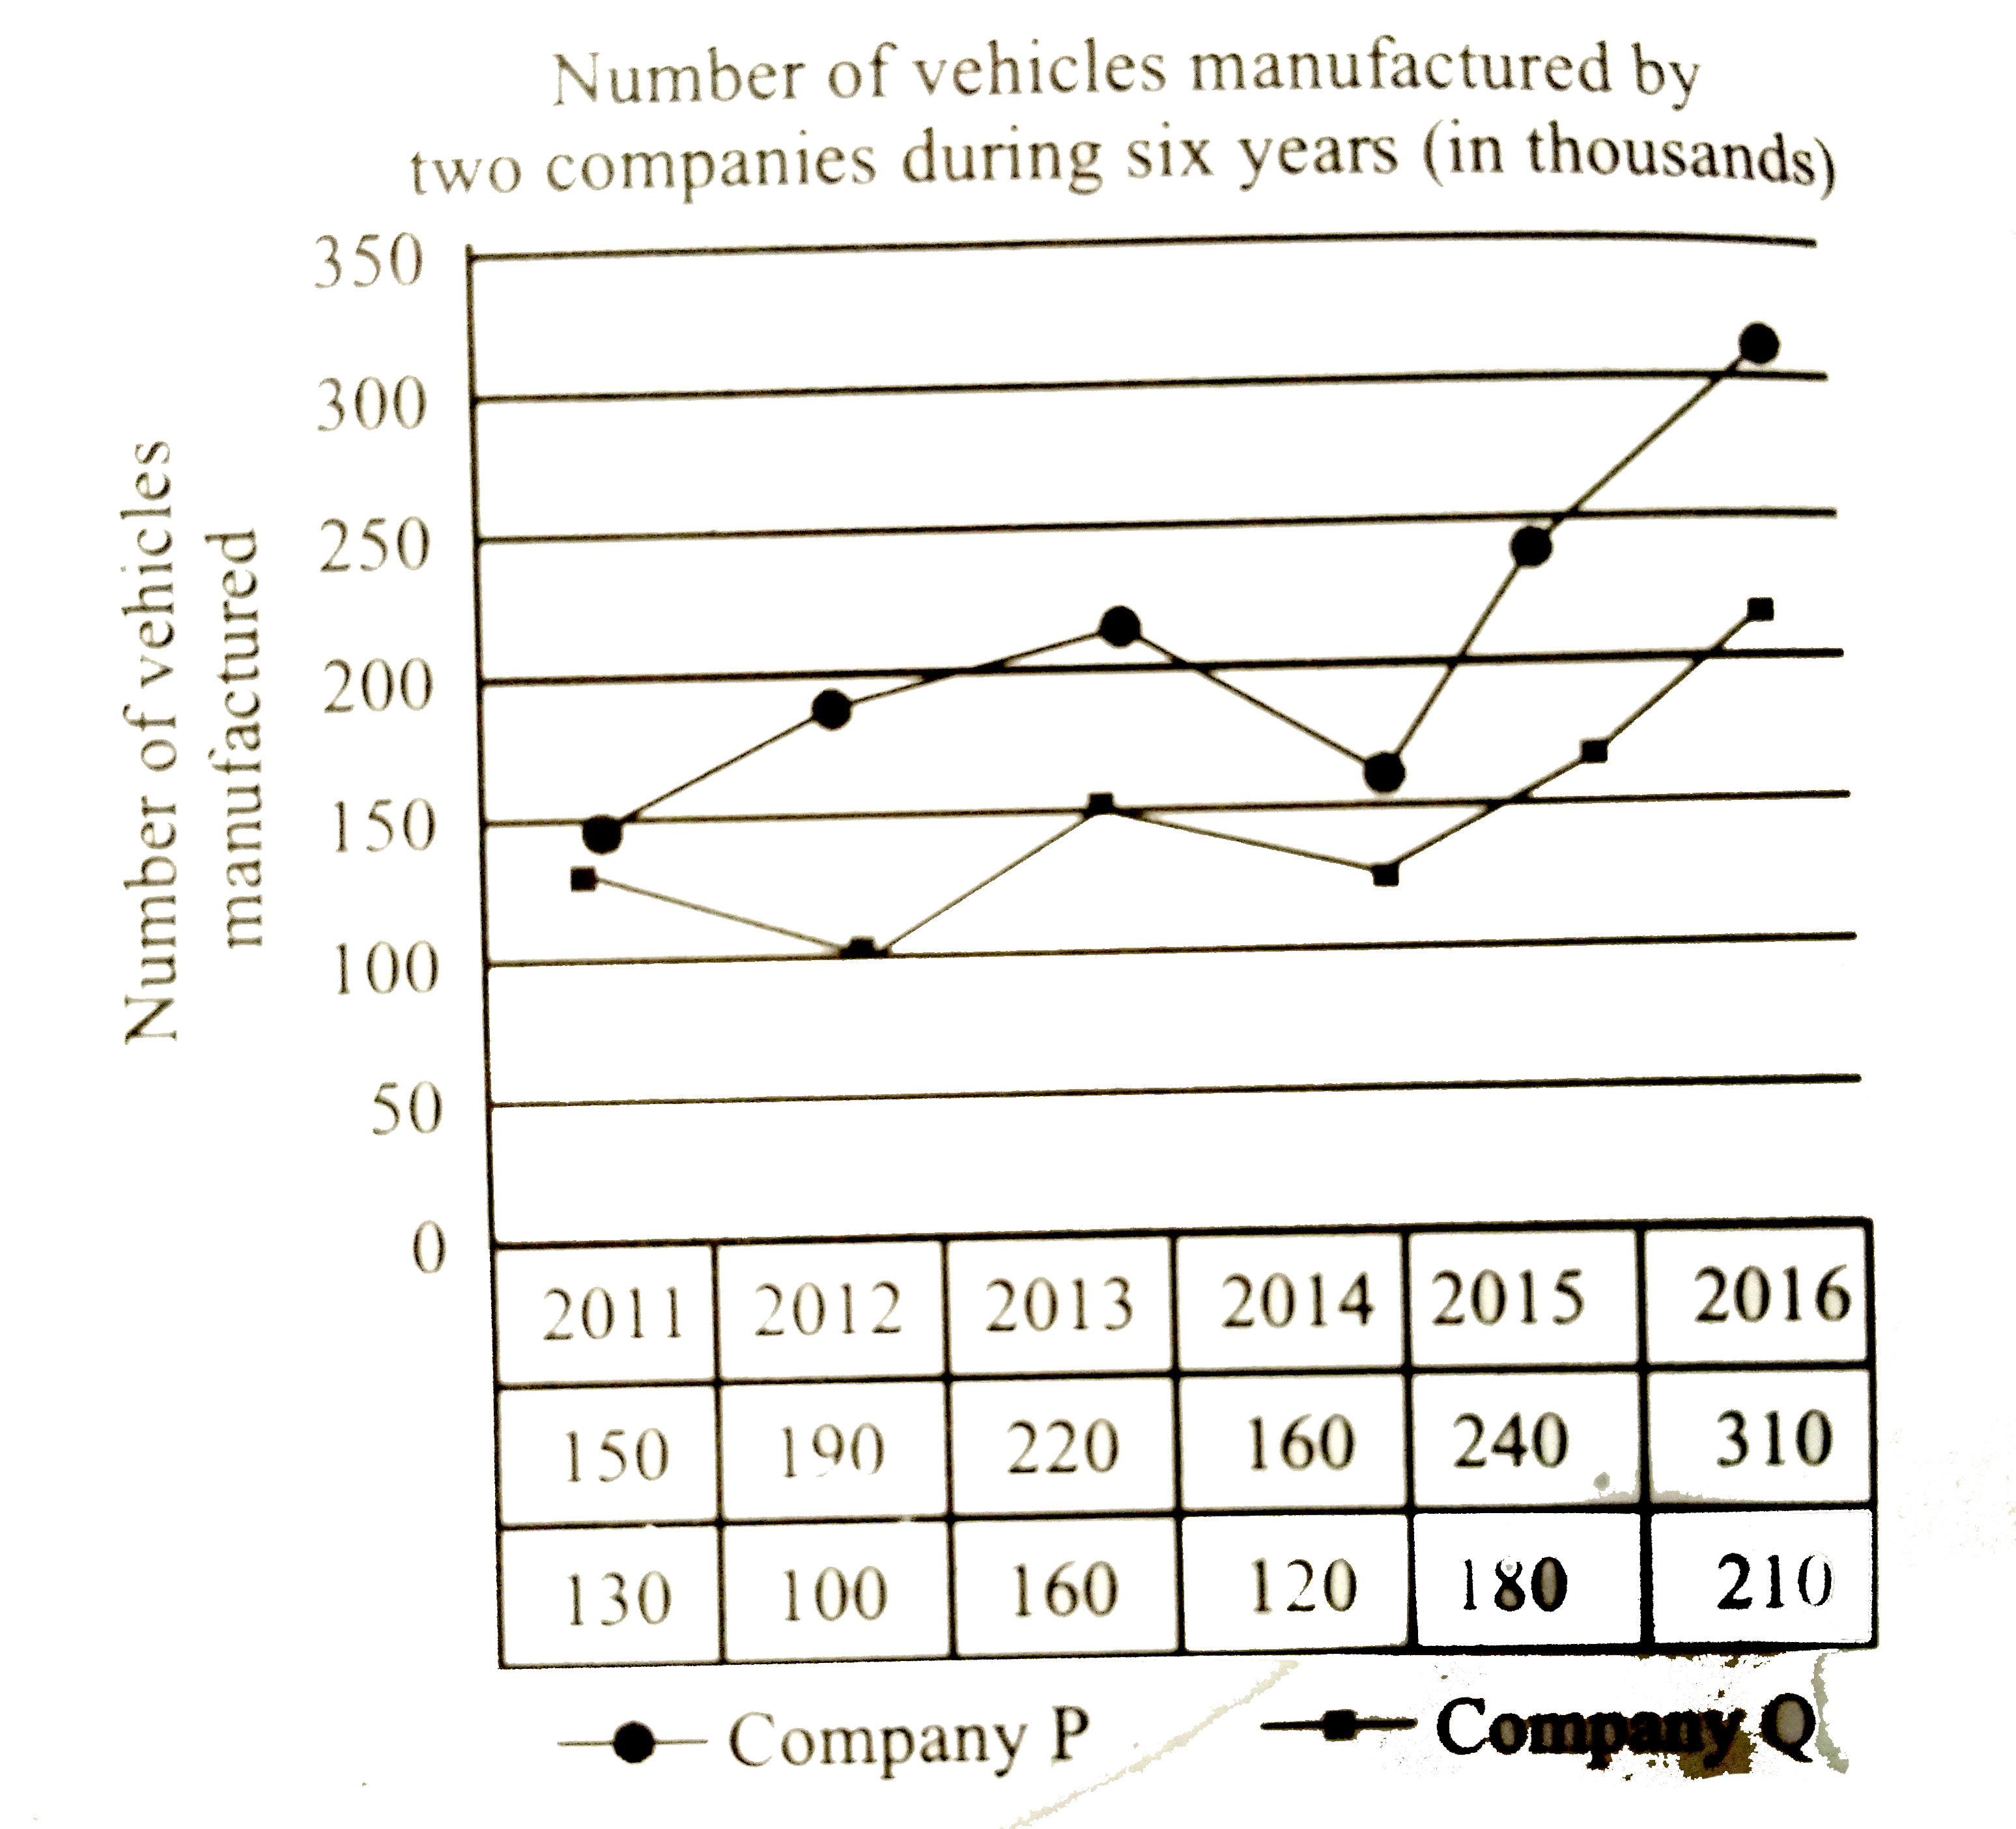
What is the average number of vehicles manufactured by company Q over six years (in thousands)View Solution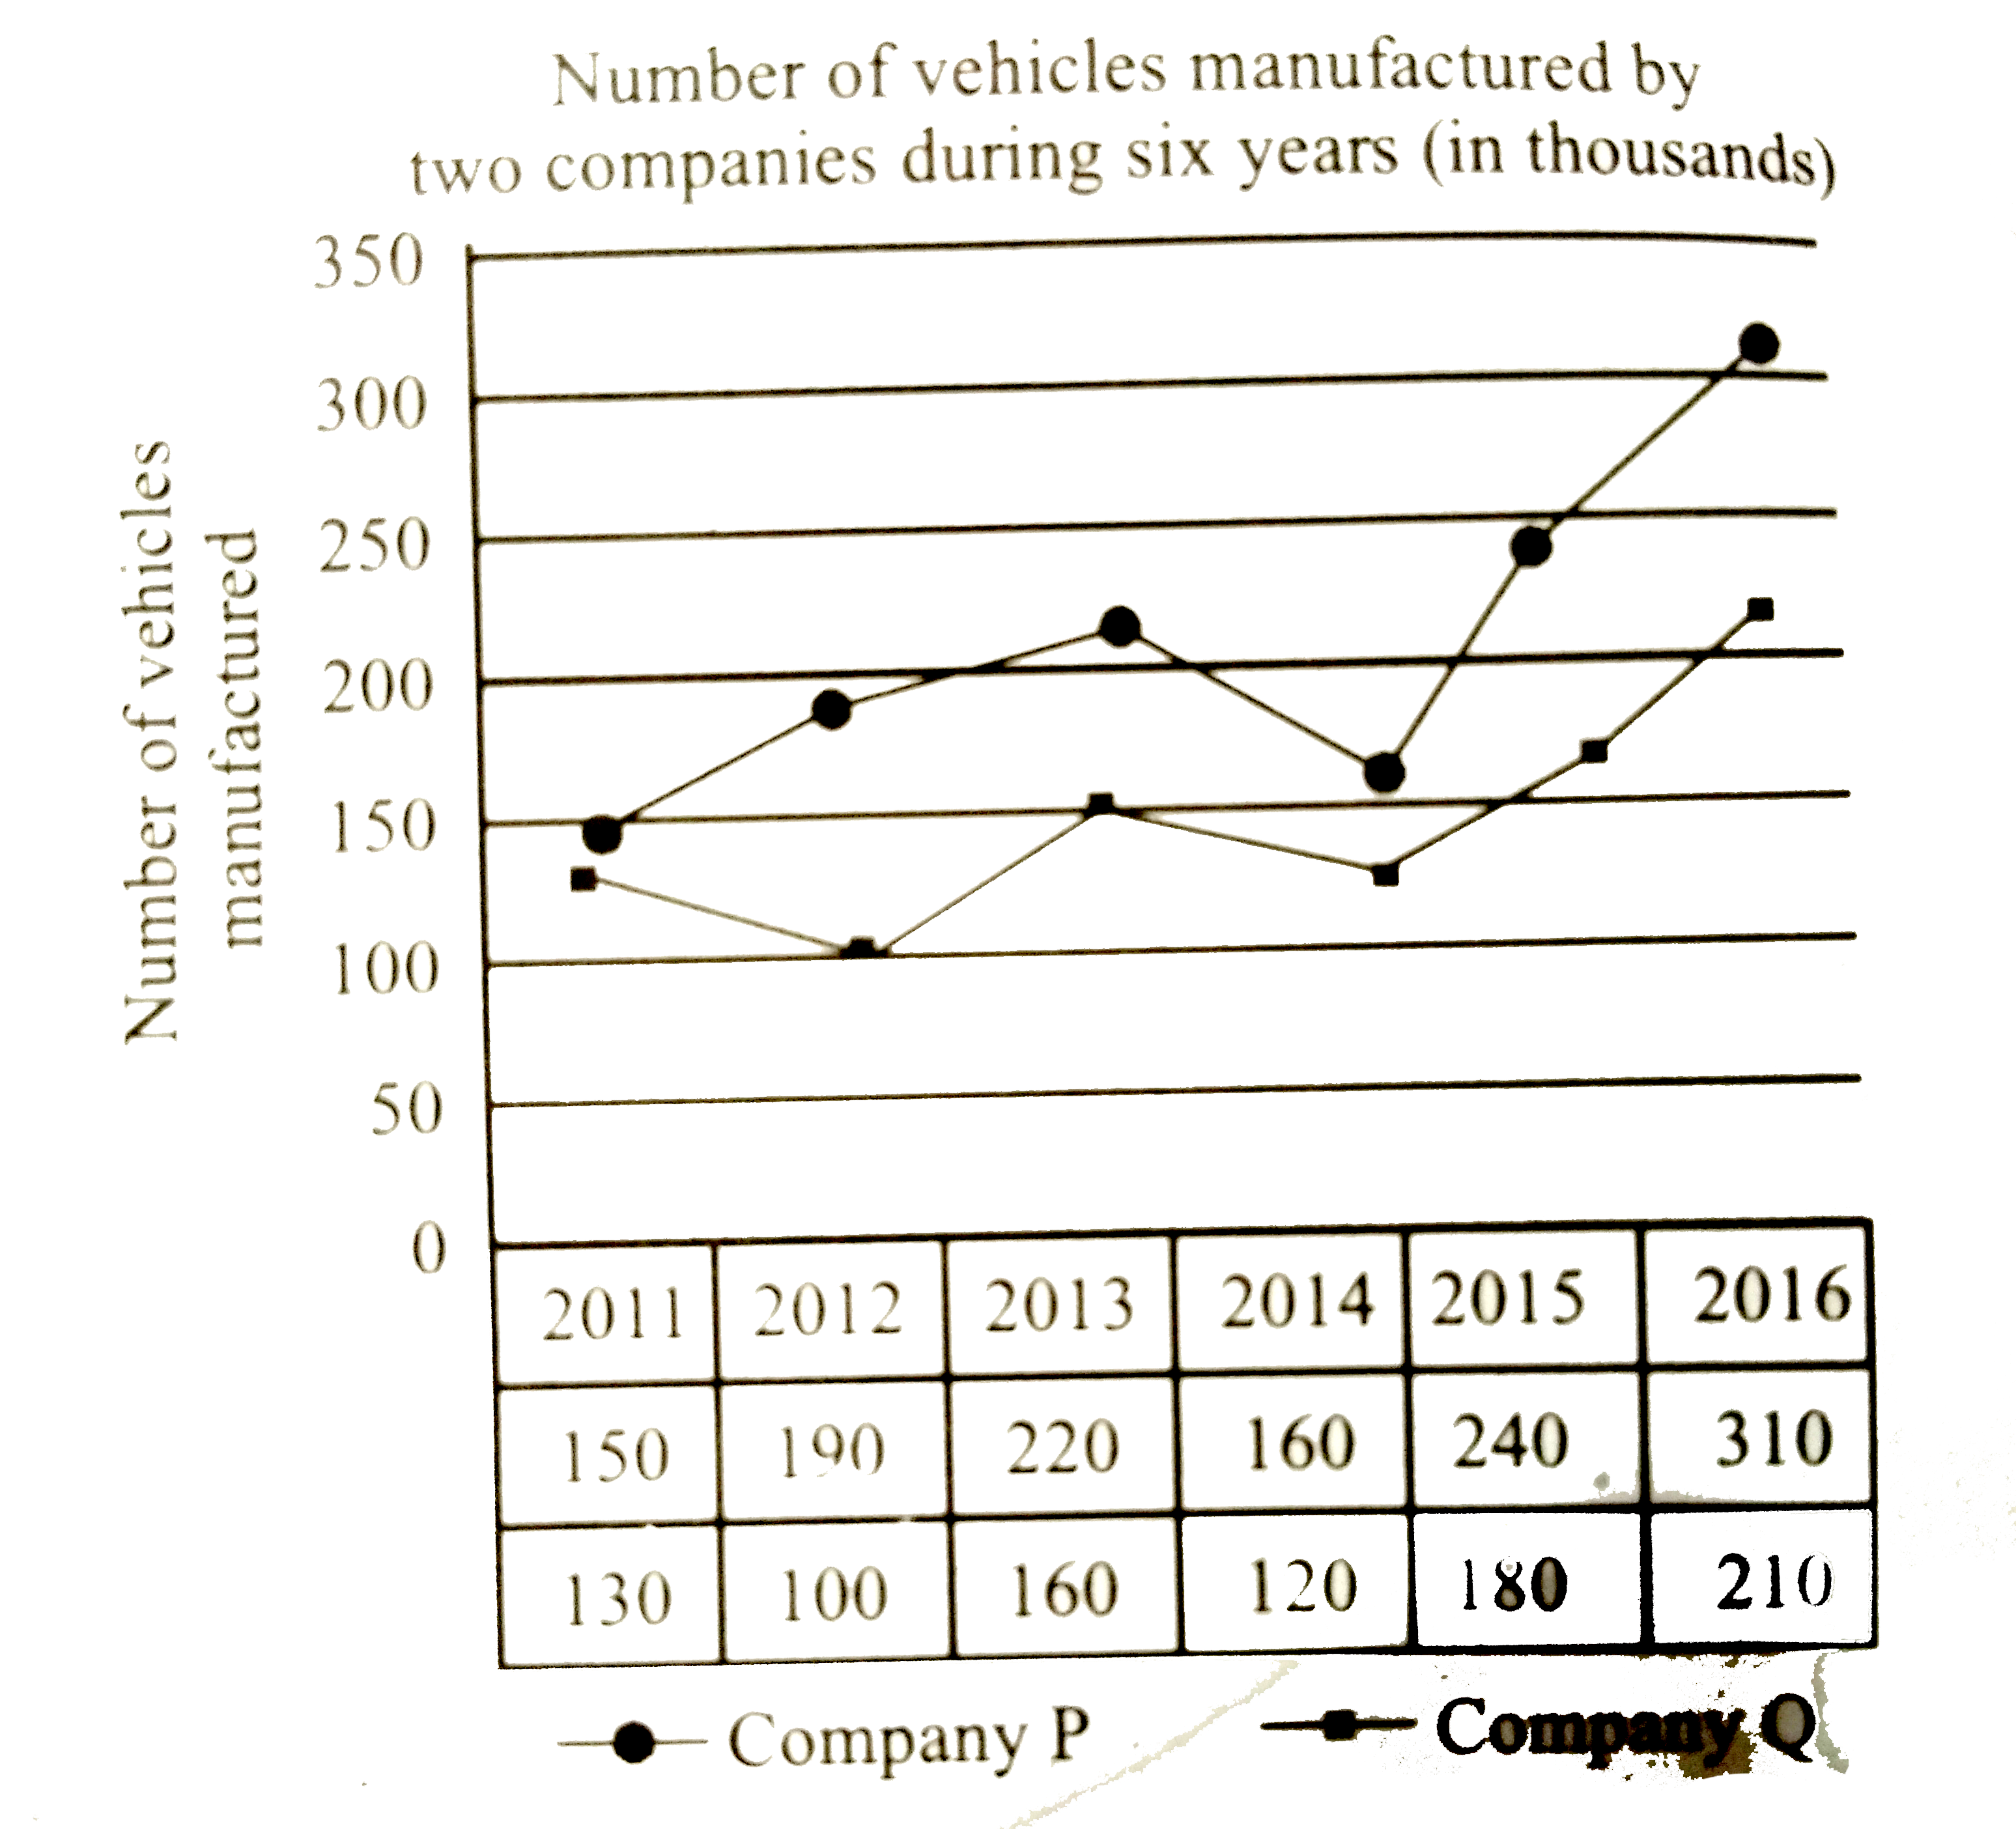
What is the percentage decrease in number of vehicles manufacture by both companies from 2013 to 2014 ?View Solution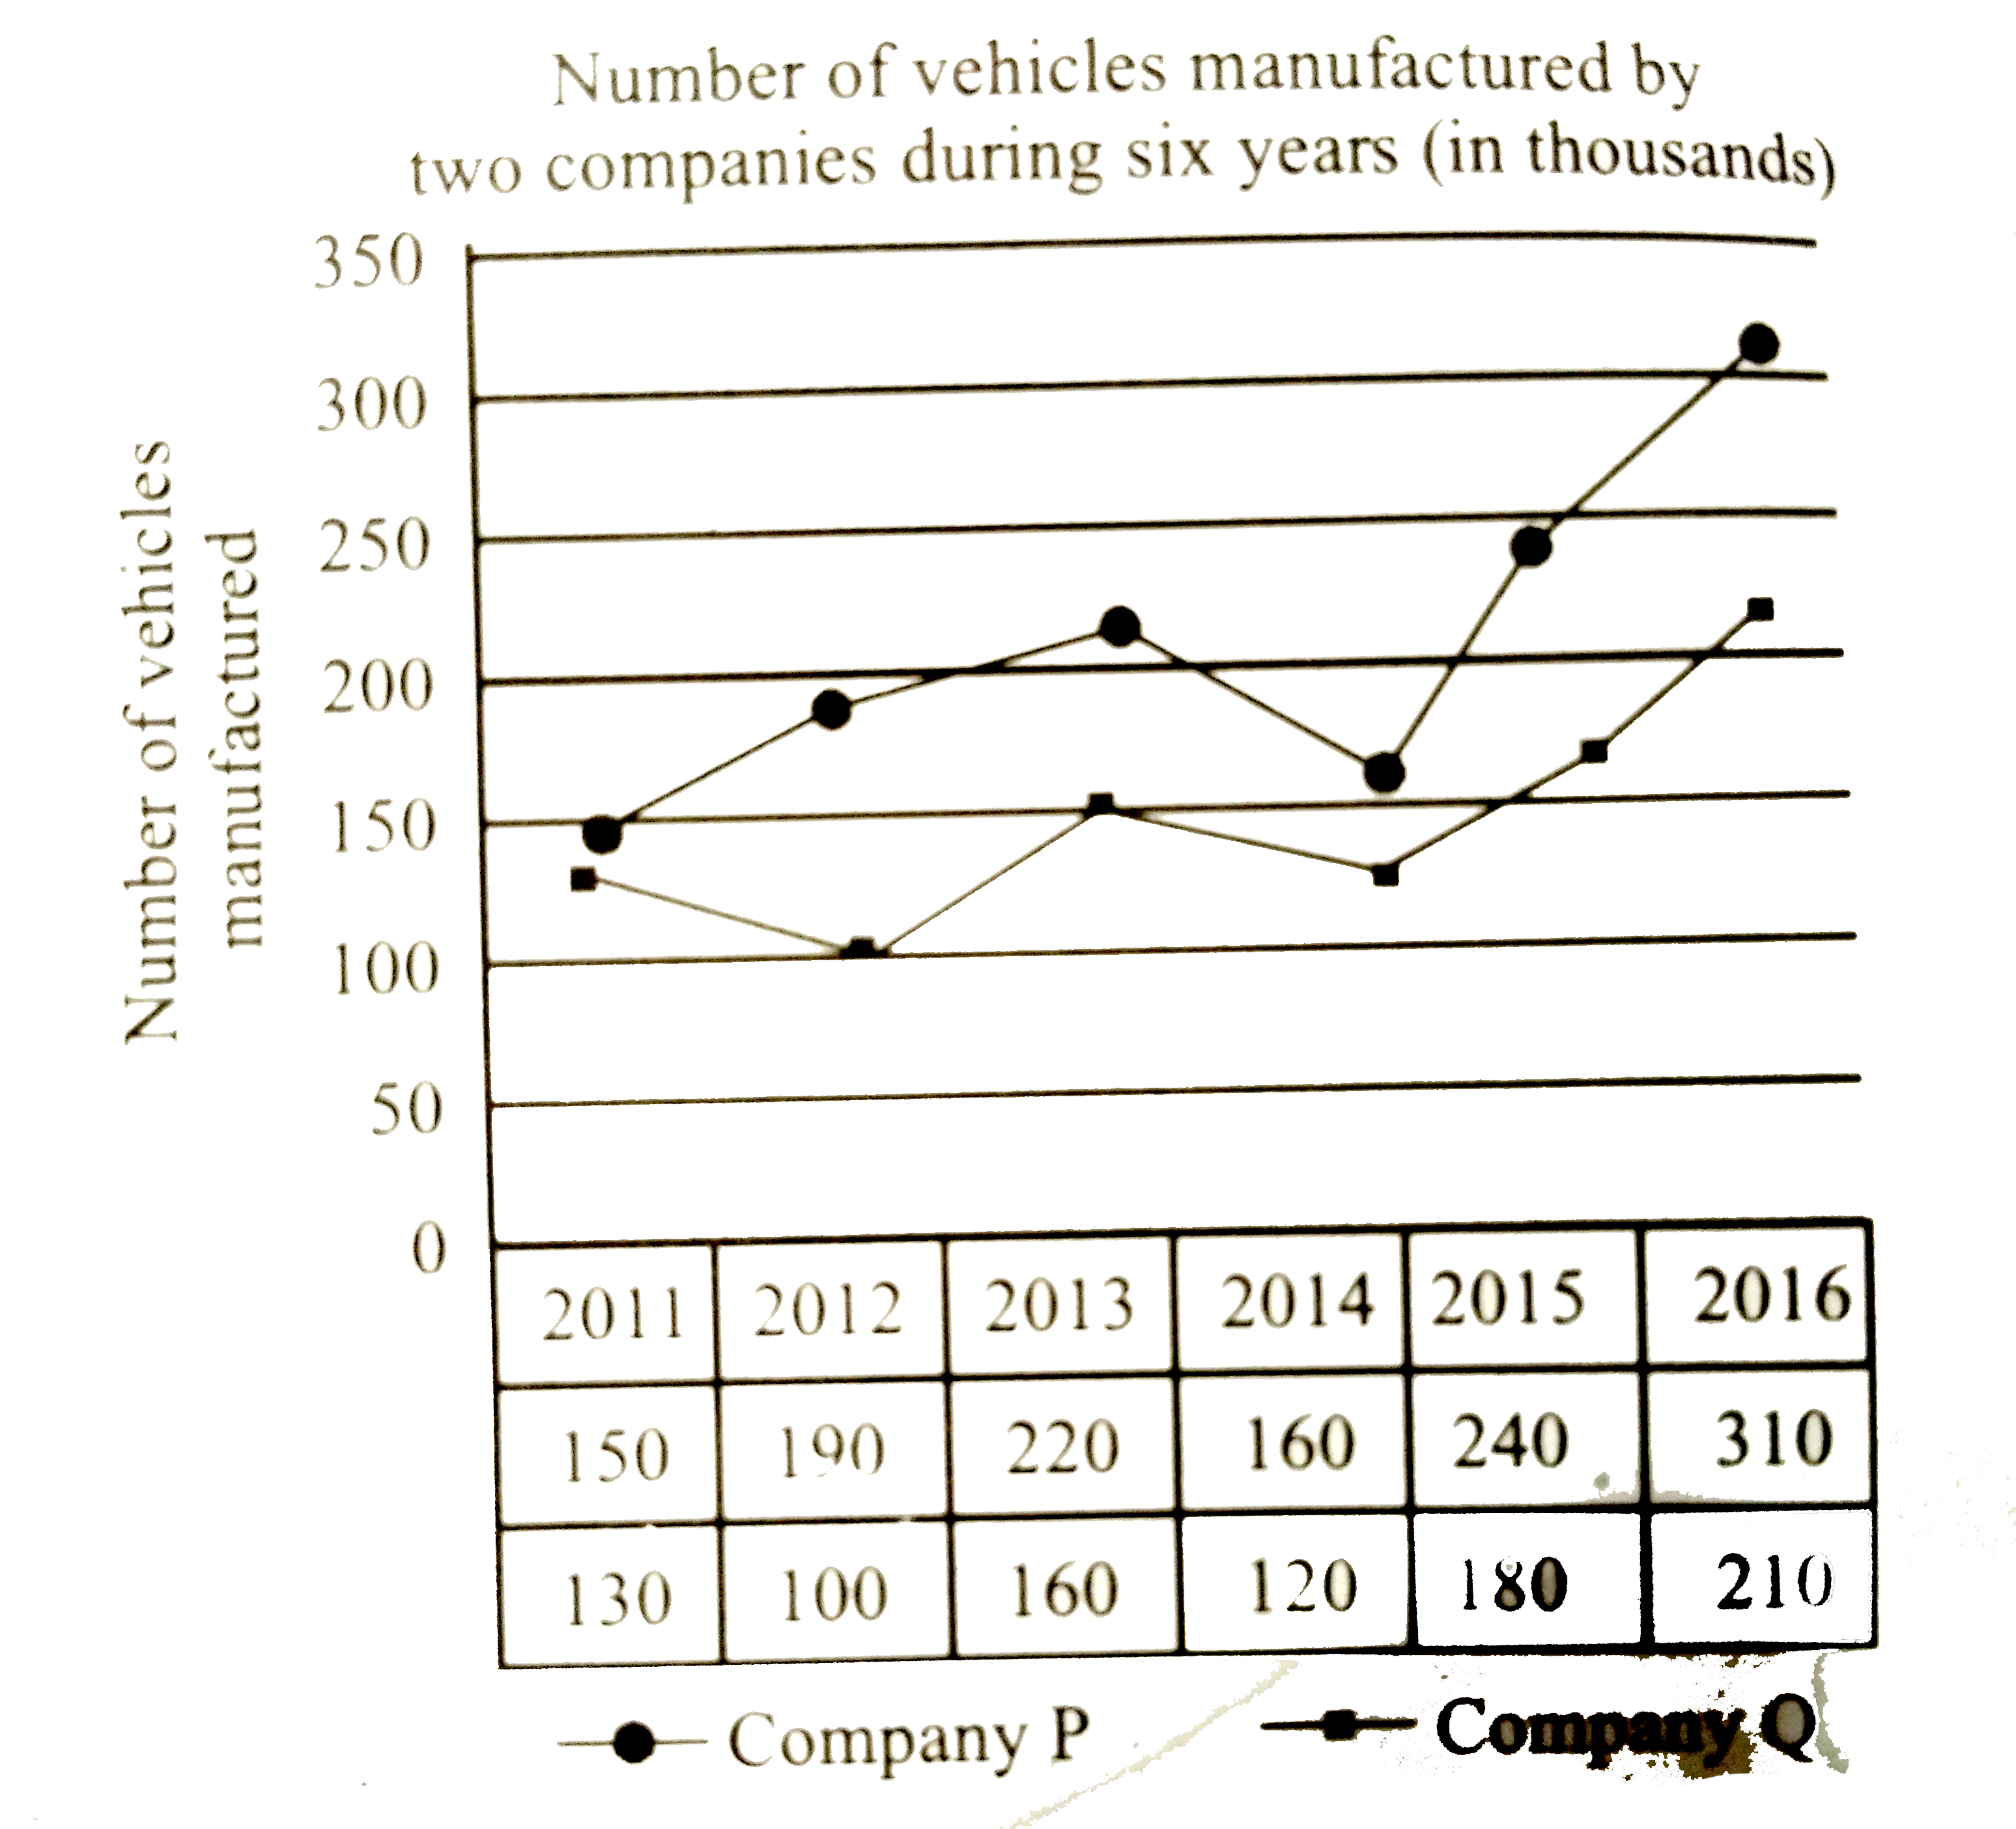
Out of the number of vehicles manufactured by company P in 2015,1500 pieces were found defective and out of the number of vehicles manufactured by company Q in 2016, 10000 pieces were found defective. Wha is the respective ratio of non-defectiv vehicles manufactured by comapny P in 2015 and Q in the 2016 ?View Solution

