Assertion :− velocity time graph of two paticles undergoing head−on collison is shown in the figure. If collision is inelastic then value of y must be less than x.
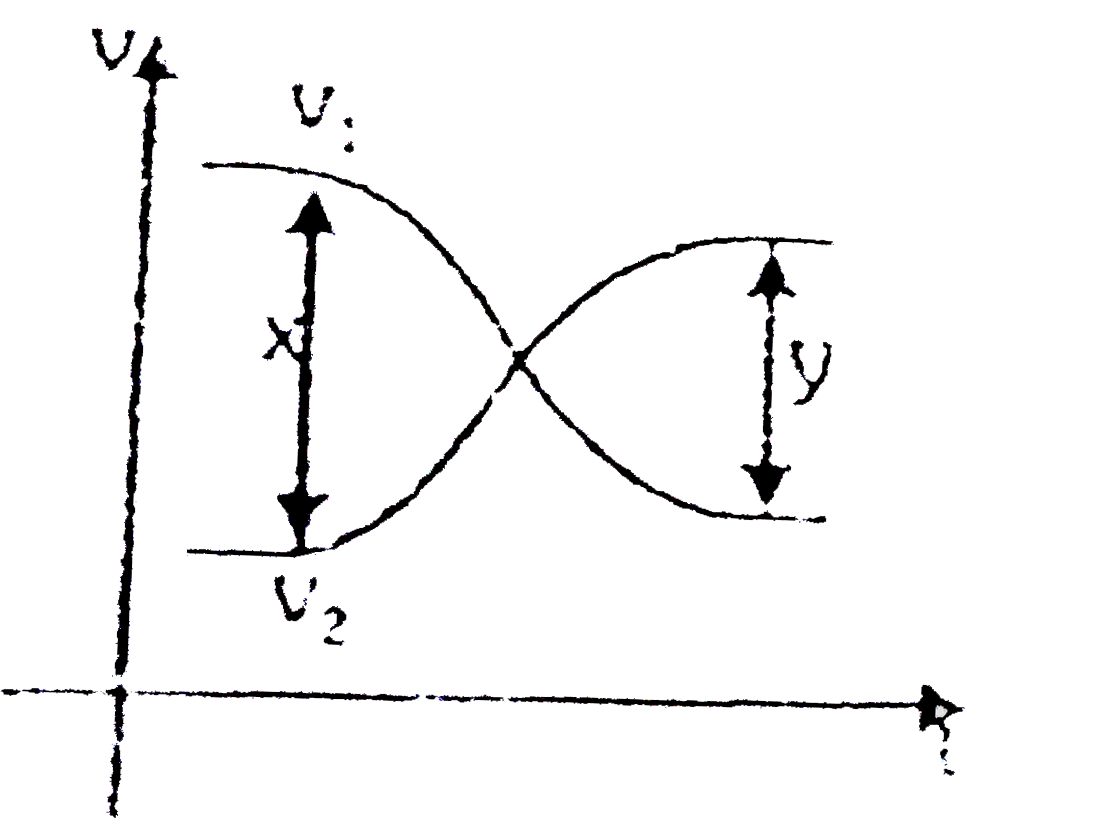
Reason :− Coefficient of restitution(e)=|velocity of separation||velocity of approach|
If both Assertion & Reason are True & the Reason is a correct explanation of the Assertion.
If both Assertion & Reason are True but Reason is not a correct explanation of the Assertiion.
If Assertion is True but the Reason is False.
If both Assertion & Reason are False
The correct Answer is:A
Step by step video, text & image solution for Assertion :- velocity time graph of two paticles undergoing head-on collison is shown in the figure. If collision is inelastic then value of y must be less than x. Reason :- Coefficient of restitution(e)=(|"velocity of separation"|)/(|"velocity of approach"|) by Physics experts to help you in doubts & scoring excellent marks in Class 12 exams.
Updated on:21/07/2023Topper's Solved these Questions
- TEST PAPERBook:ALLENChapter:TEST PAPERExercise:PHYSICS
Explore 4 Videos
- TEST PAPERBook:ALLENChapter:TEST PAPERExercise:PHYSICS
Explore 4 Videos
- SIMPLE HARMONIC MOTIONBook:ALLENChapter:SIMPLE HARMONIC MOTIONExercise:Example
Explore 1 Video
- TEST PAPER 1Book:ALLENChapter:TEST PAPER 1Exercise:PHYSICS
Explore 11 Videos
Similar Questions
Knowledge Check
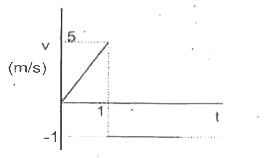
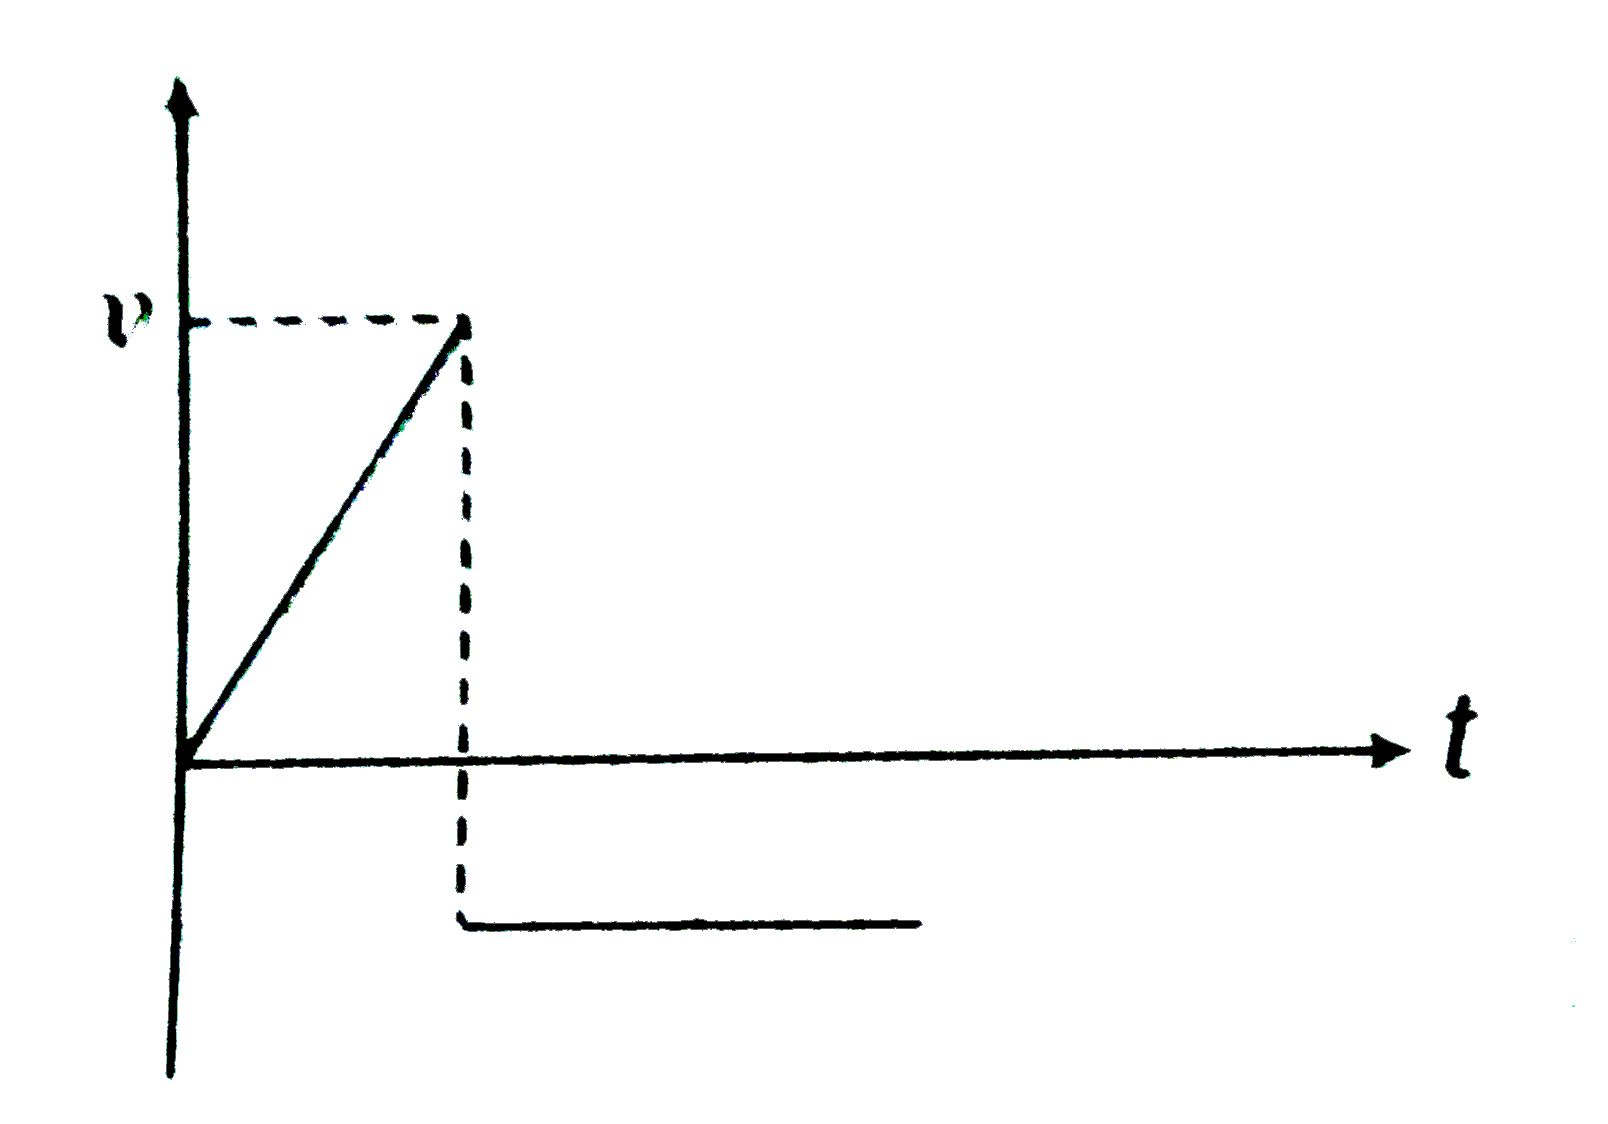
The velocity time graph for a particle moving along X-axis is shown in the figure. The corresponding displacement time graph is correctly shown by
 A
A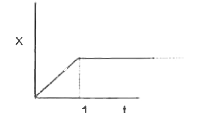 B
B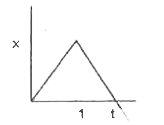 C
C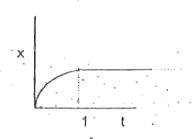 D
D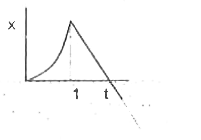
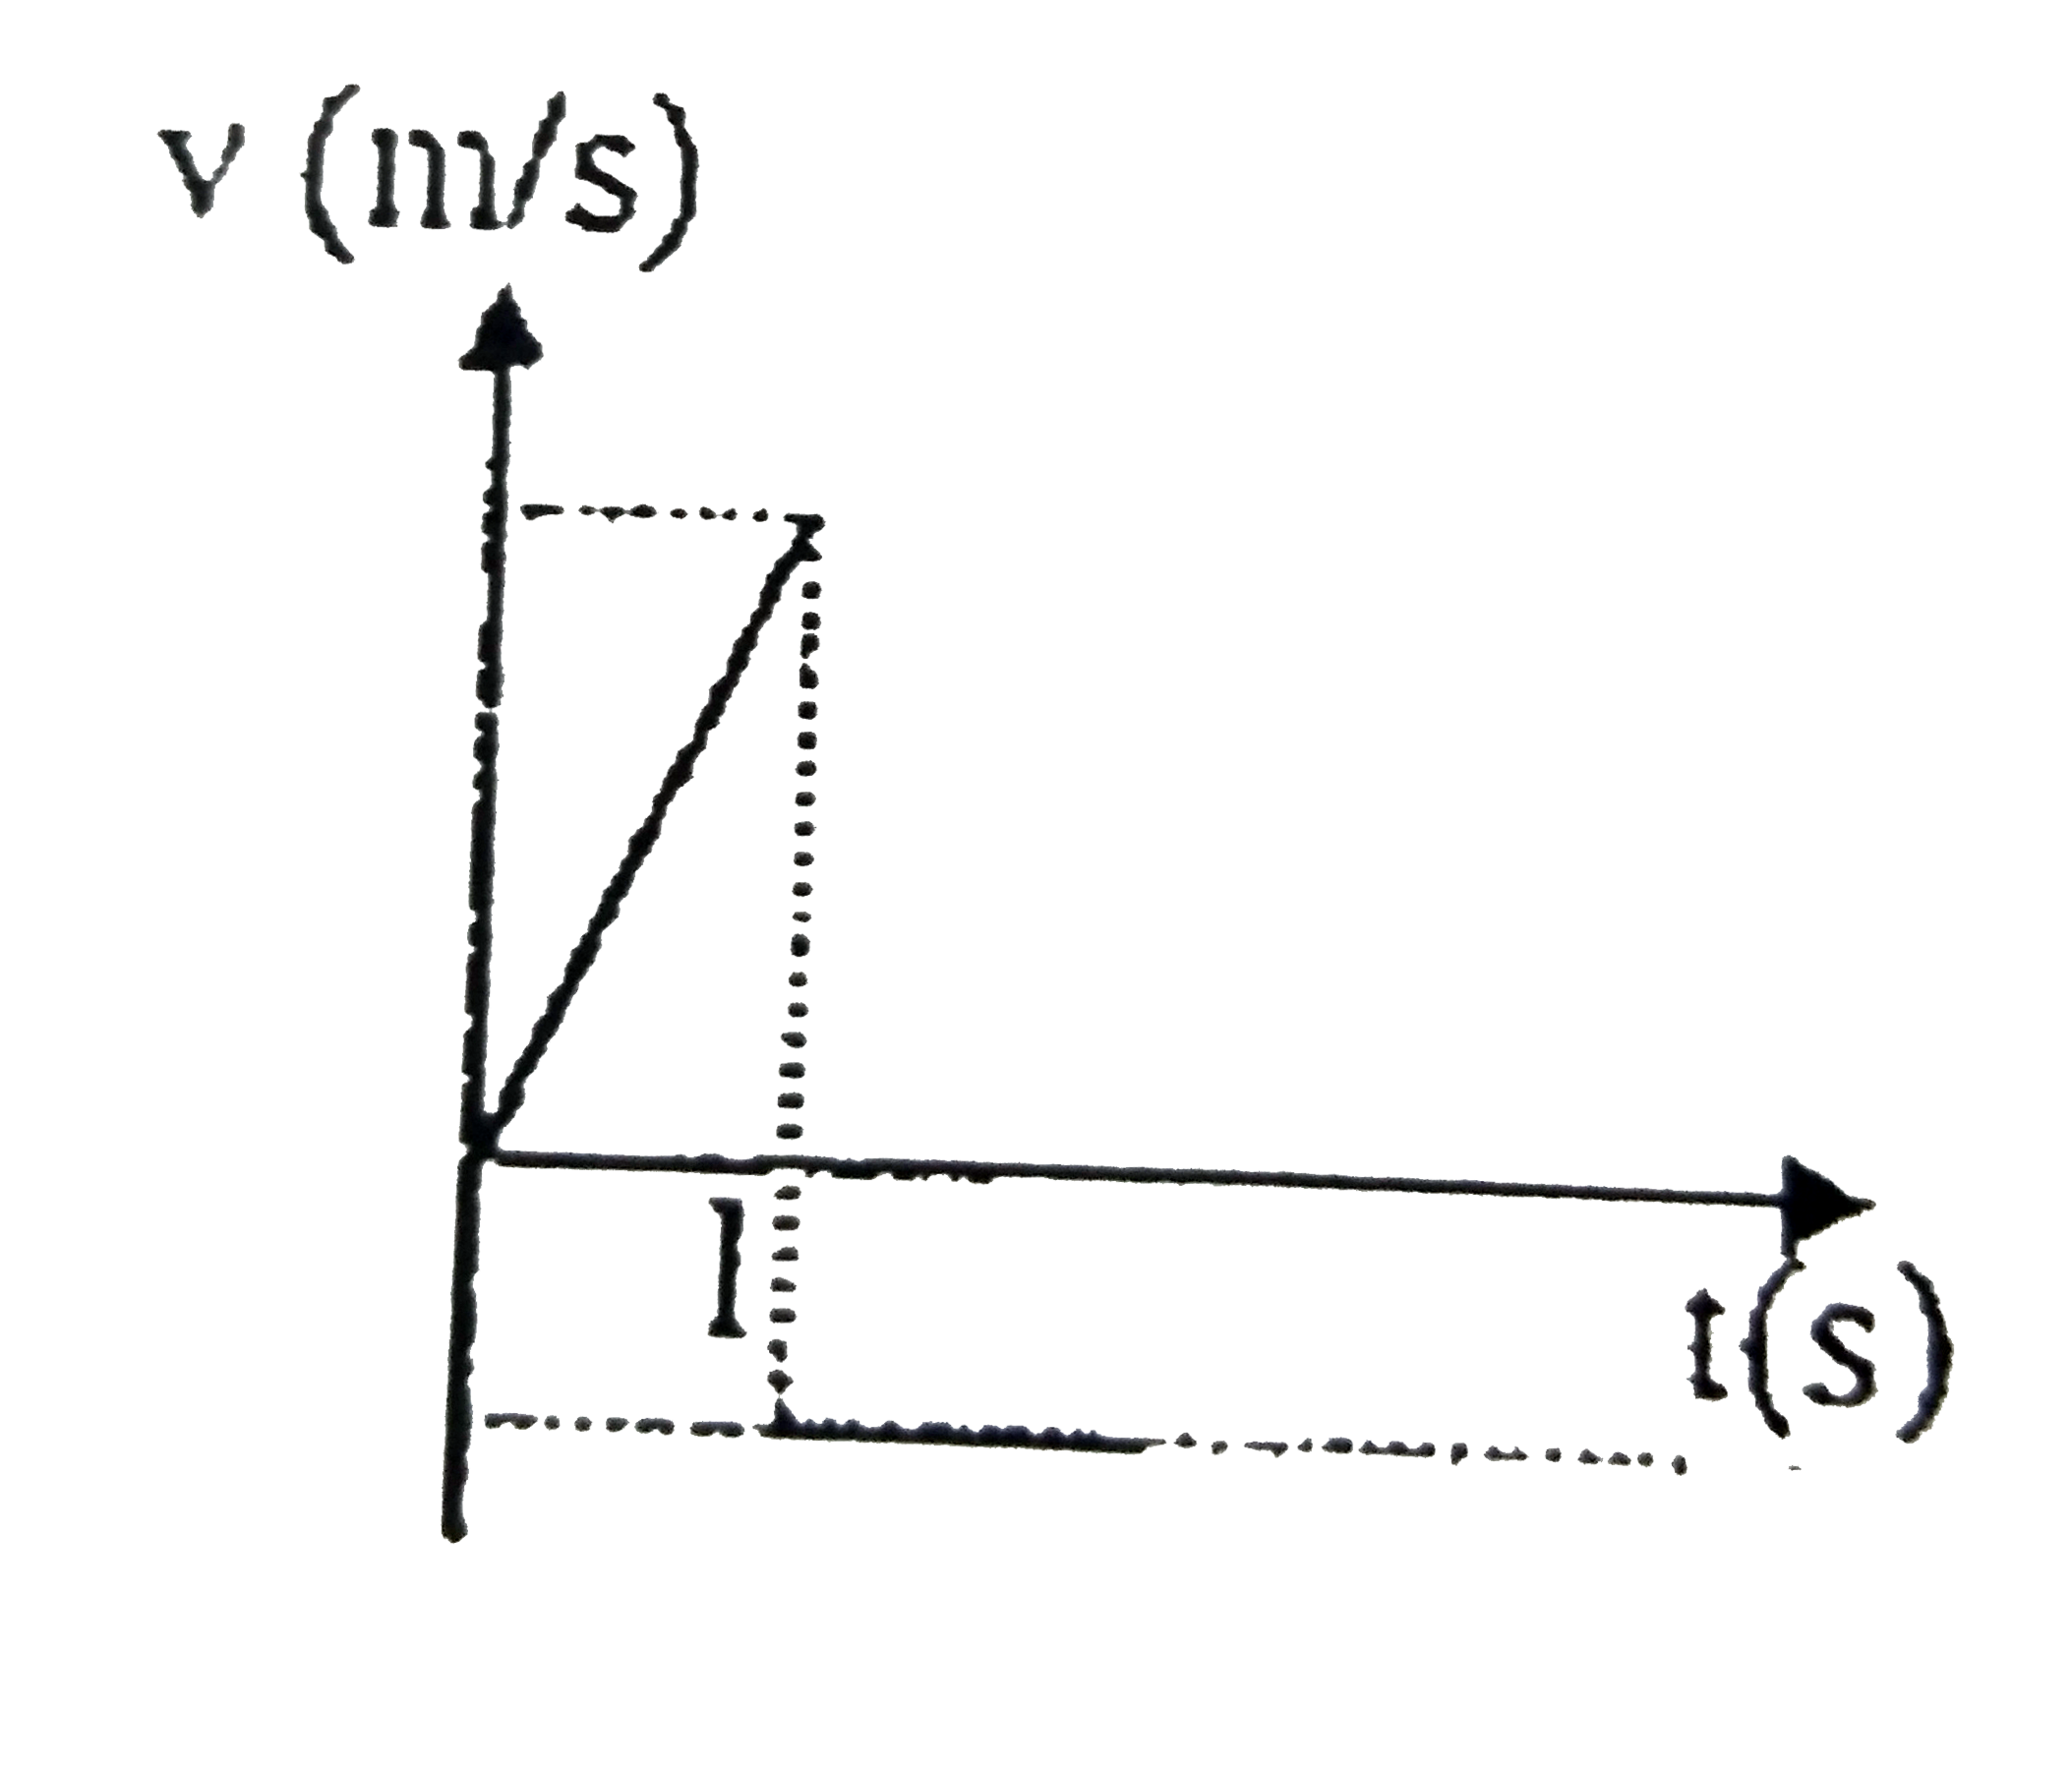
The velocity time graph for a particle moving along x-axis is shown in the figure. The corresponding displacement time graph is correctly shown by
 A
A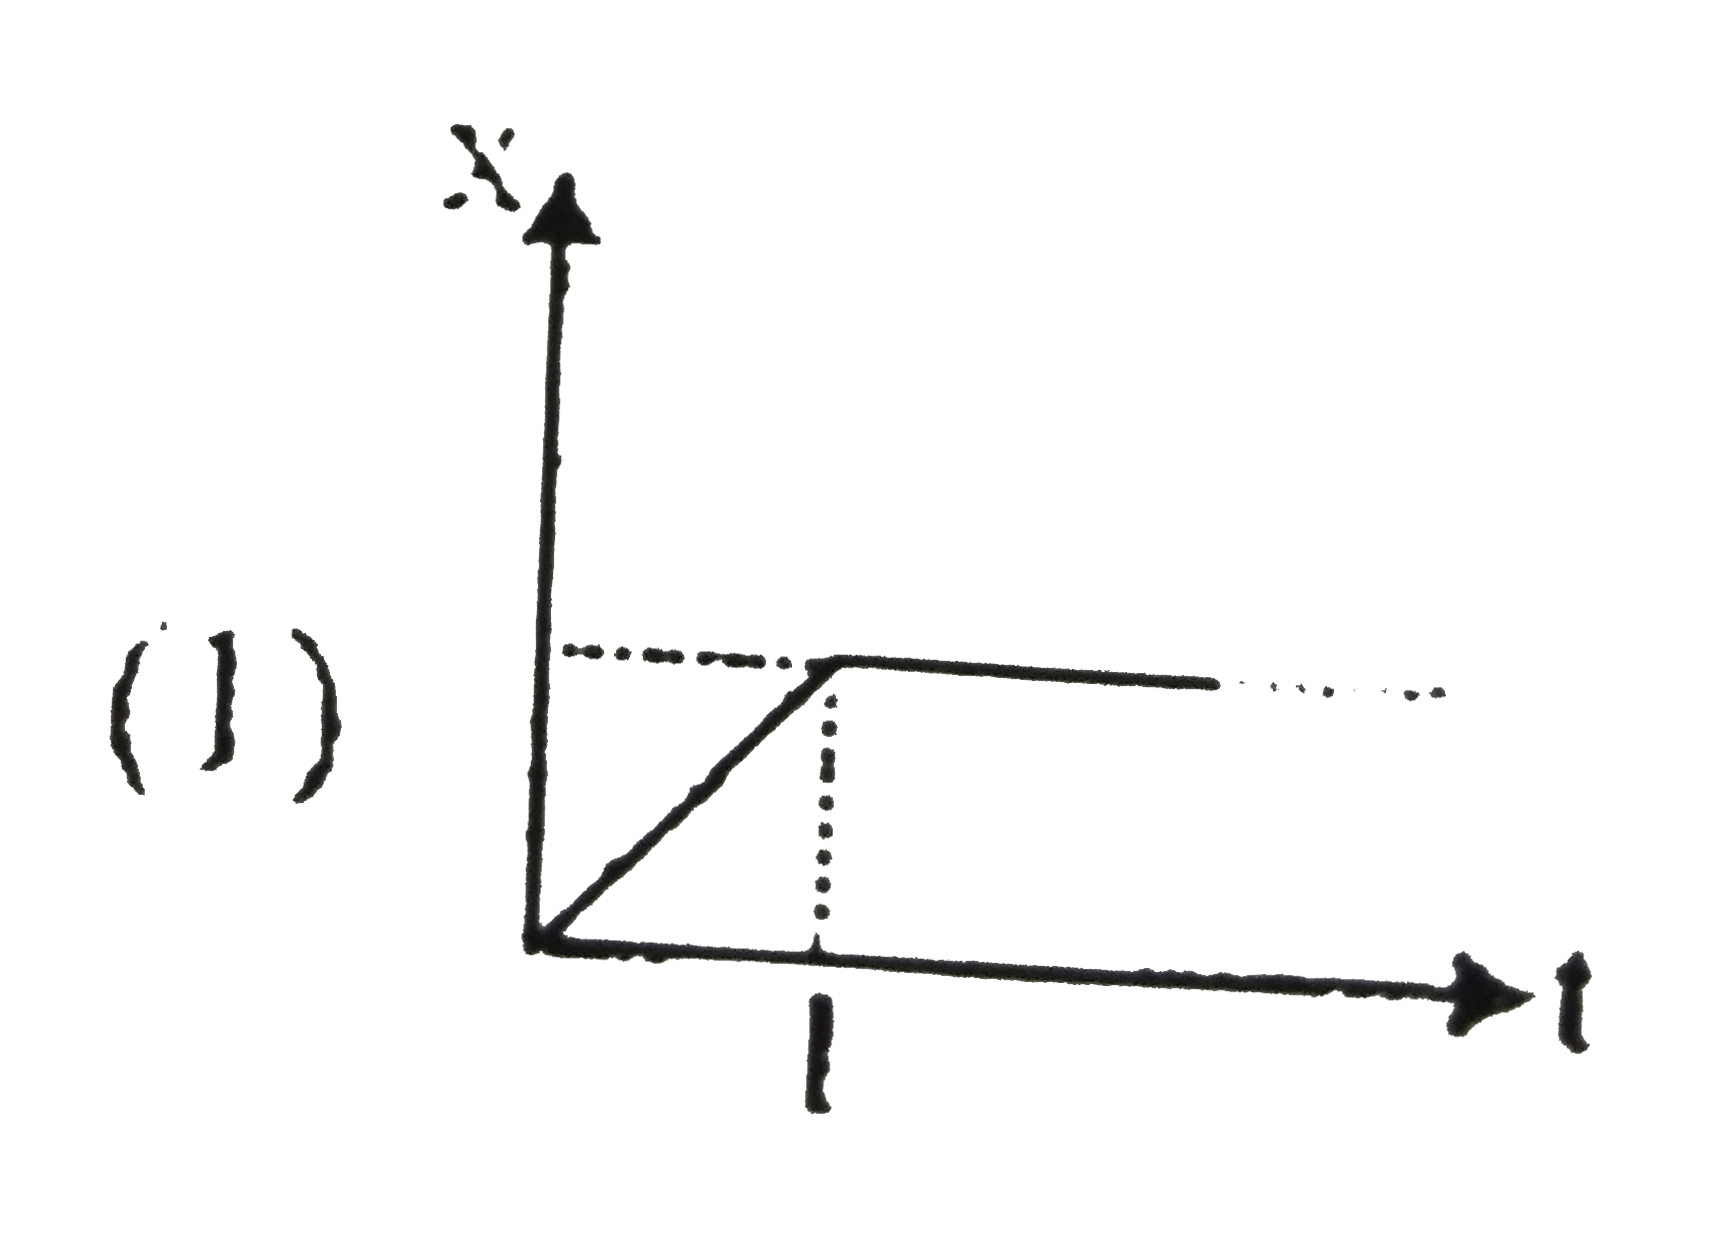 B
B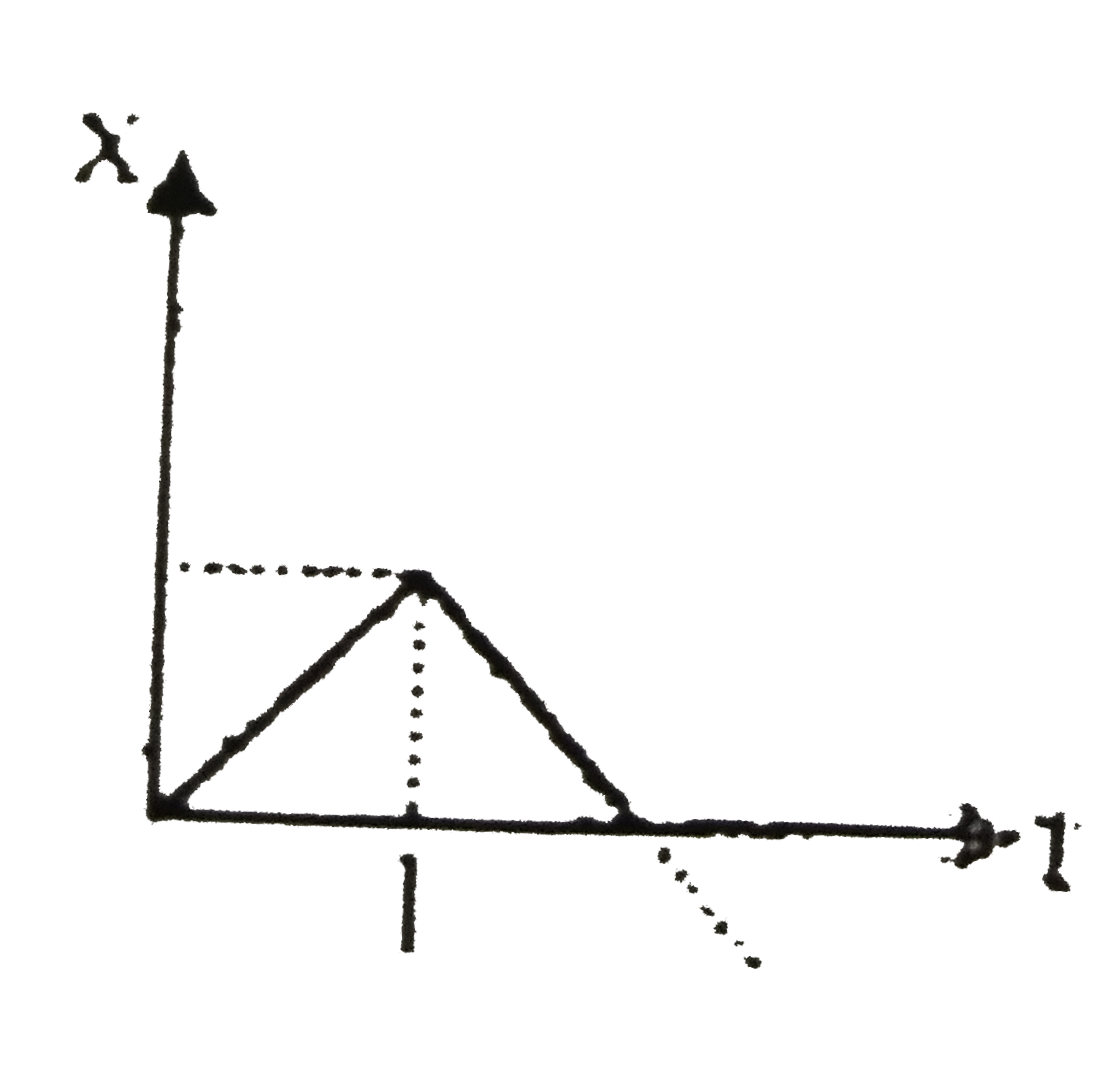 C
C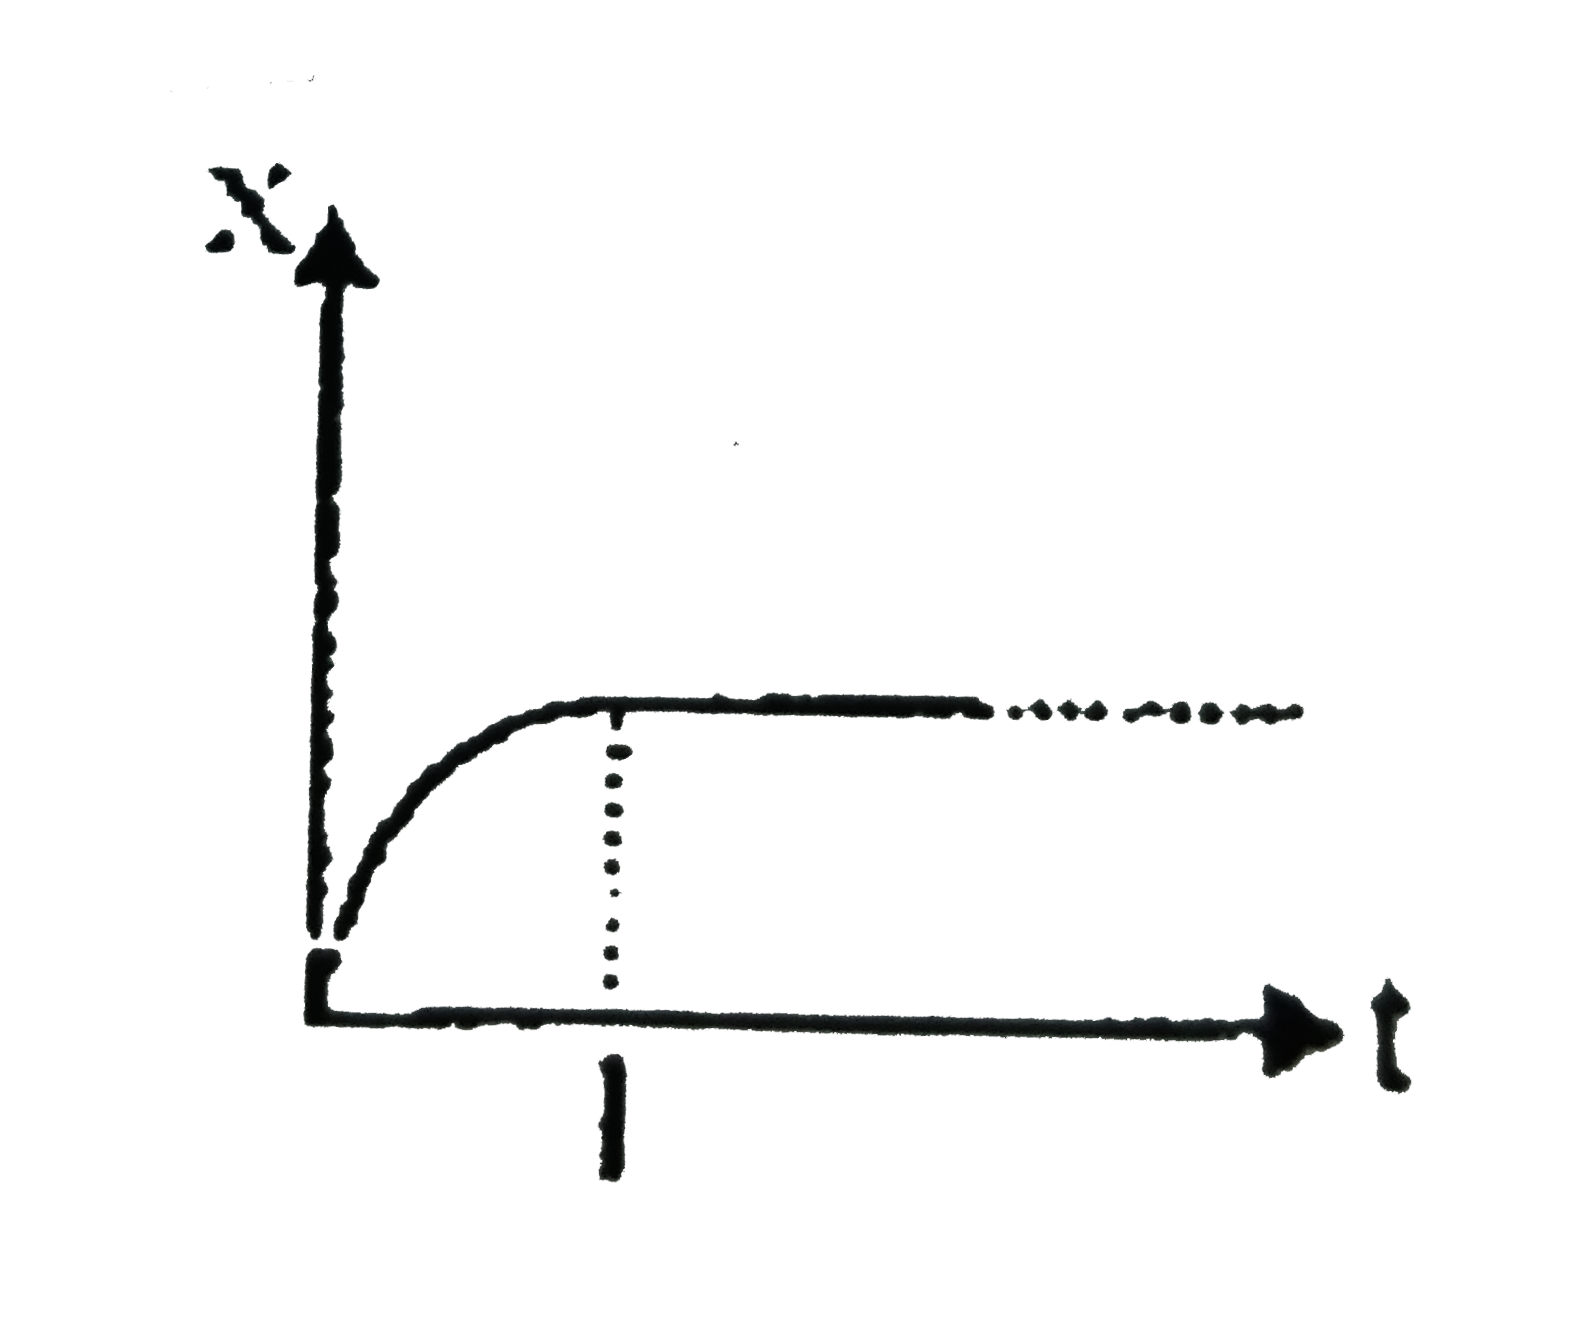 D
D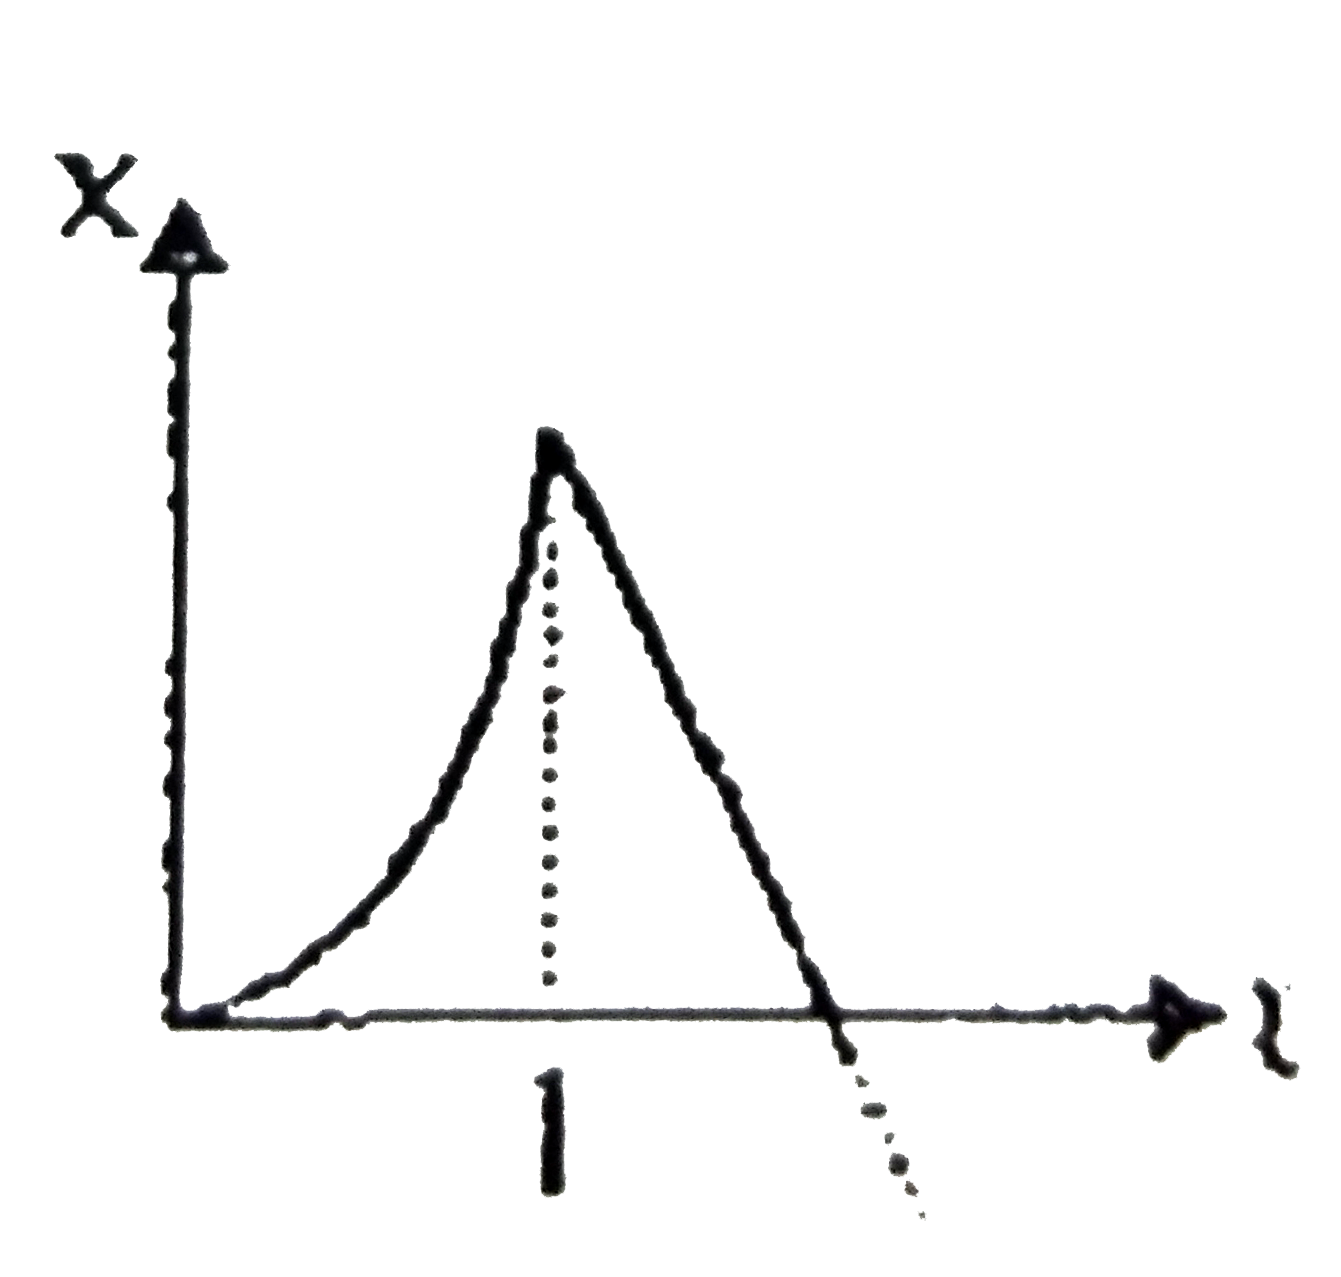
The velocity-time graph for a particle moving along X-axis is shown in the figure. The corresponding displacement-time graph is correctly shown by
 A
A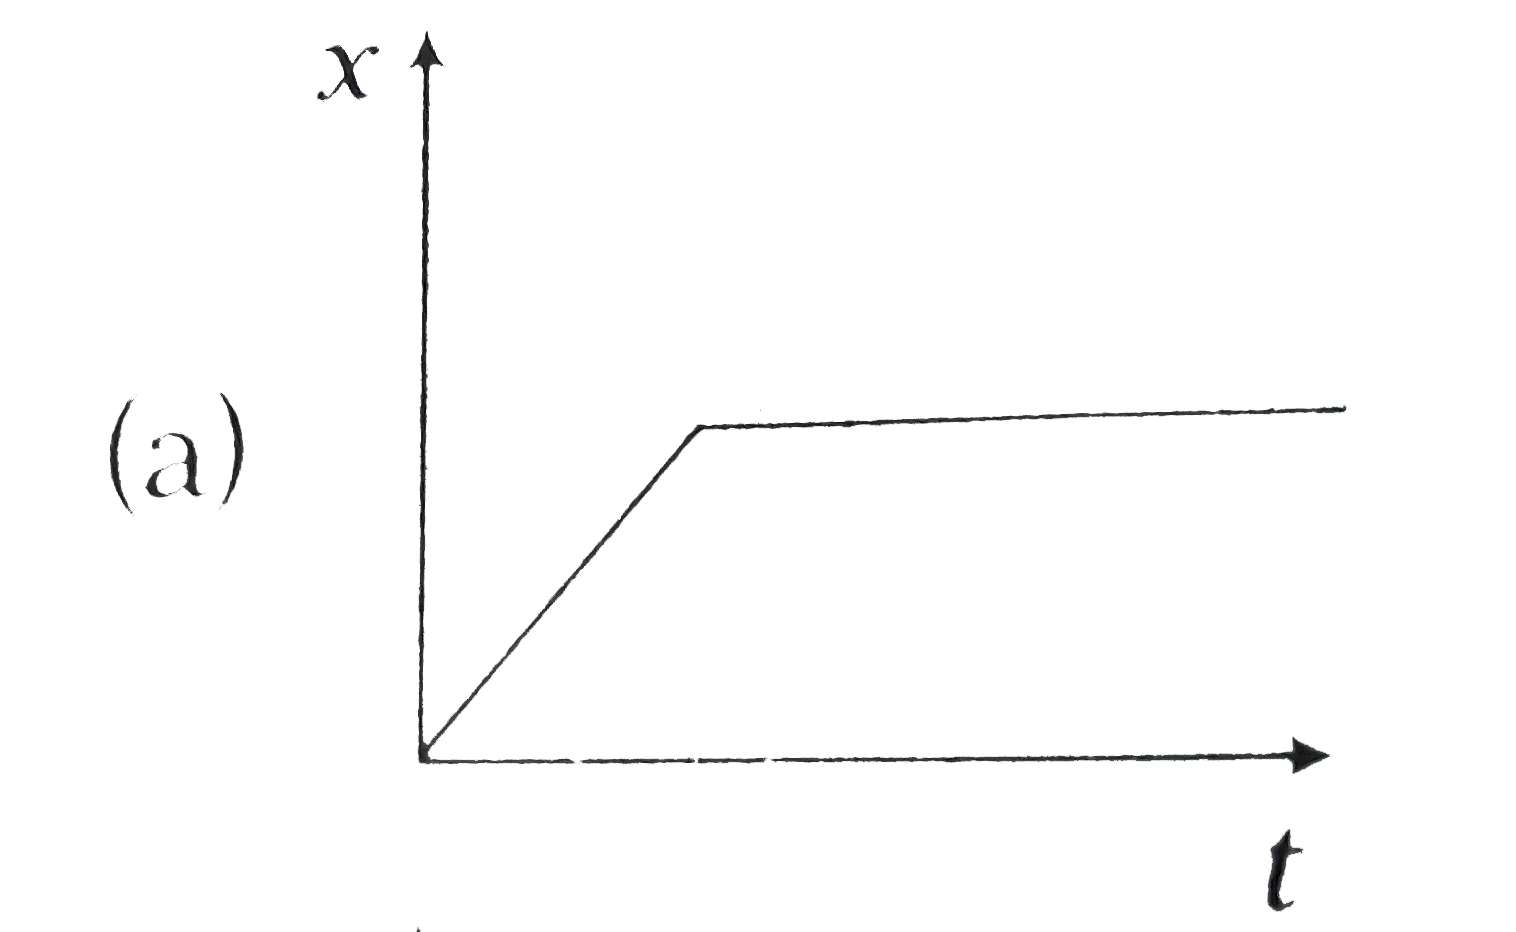 B
B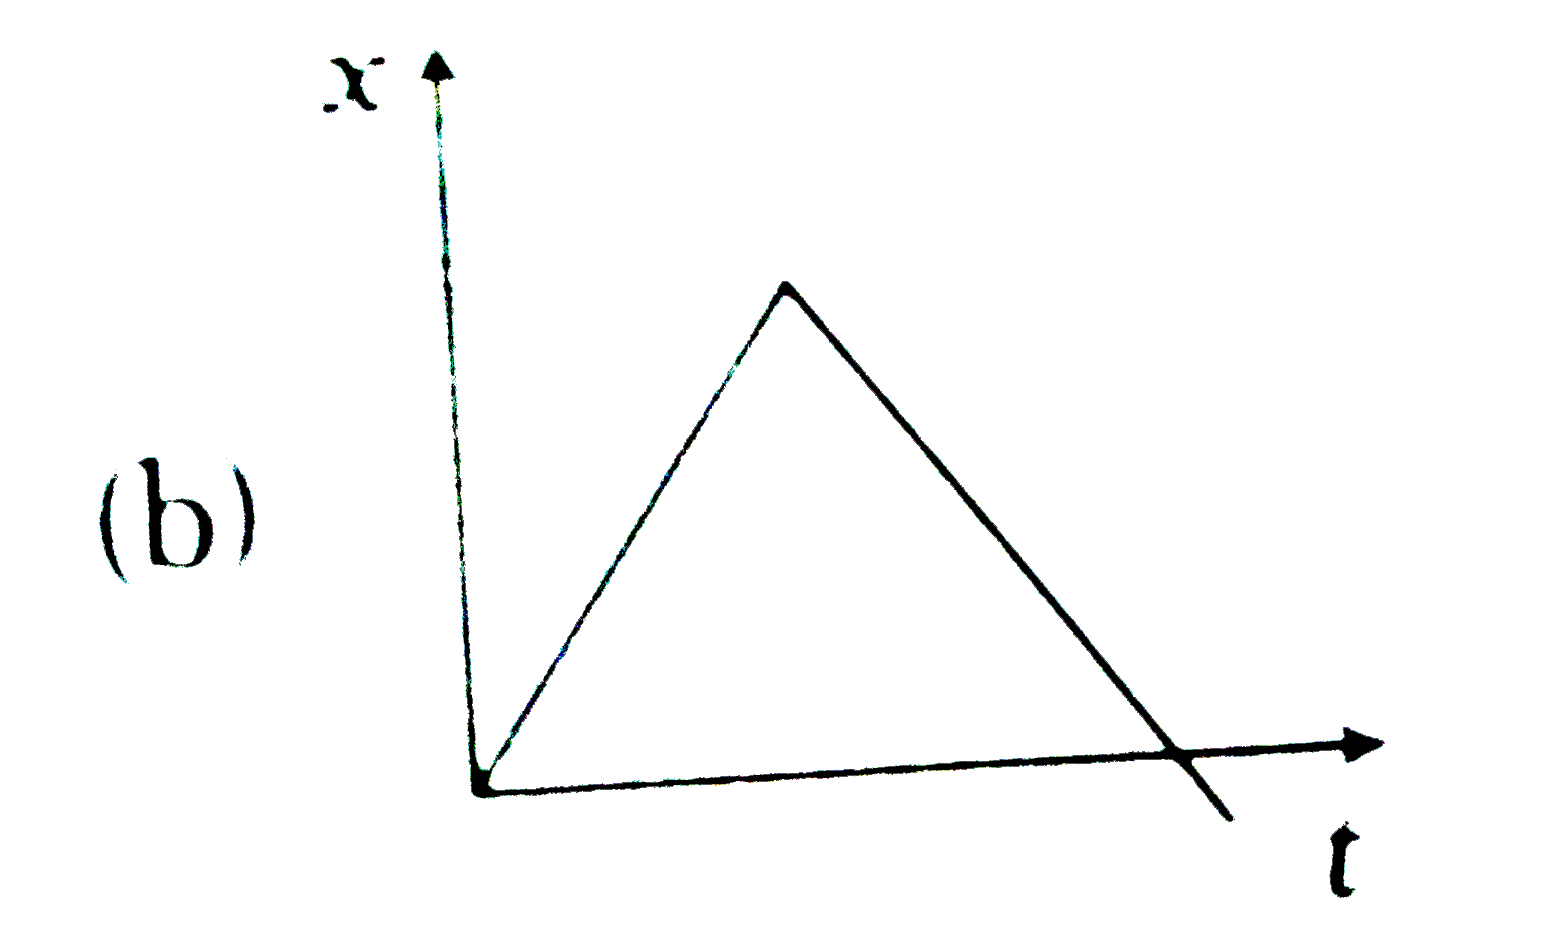 C
C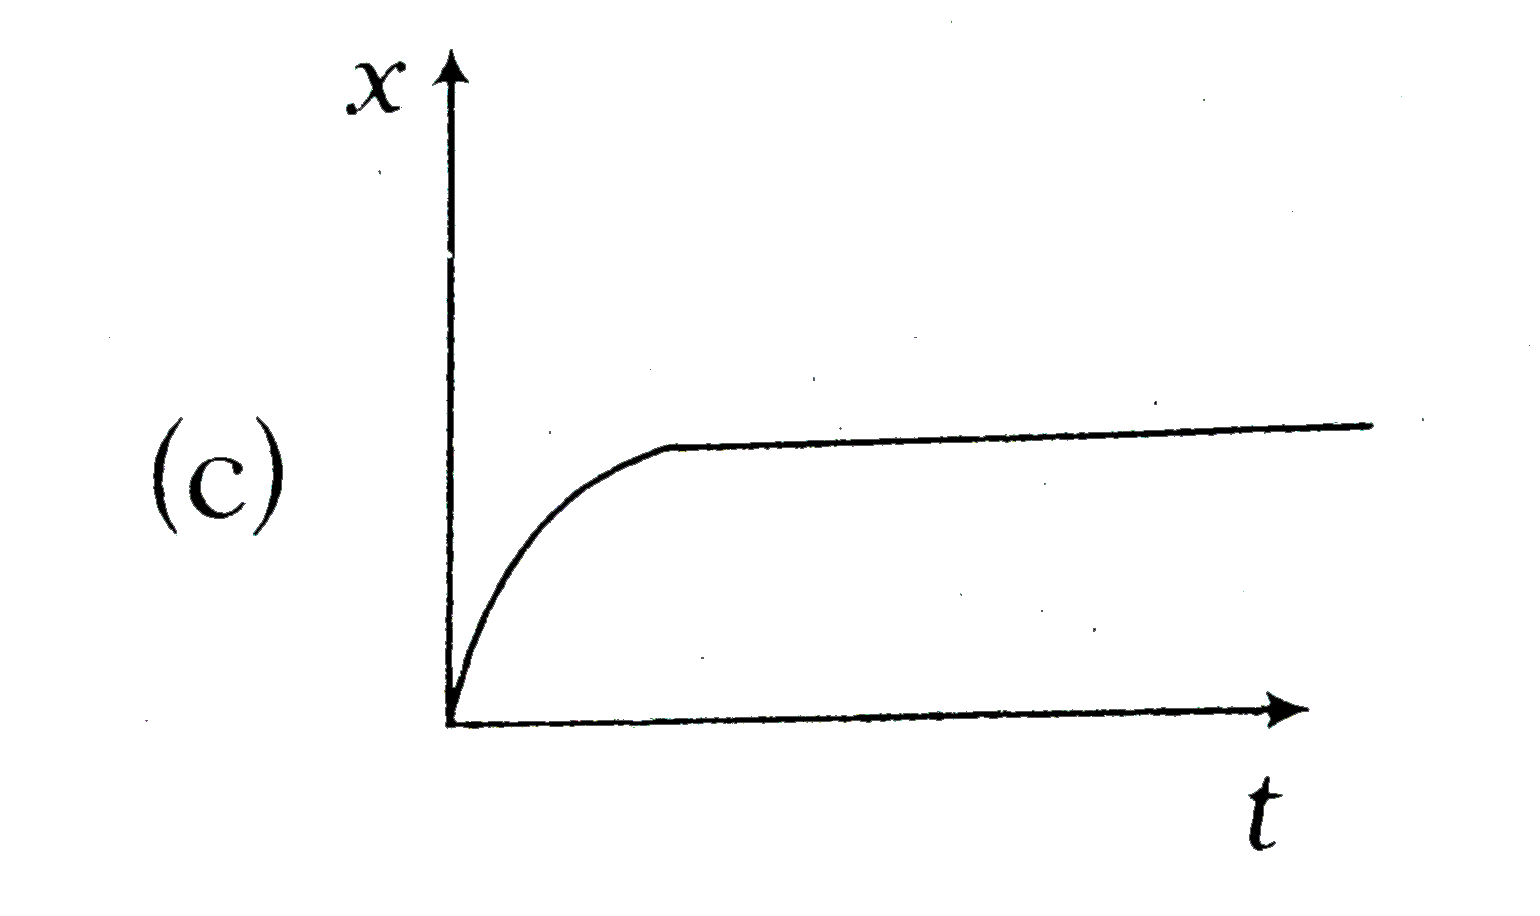 D
D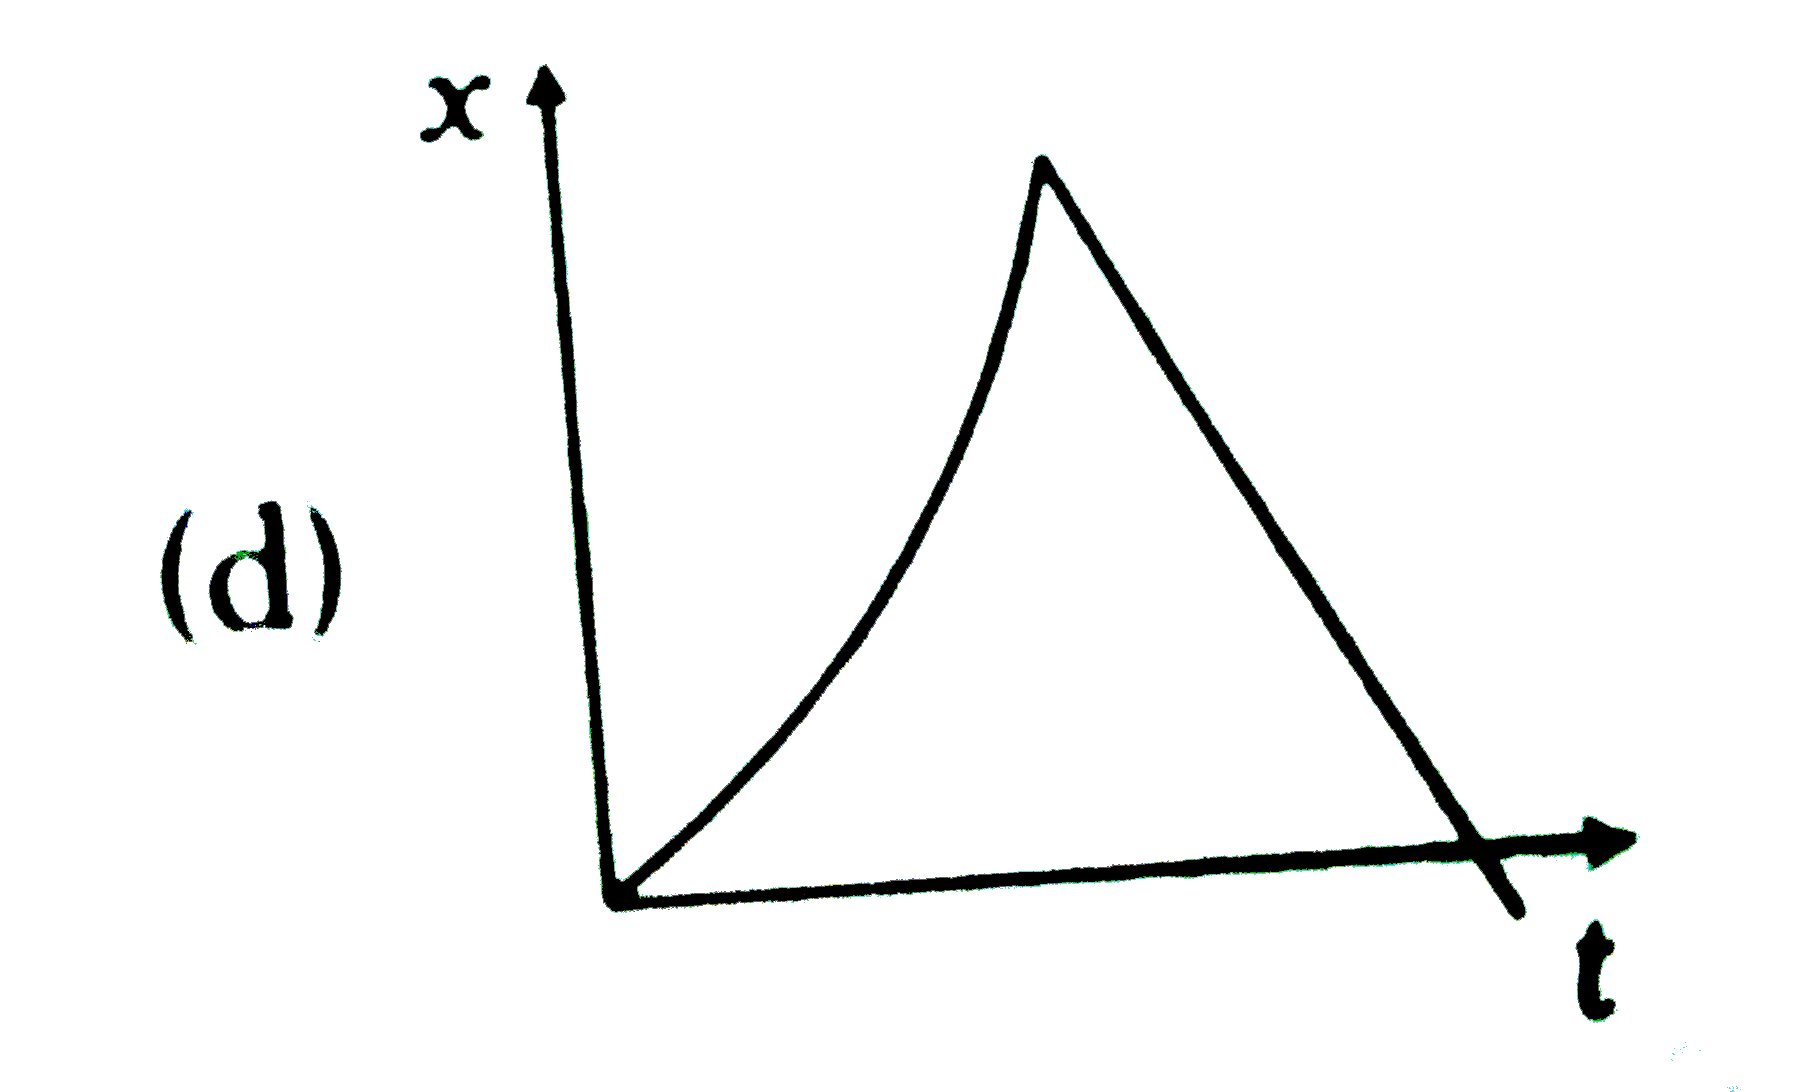
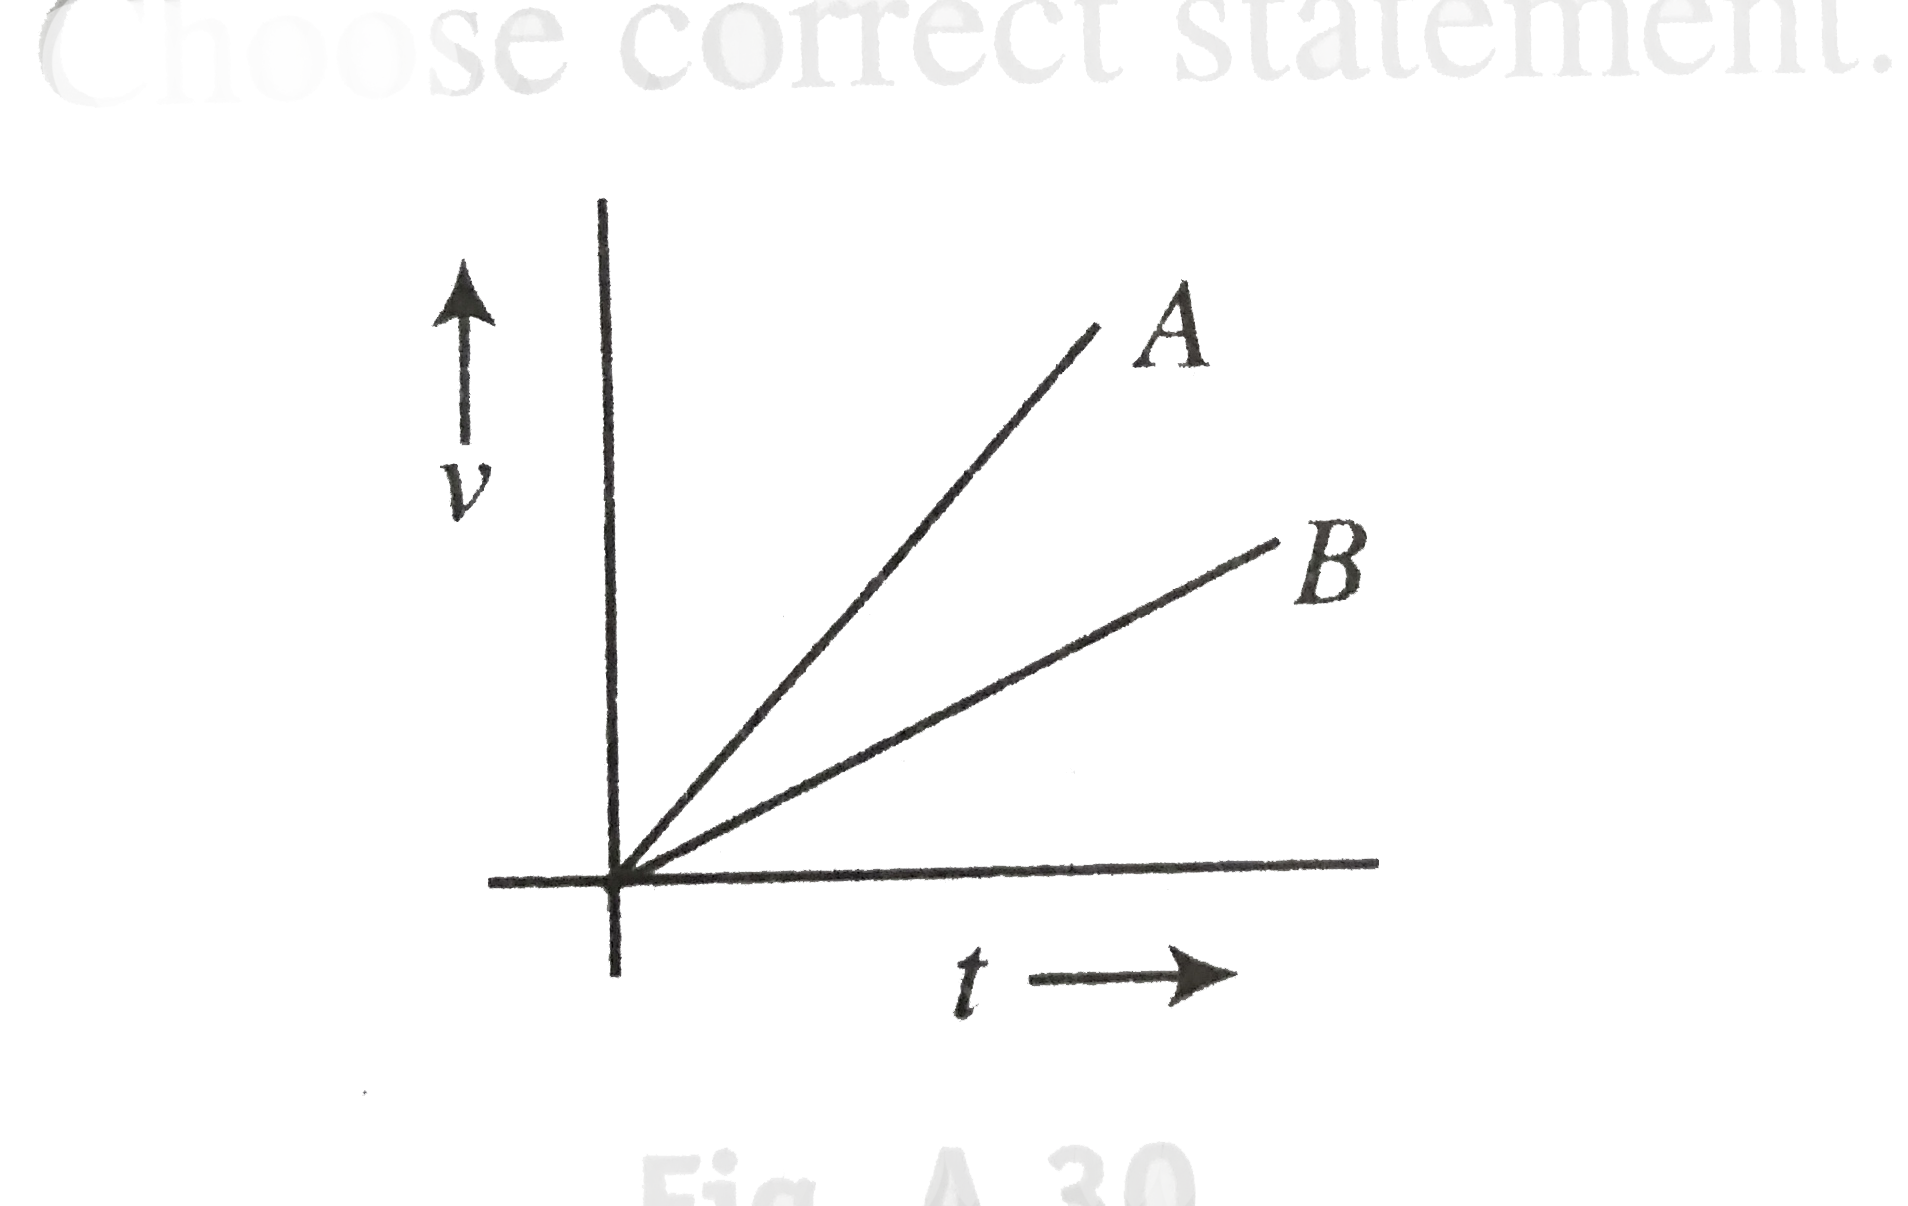
The velocity - time graph of two bodies A and B is shown in figure. Choose correct statement.
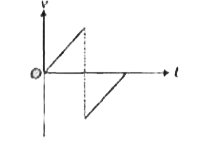
View SolutionThe velocity (v) - time (t) graph for a particle moving along x - axis is shown in the figure. The corresponding position (x) - time (t) is best represented by
View SolutionThe velocity - time graph of a particle of mass 10 kg is shown in the figure. The net work done on the particle in the first two seconds of the motion is

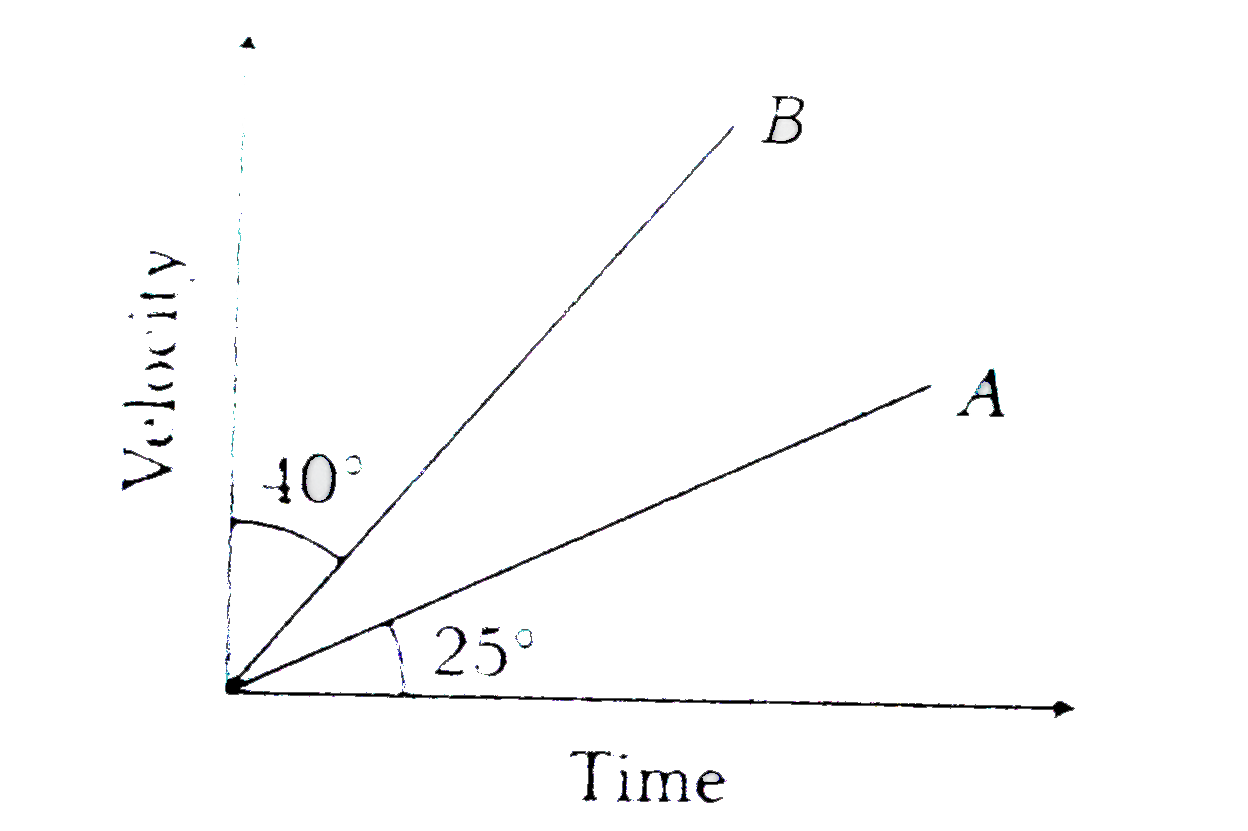
View SolutionThe velocity - time graph for two bodies A and B are shown in figure. Then, the acceleration of A and B are in the ratio
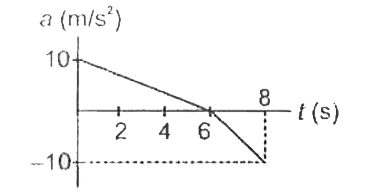
View SolutionThe acceleration - time graph for a particle moving along x - axis is shown in figure, If the initial velocity of particle is −5m/s, the velocity at t = 8 s is
View Solution


