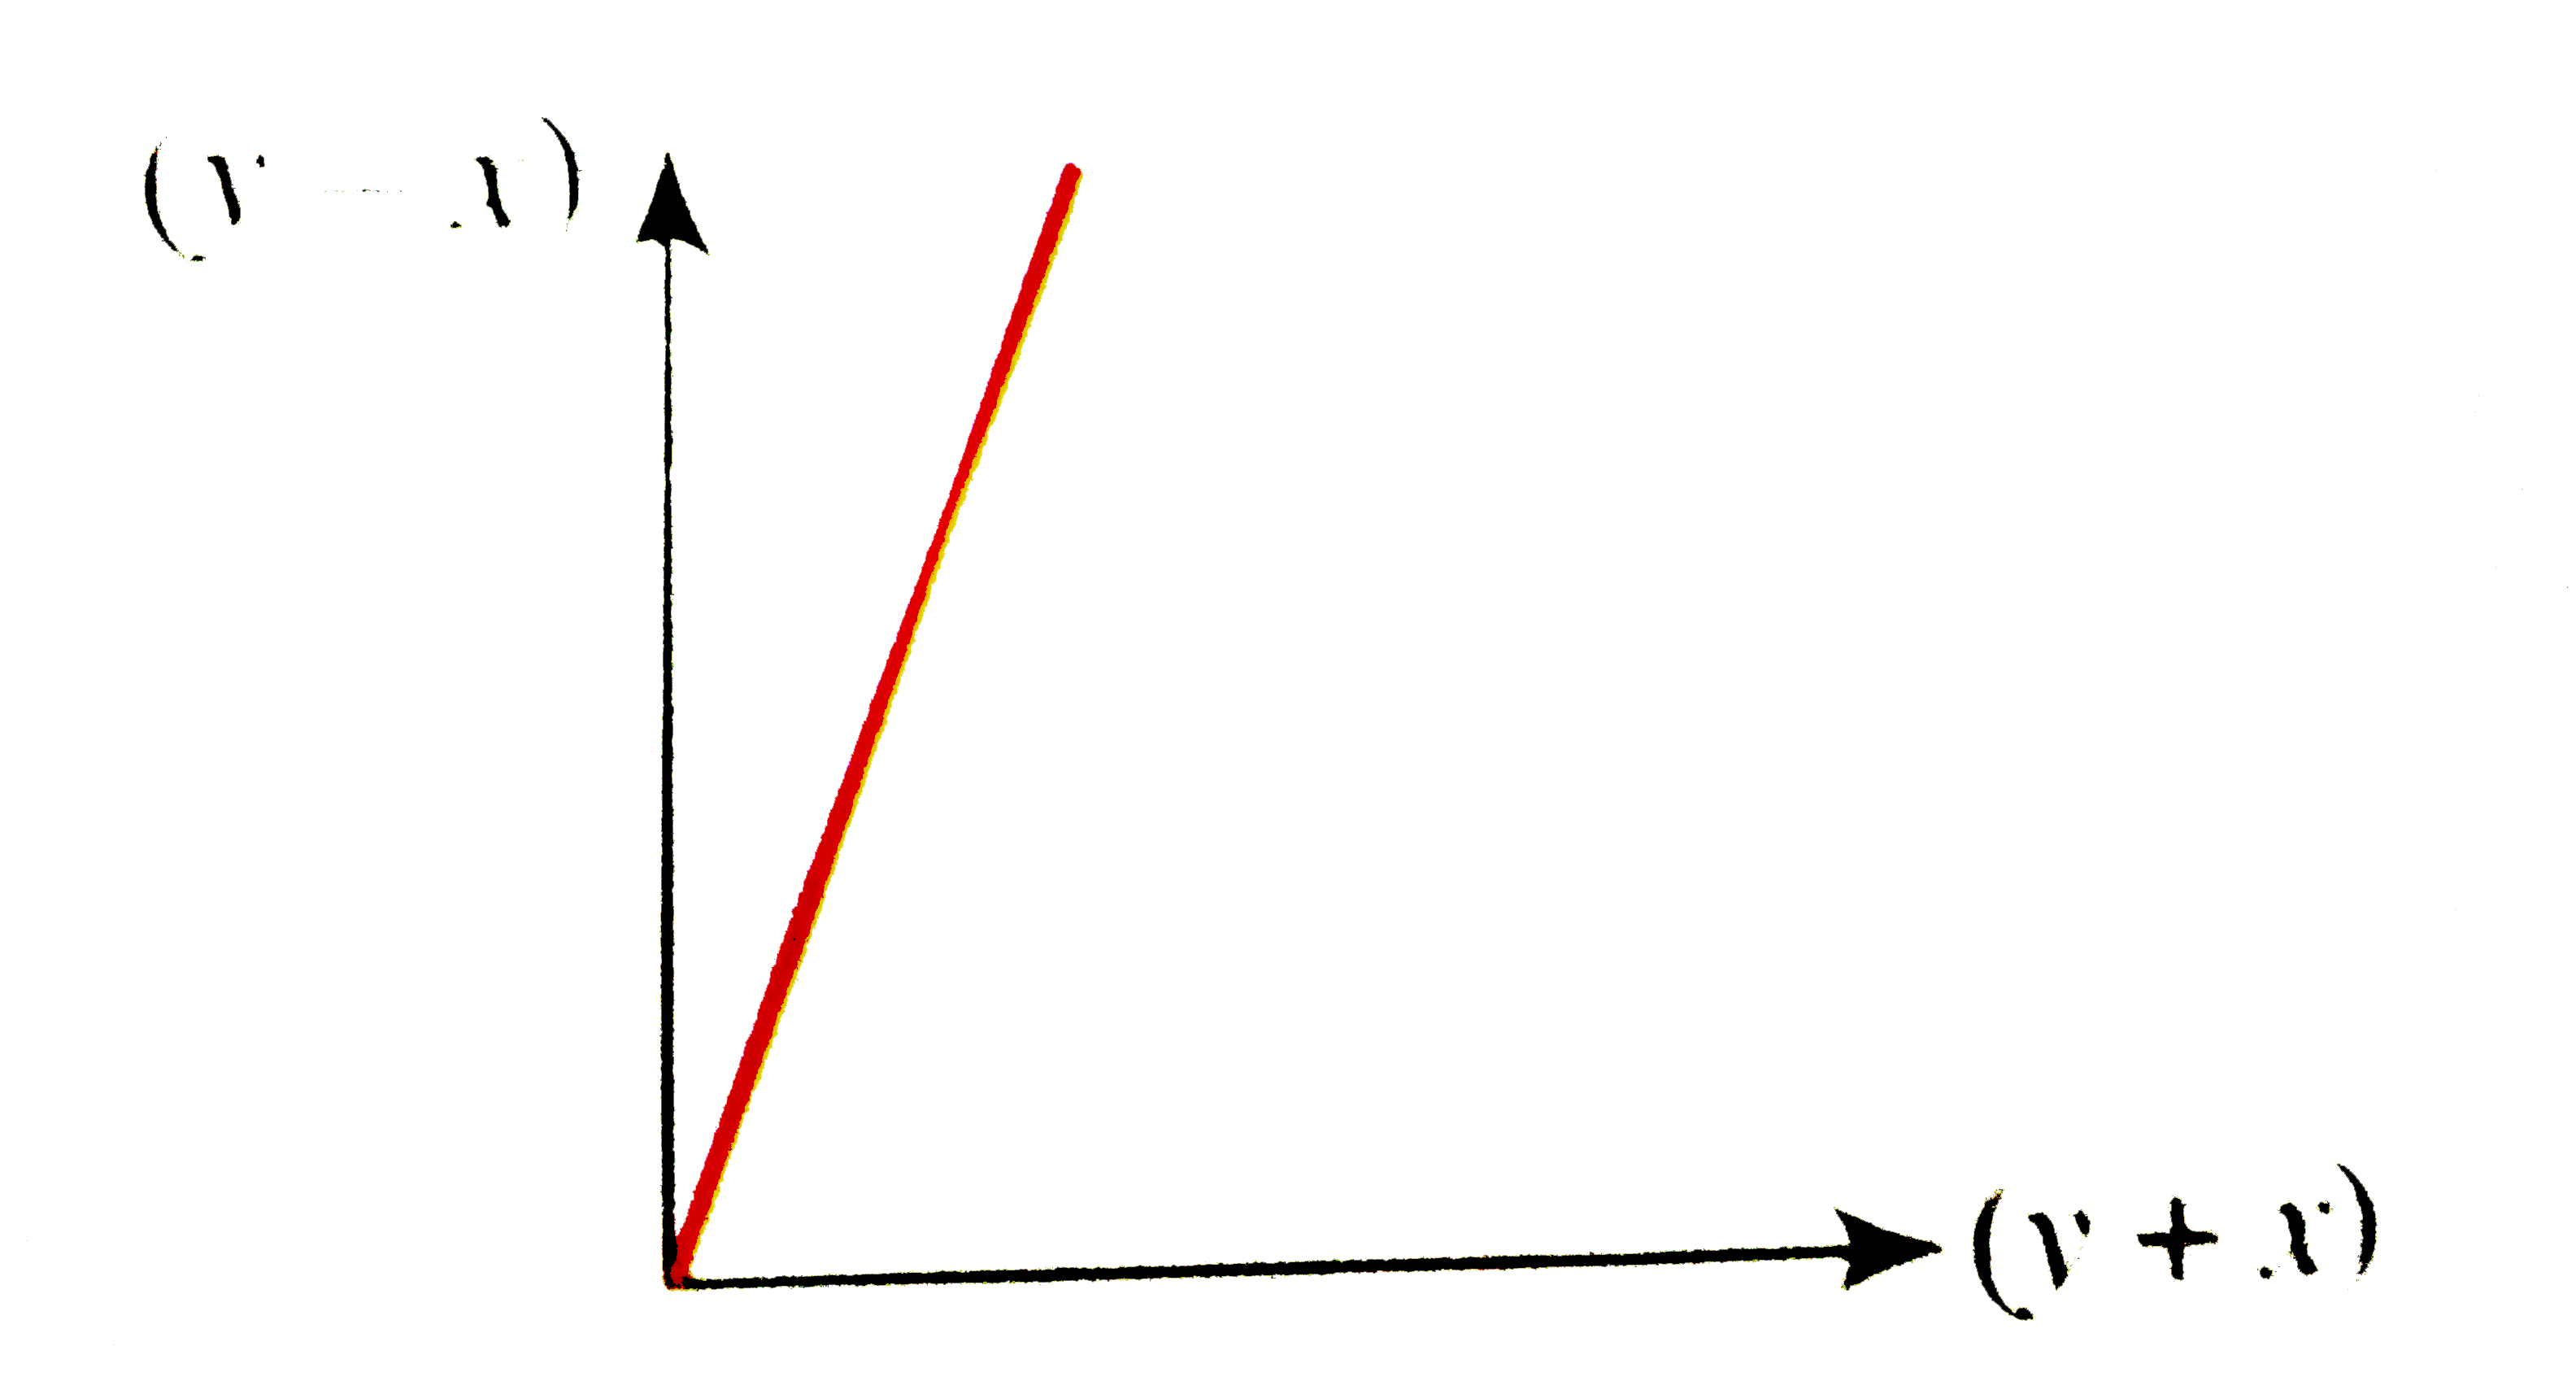
The graph shows a linear relation between variable y and x. Consider two quantities p and q defined by the equations.
p=yx
q=y−bx

As x changes from zero to a, which of the following statements are correct according to the graph?
Quantity p increases and q decrease.
Quantity p decrease and q increases
Quantity p decreases and q remain constant
Quantity p increases and q remain constant.
The correct Answer is:C
q is slope of given line, which is a constant for a straight line.
p is slope of the line joing origin and point on the kine, which decreases as x increases.
Topper's Solved these Questions
- MISCELLANEOUSBook:ALLENChapter:MISCELLANEOUSExercise:Part -II Example
Explore 61 Videos
- MISCELLANEOUSBook:ALLENChapter:MISCELLANEOUSExercise:Part -II Example Some worked out Examples
Explore 1 Video
- KINEMATICS (MOTION ALONG A STRAIGHT LINE AND MOTION IN A PLANE)Book:ALLENChapter:KINEMATICS (MOTION ALONG A STRAIGHT LINE AND MOTION IN A PLANE)Exercise:BEGINNER S BOX-7
Explore 8 Videos
- PHYSICAL WORLD, UNITS AND DIMENSIONS & ERRORS IN MEASUREMENT Book:ALLENChapter:PHYSICAL WORLD, UNITS AND DIMENSIONS & ERRORS IN MEASUREMENT Exercise:EXERCISE-IV
Explore 8 Videos
Similar Questions
Knowledge Check
The solution of the equation px+qy=m and qx+py=n is
Ax=q2−p2mp−nq,y=p2−q2np−mqBx=p2−q2mp−nq,y=q2−p2np−mqCx=p2−q2mp−nq,y=p2−q2np−mqDx=q2−p2mp−nq,y=q2−p2np−mq
The solution of the equation px+qy=m and qx+py=n is
View Solution2. The pair x=p and y=q of the linear equations in two variables x and y graphically represents two lines which are
View SolutionThe graphs of y=p(x) are given in figures below. Which among the following shows that p(x) has no zero ?
View SolutionThe graphs of y=p(x) are given in figure below. Which among the following shows that p(x) has no zero ?
View SolutionThe graph of (y−x) against (y+x) is shown below.

Which one of the following shows the graph of y against x ?

View SolutionDraw the graph of the linear equation 3x + 4y = 6. At what points, the graph cuts X and Y-axes ?
View SolutionHow would the graph change when the equation changes to y = 3x from y=x ?
View Solution
