The age structures of a population represents
relative number of individuals at each age
number of new borns each year
number of individuals reaching puberty each year
relative number of deaths at each age
The correct Answer is:A
Step by step video, text & image solution for The age structures of a population represents by Biology experts to help you in doubts & scoring excellent marks in Class 12 exams.
Updated on:21/07/2023Topper's Solved these Questions
Similar Questions
Knowledge Check
The age structure of a population is its
Arelative number of individuals at each ageBnumber of newborns each yearCnumber of young reaching puberty each yearDrelative number of deaths at each ageThe age structures of a population influences population growth because
Ayounger females have more offsprings than do older femalesBdifferent ae groups have different reproductive capabilitiesCmore is the number of immature individuals, slower is the growth of populationDa shorter generation time results is slower population growth.The age structure of a population is its
ARelative number of individuals at each ageBNumber of newborns each yearCNumber of a young reaching puberty each yearDRelative number of deaths at each age
The age structures of a population influences population growth because
View SolutionAssertion : The age-sex structure of human population in countries like France and Germany gives a steep pyramid
Reason : In countries like Sudan and India the population is increasing at a rapid rate.
View SolutionThe difference
P: and development on the other affects
Q: in the relationship death and birth rates on the one hand
R: but the age structure of the population
S: not just the rate of population growth
Which one of the following is the correct sequence?
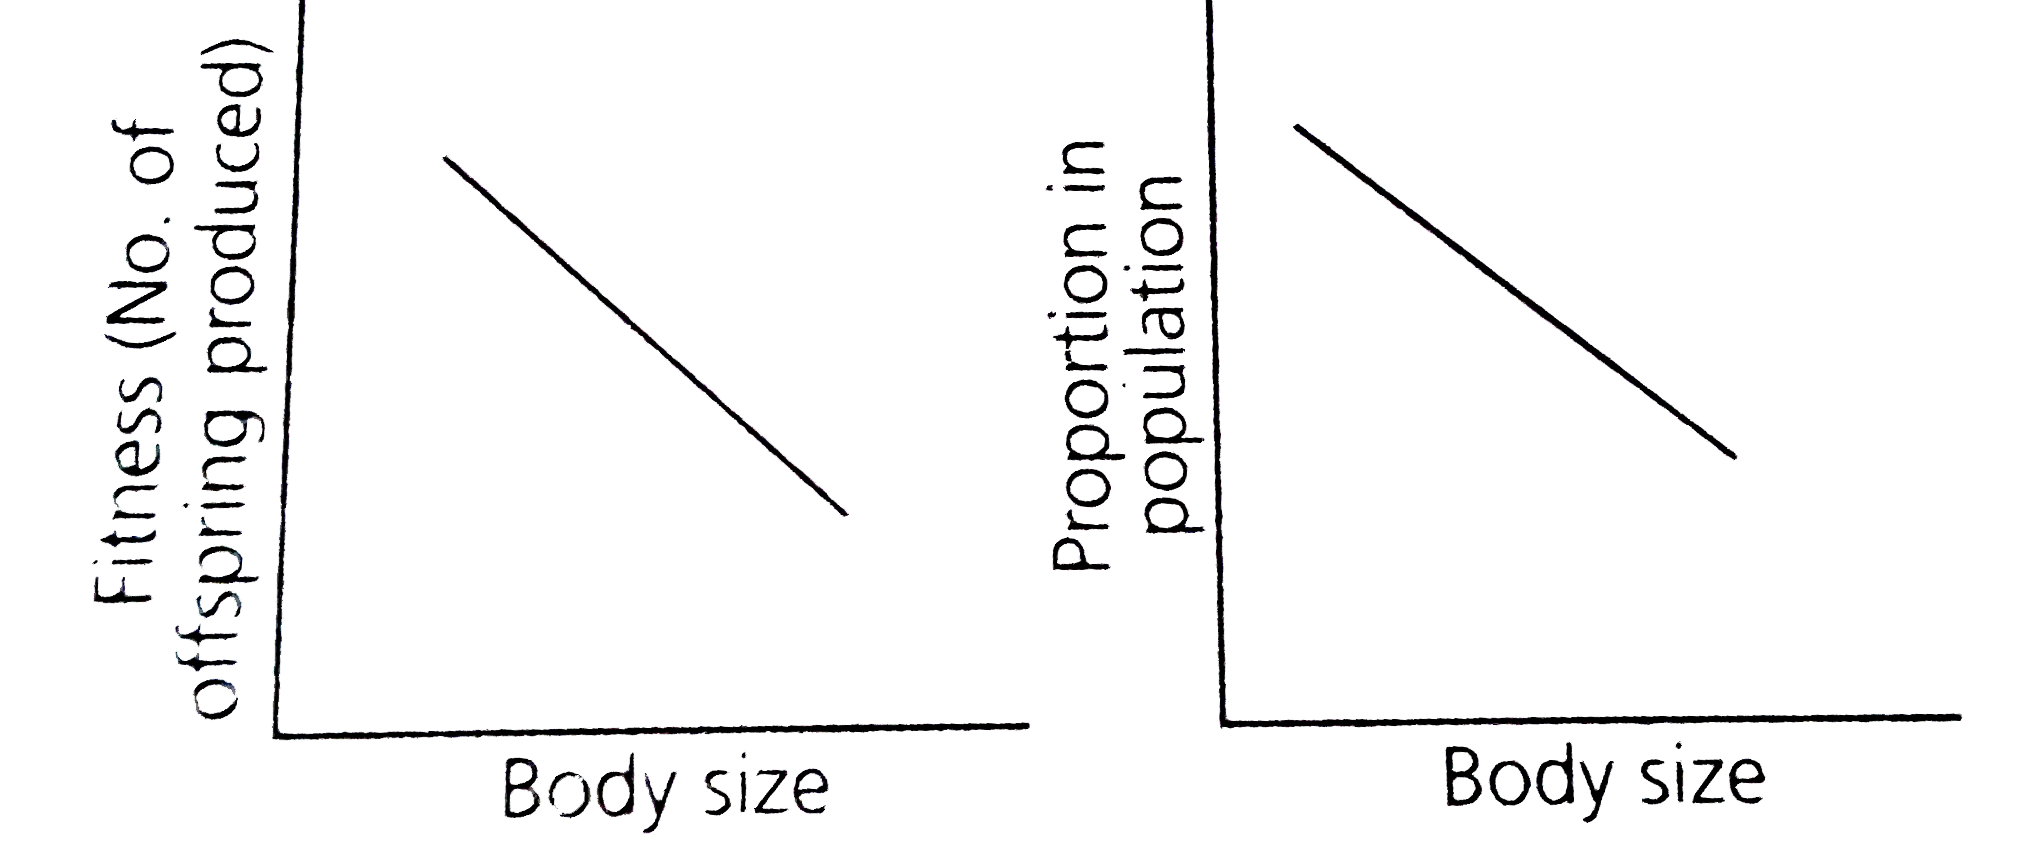
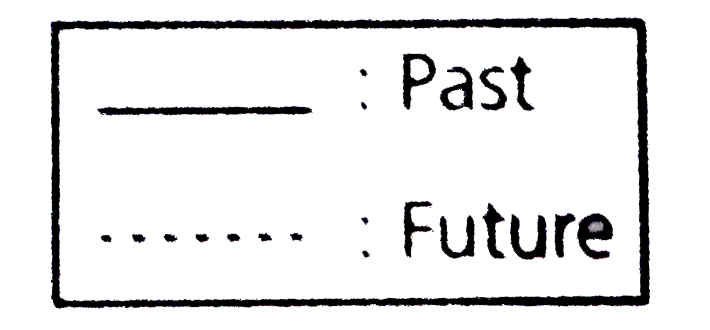
View SolutionStudy the charactristics of a population represented in the graphs below.

Mark the correct graph that represents the type of selection that this population is likely to undergo

View SolutionStudy the charactristics of a population represented in the graphs below.

Mark the correct graph that represents the type of selection that this population is likely to undergo

View Solution

