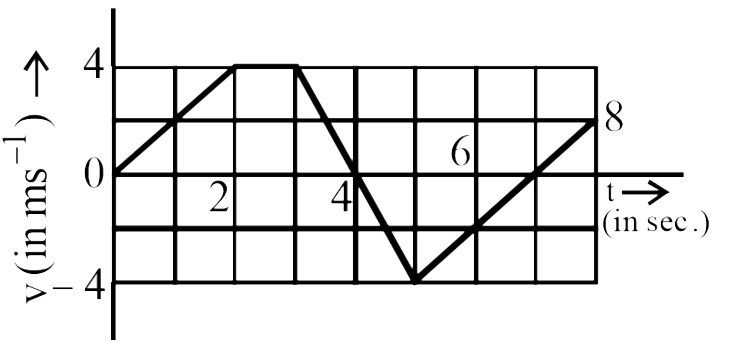
Figure here gives the speed-time graph for a body. The displacement travelled between t = 1.0 second and t = 7.0 second is nearest to
1.5 m
2 m
3 m
4 m
Step by step video & image solution for Figure here gives the speed-time graph for a body. The displacement travelled between t = 1.0 second and t = 7.0 second is nearest to by Physics experts to help you in doubts & scoring excellent marks in Class 11 exams.
Topper's Solved these Questions
Similar Questions
Knowledge Check
- Question 1 - Select One
The v-t graph for a particle is as shown. The distance travelled in the first seconds is :
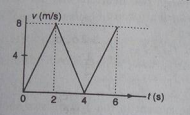 A12 mB16 mC20 mD24 m
 - Question 2 - Select One
The v-t graph for a particle is as shown. The distance travelled in the first seconds is :
 A12 mB16 mC20 mD24 m
 - Question 3 - Select One
A stone is projected vertically upwards y=0 second. The net displacement of stone is zero in time interval between t=0 second to t=T seconds. Pick up the correct statement
AFrom time t=T/4 second to t=3T/4 second, the average velocity is zero.BThe change in velocity from time t=0 to t=T/4 second is same as change in velocity from t=T/8 second to t=3T/8 second.CThe distance travelled from t=0 to t=T/4 second is larger than the distance travelled from t=T/4 second to t=3T/4 second.DThe distance traveled from t=T/2 second to t=3T/2 second second is half the distance traveled from t=T/2 second to t=T second.
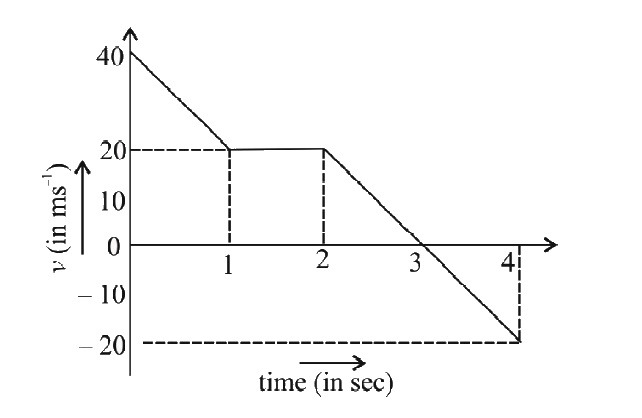
The v−t graph for a particle is shown. The distance travelled in the first four seconds is:
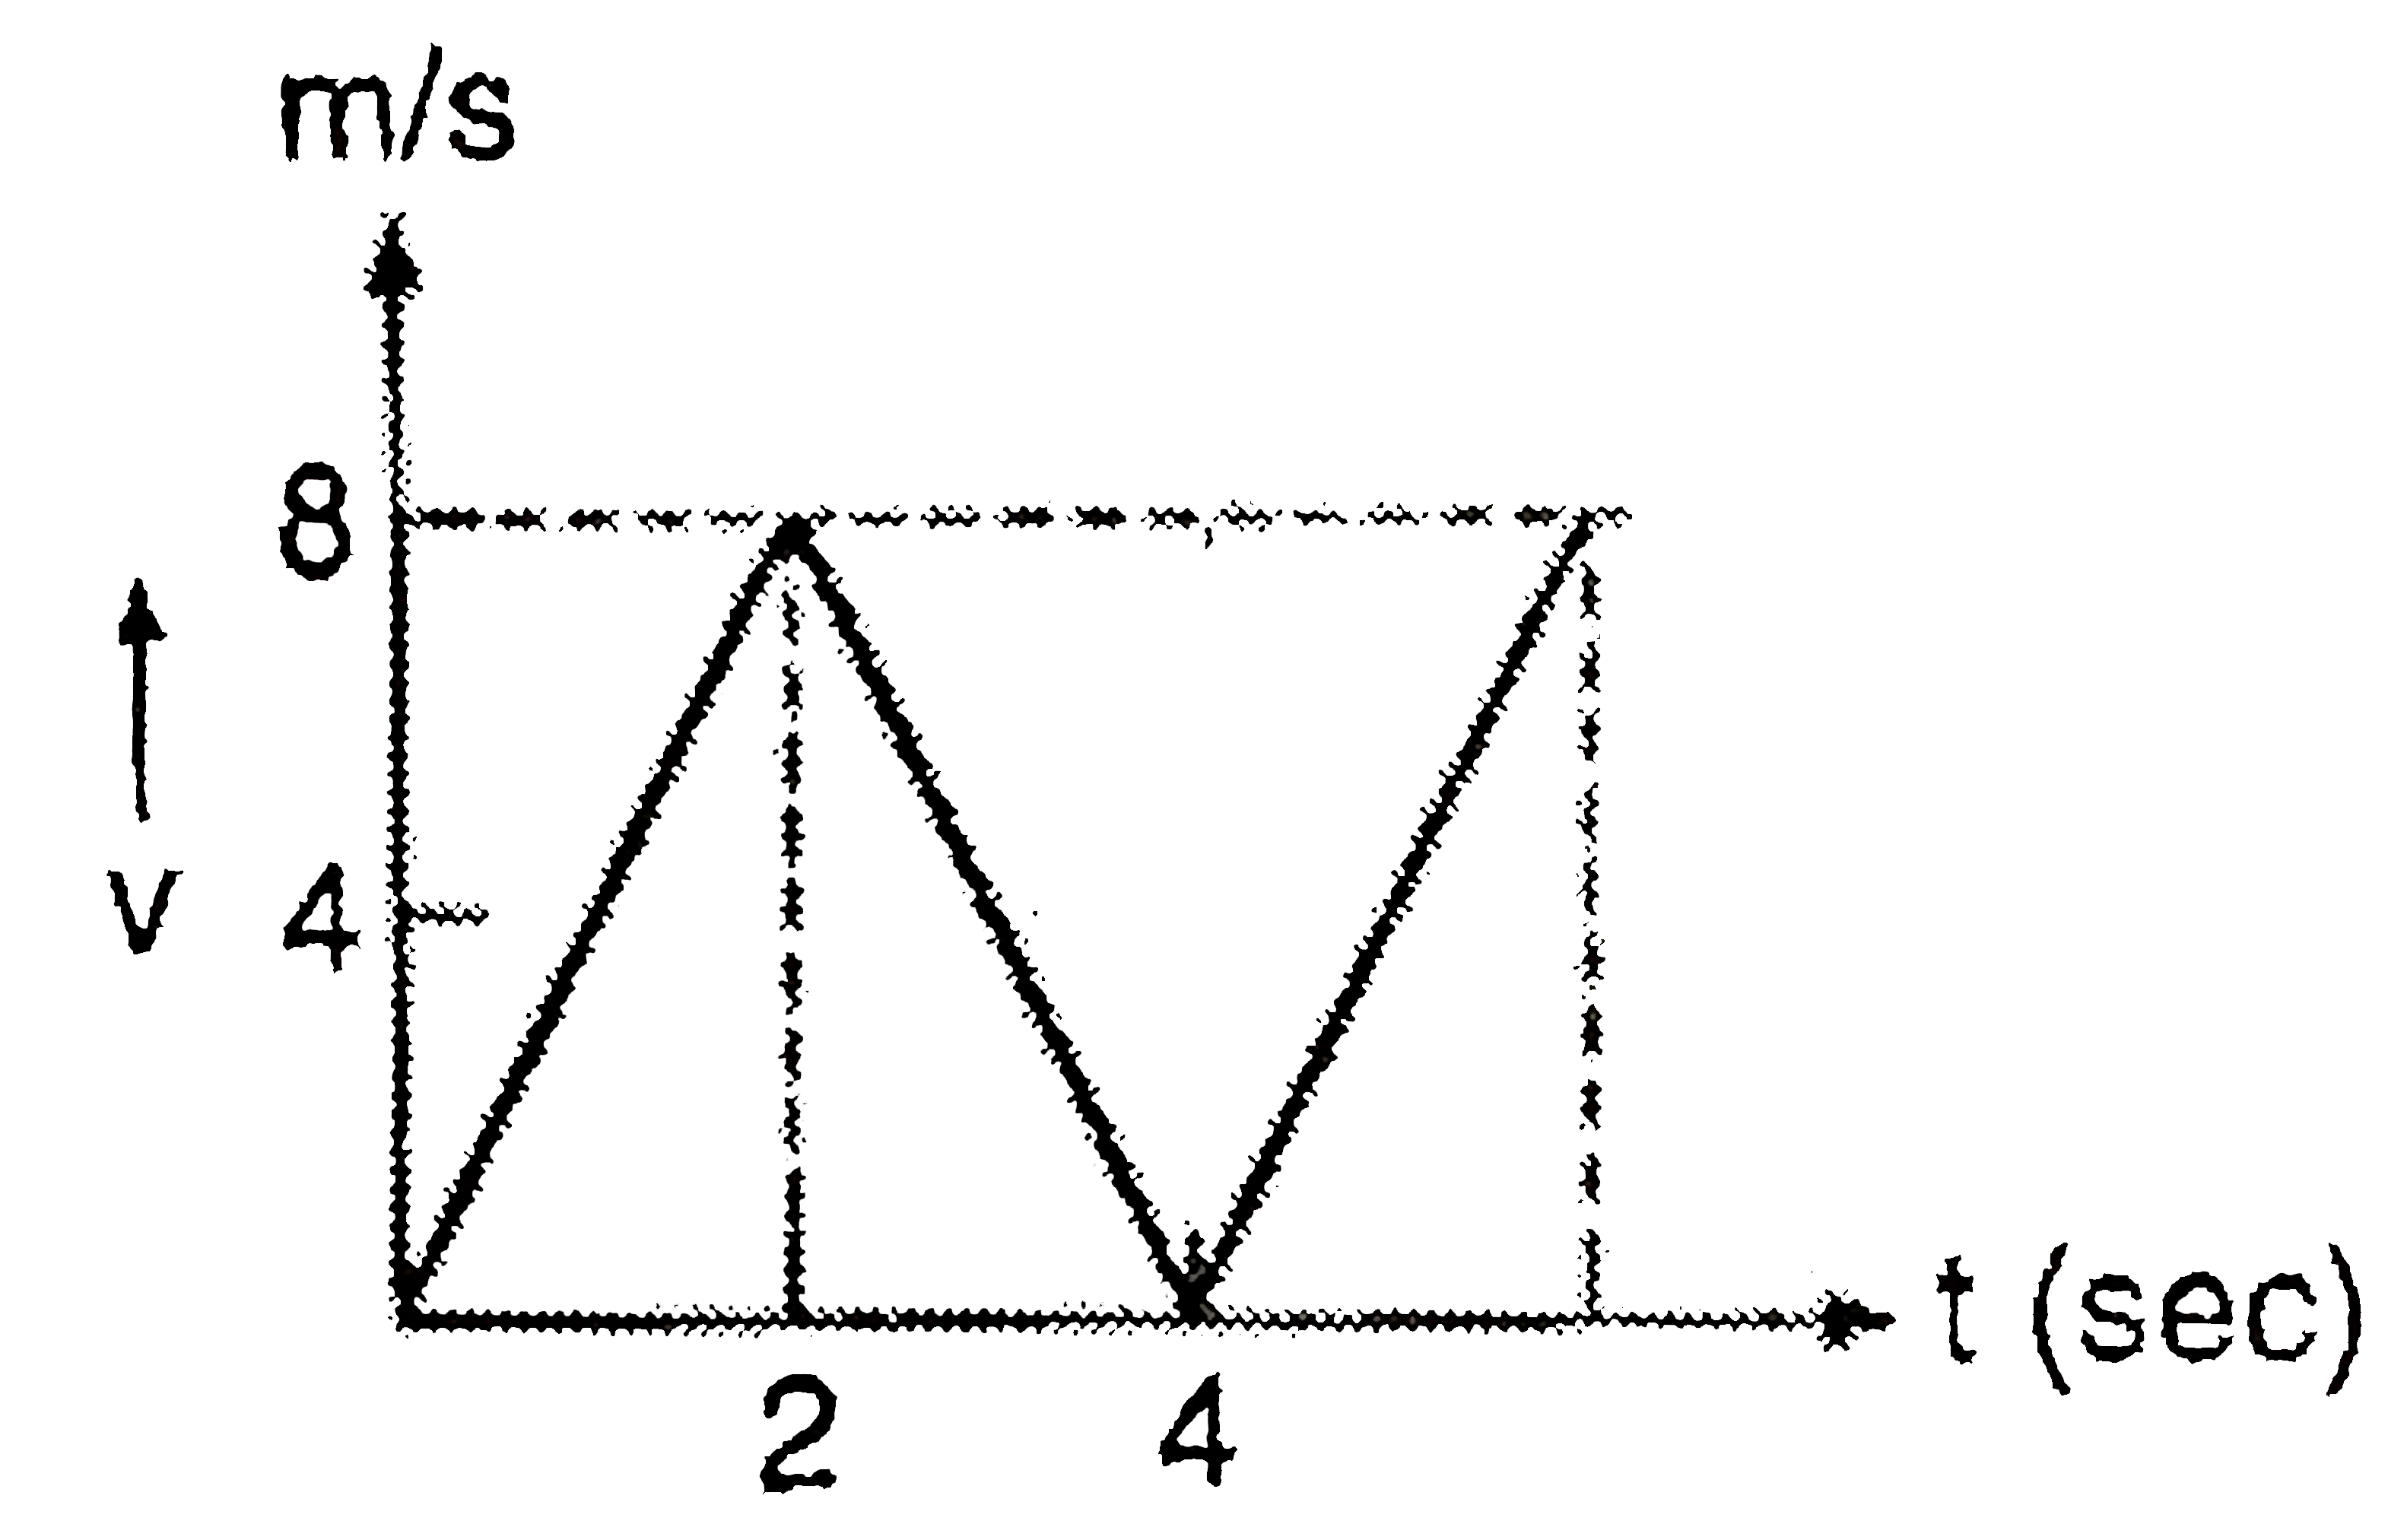 View Solution
In the given v-t graph the distance travelled by the body in 5 seconds will be
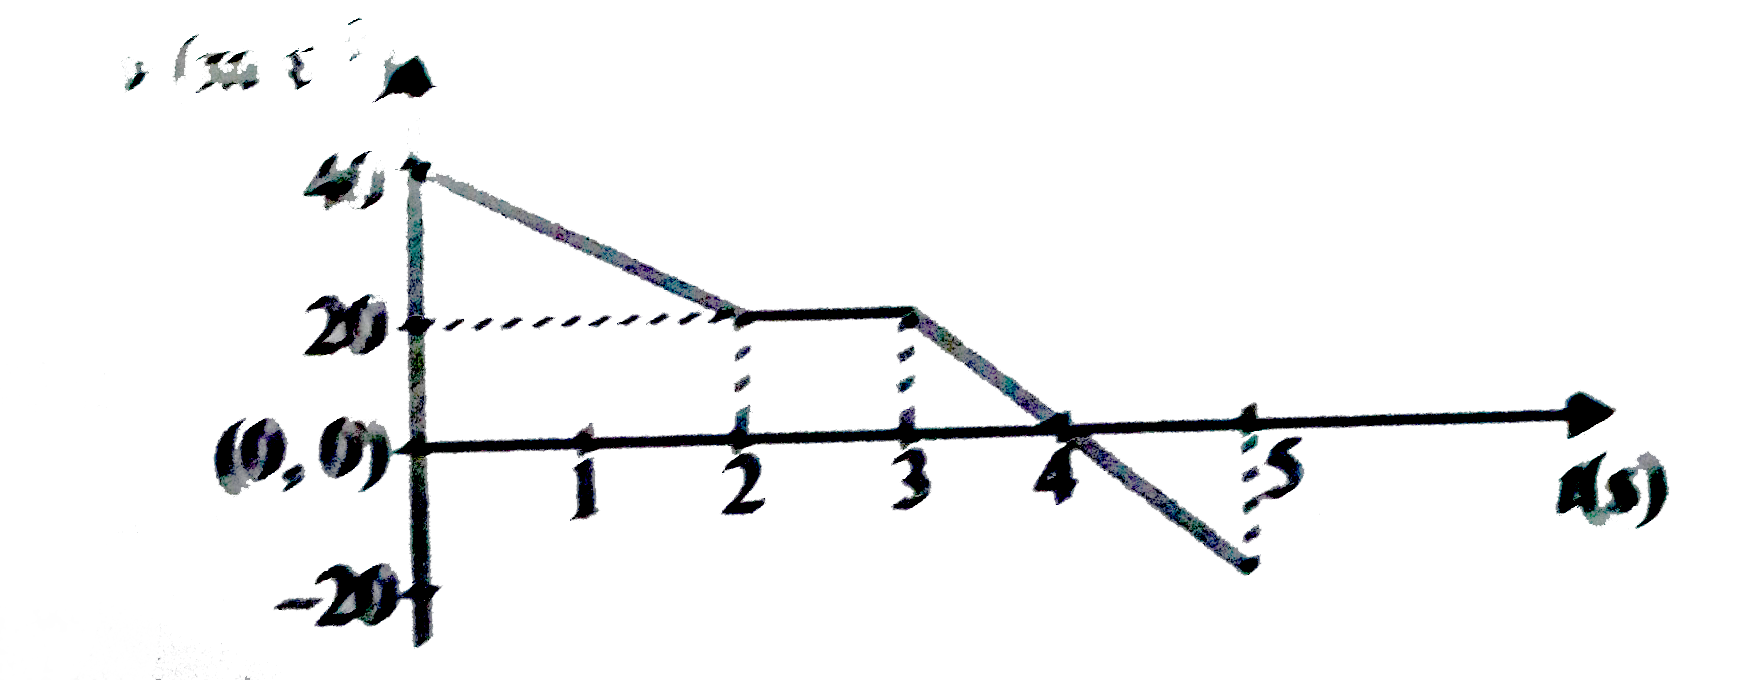 View Solution
Figure shows the speed versus time graph for a particle. Find the distance travelled by the particle during the time t=0 to t=3s.
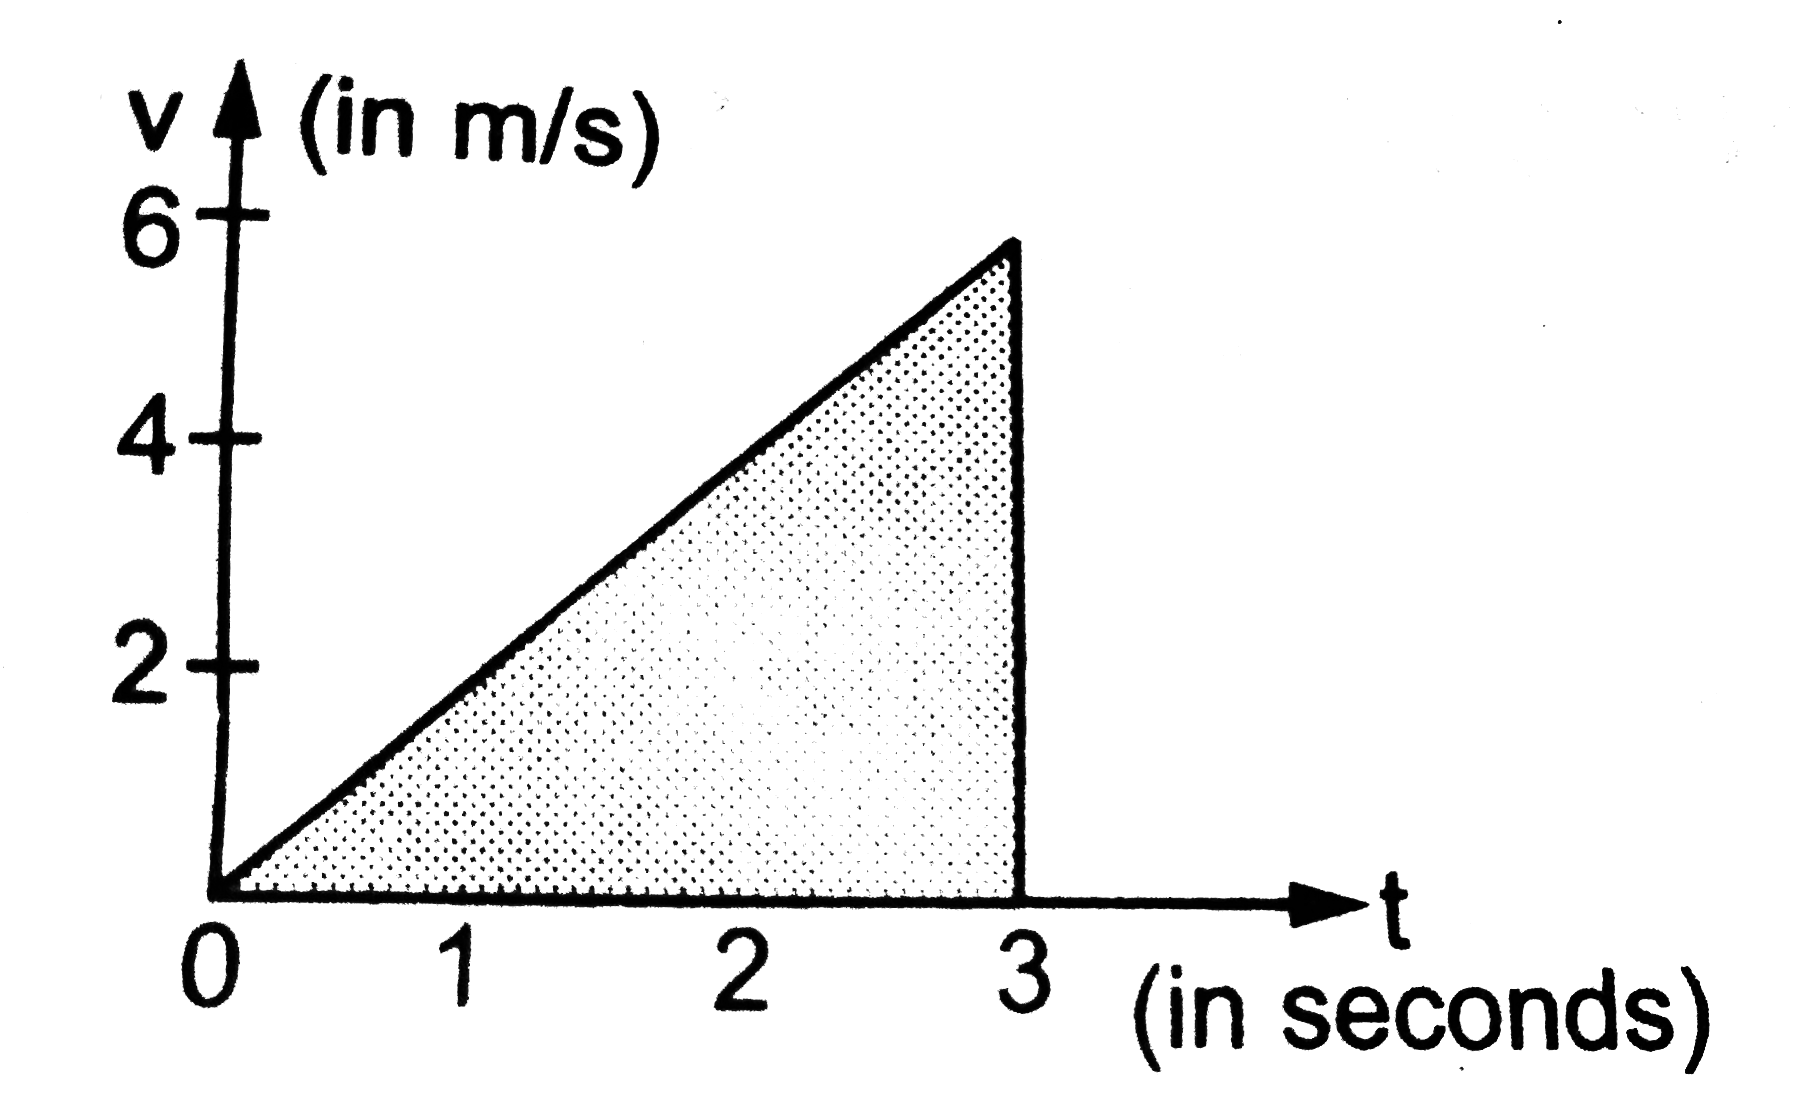 View Solution
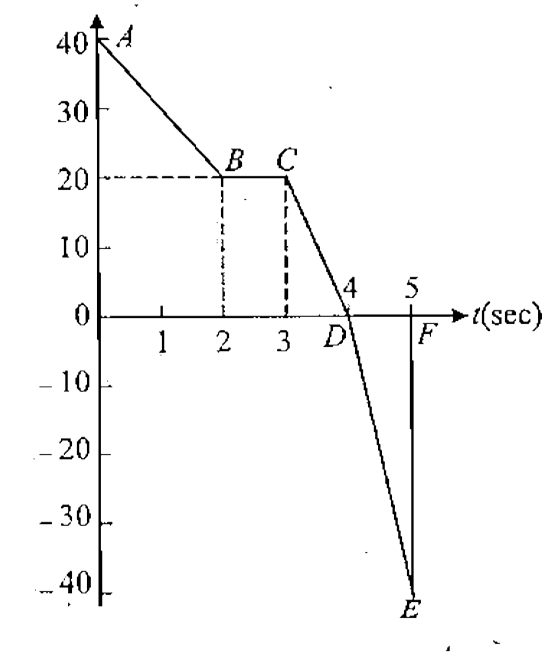
In the following velocity time graph of a body the distance travelled by the body and its displacement during 5 second in meter will be : -
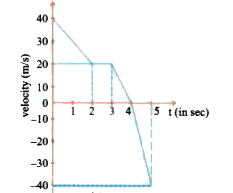 View Solution
In the following velocity time graph of a body the distance travelled by the body and its displacement during 5 second in meter will be : -
 View Solution


