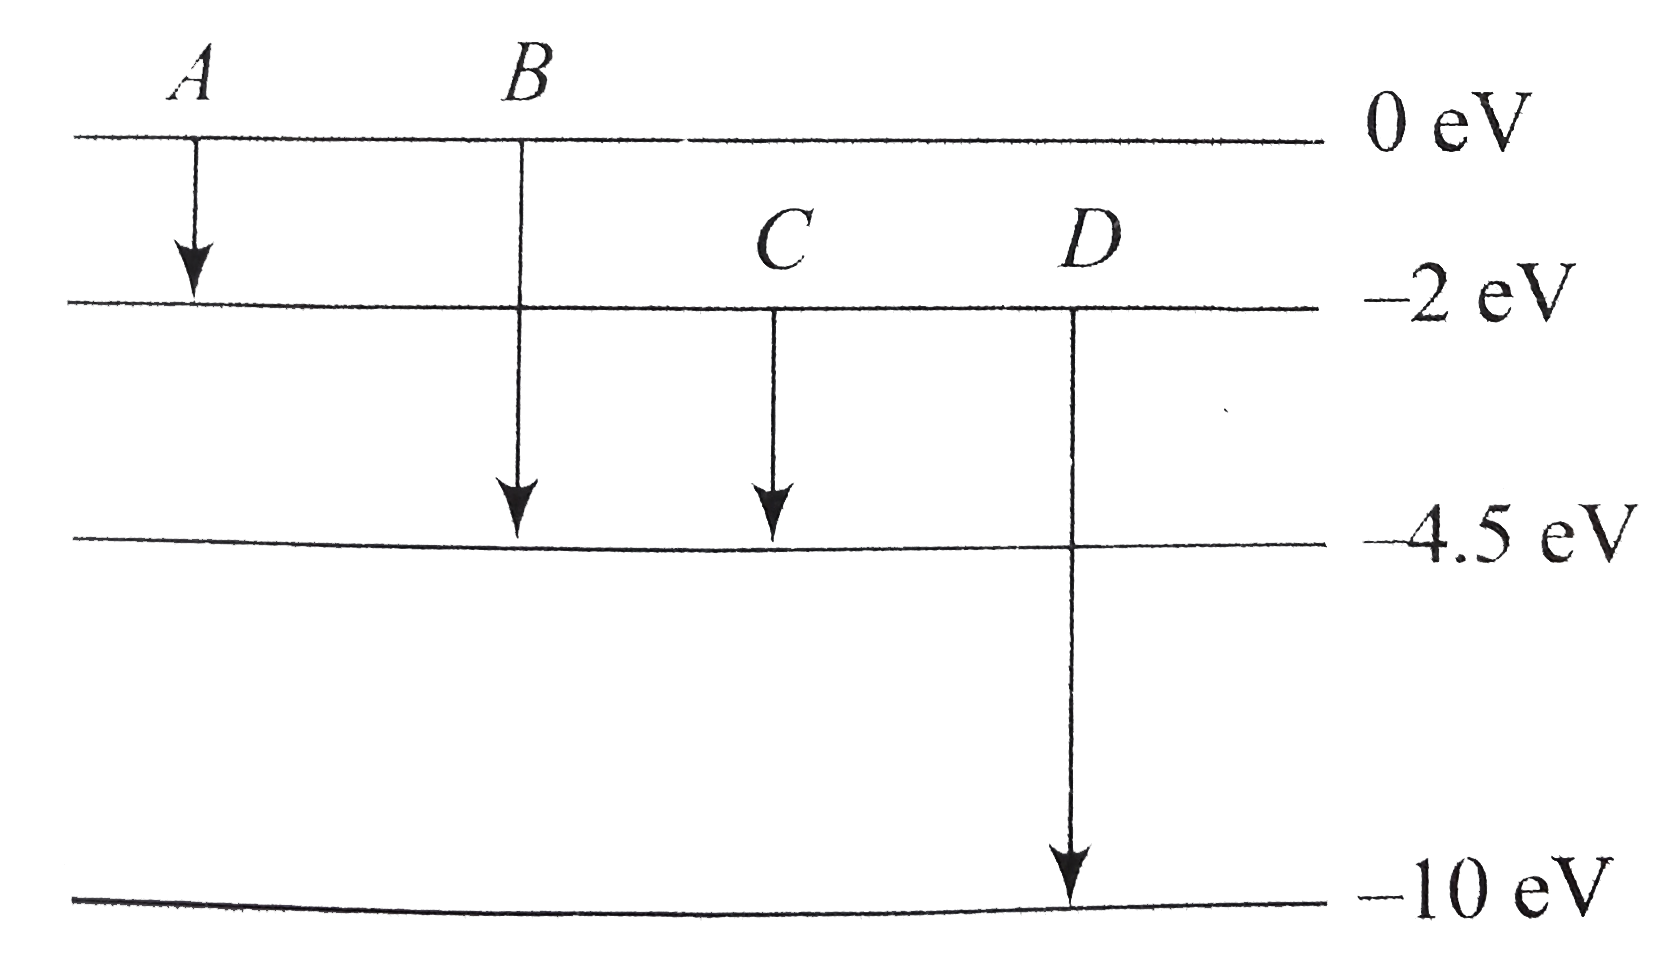
The energy levels of the hydrogen spectrum is shown in figure. There are some transitions A,B,C,D and E. Transition A,B, and C respectively represent
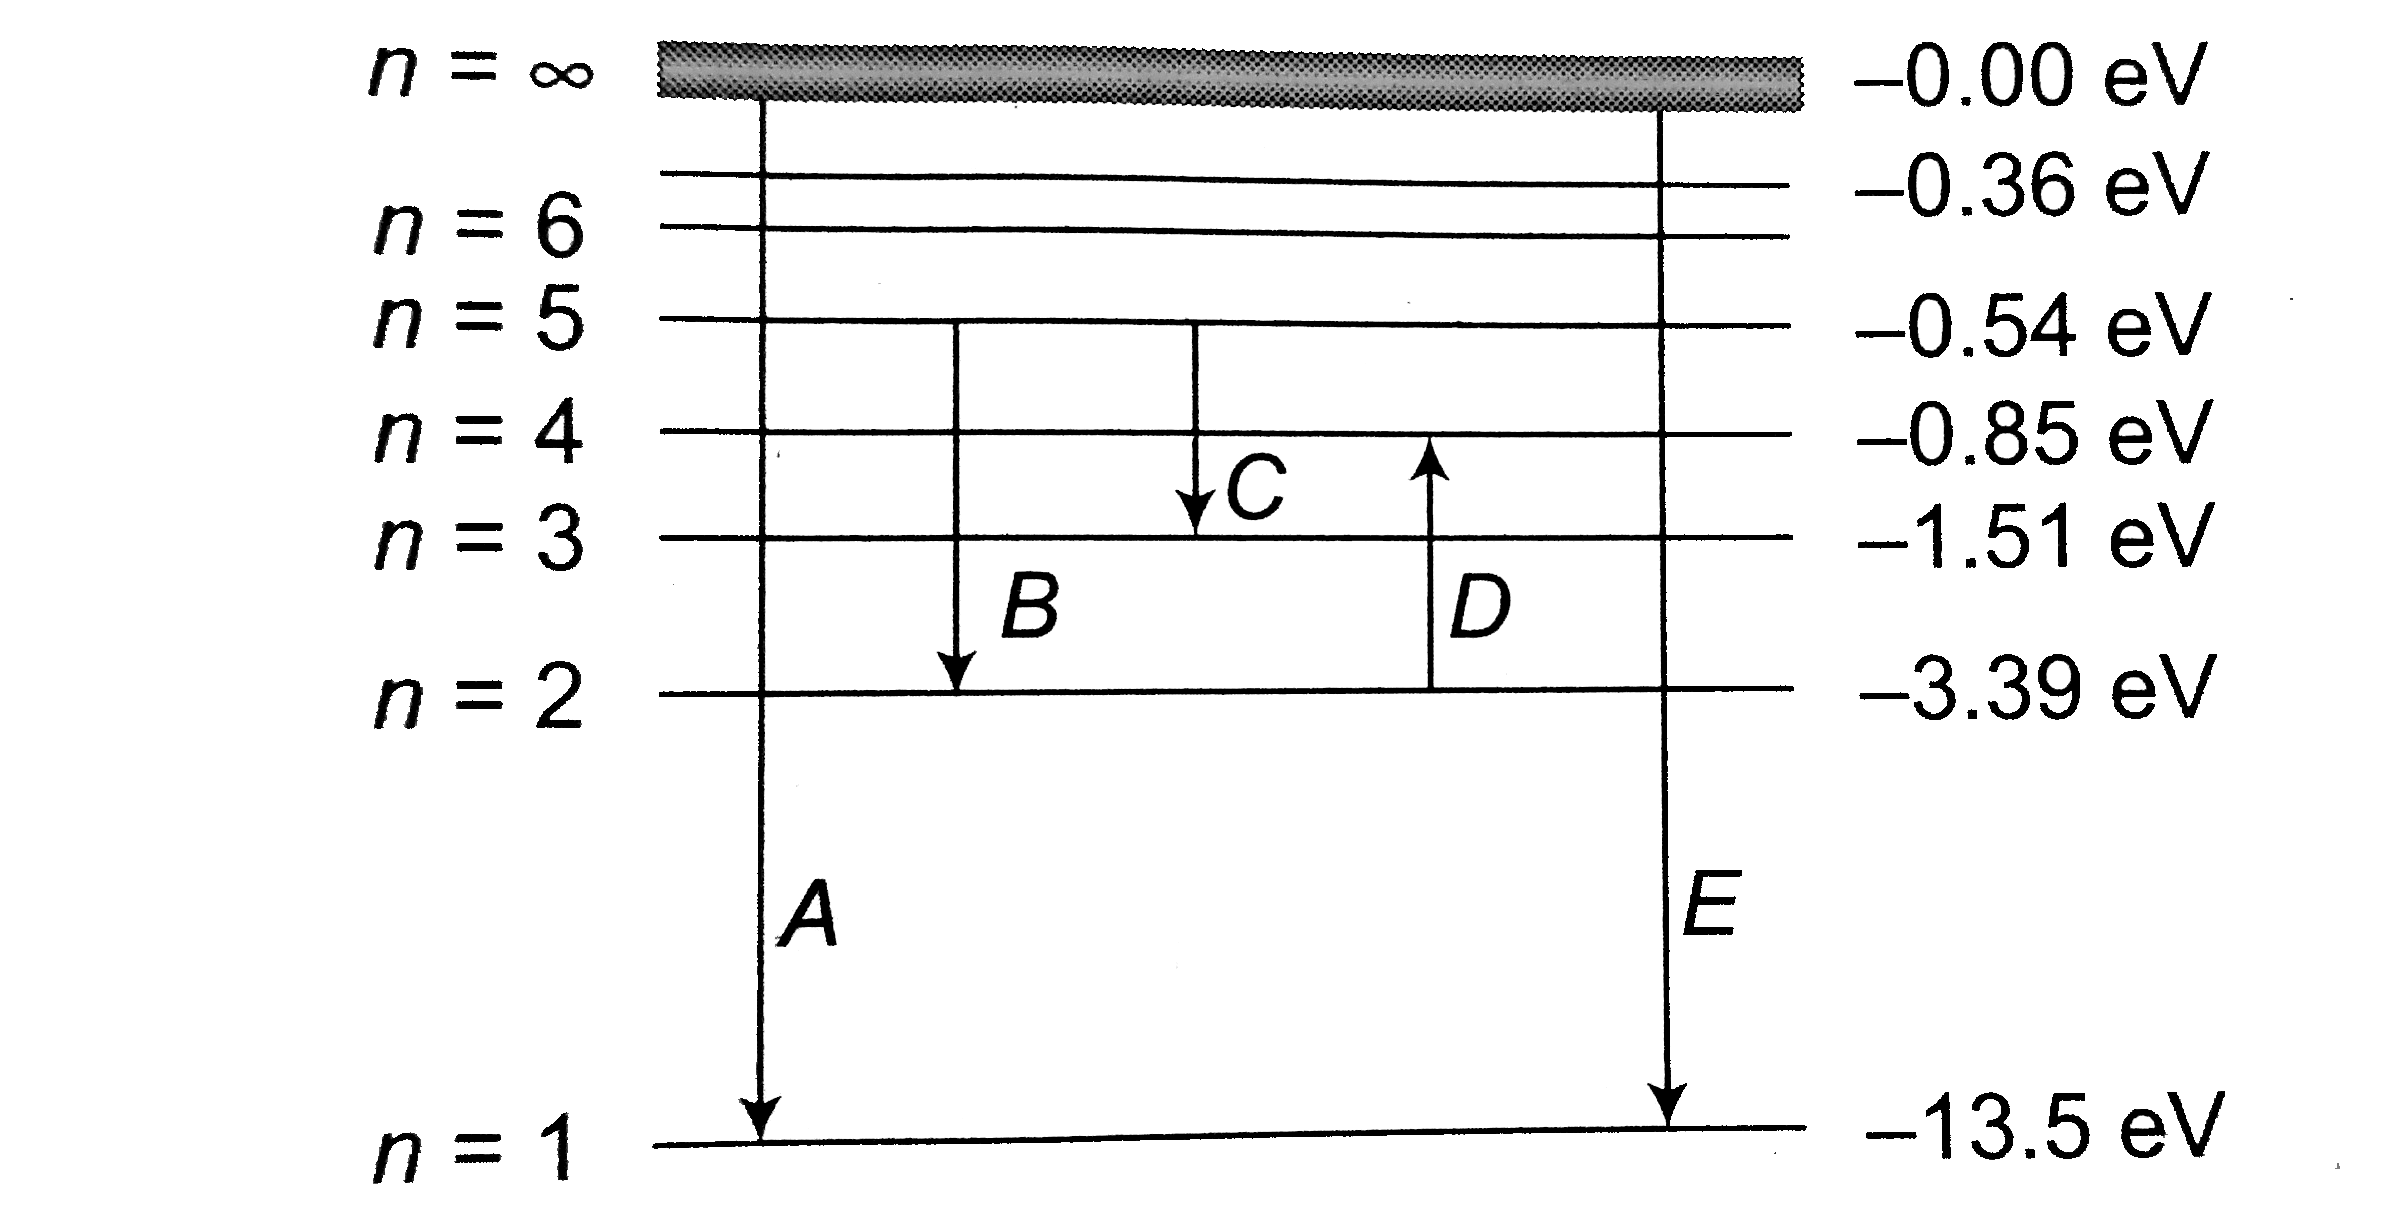
First specral line of Lyman series, third spectral line of Balmer series and the second spectral line of Paschen series.
Ionization potential of hydrogen, second spectral line of Balmer series and third spectral line of Paschen series
Series limit of Lyman series, third spectral line of Balmer series and second spectral line of Paschen series.
Series limit of Lyman series, second spectral line of Balmer series and third spectral line of Paschen series.
Step by step video & image solution for The energy levels of the hydrogen spectrum is shown in figure. There are some transitions A, B, C, D and E. Transition A, B, and C respectively represent by Physics experts to help you in doubts & scoring excellent marks in Class 11 exams.
Updated on:21/07/2023Topper's Solved these Questions
Similar Questions
Knowledge Check
In the following figure the energy levels of hydroge atom have been shown along with some transitions marked A, B,C,D and E.The transitionsy A,B and C respectively represent:
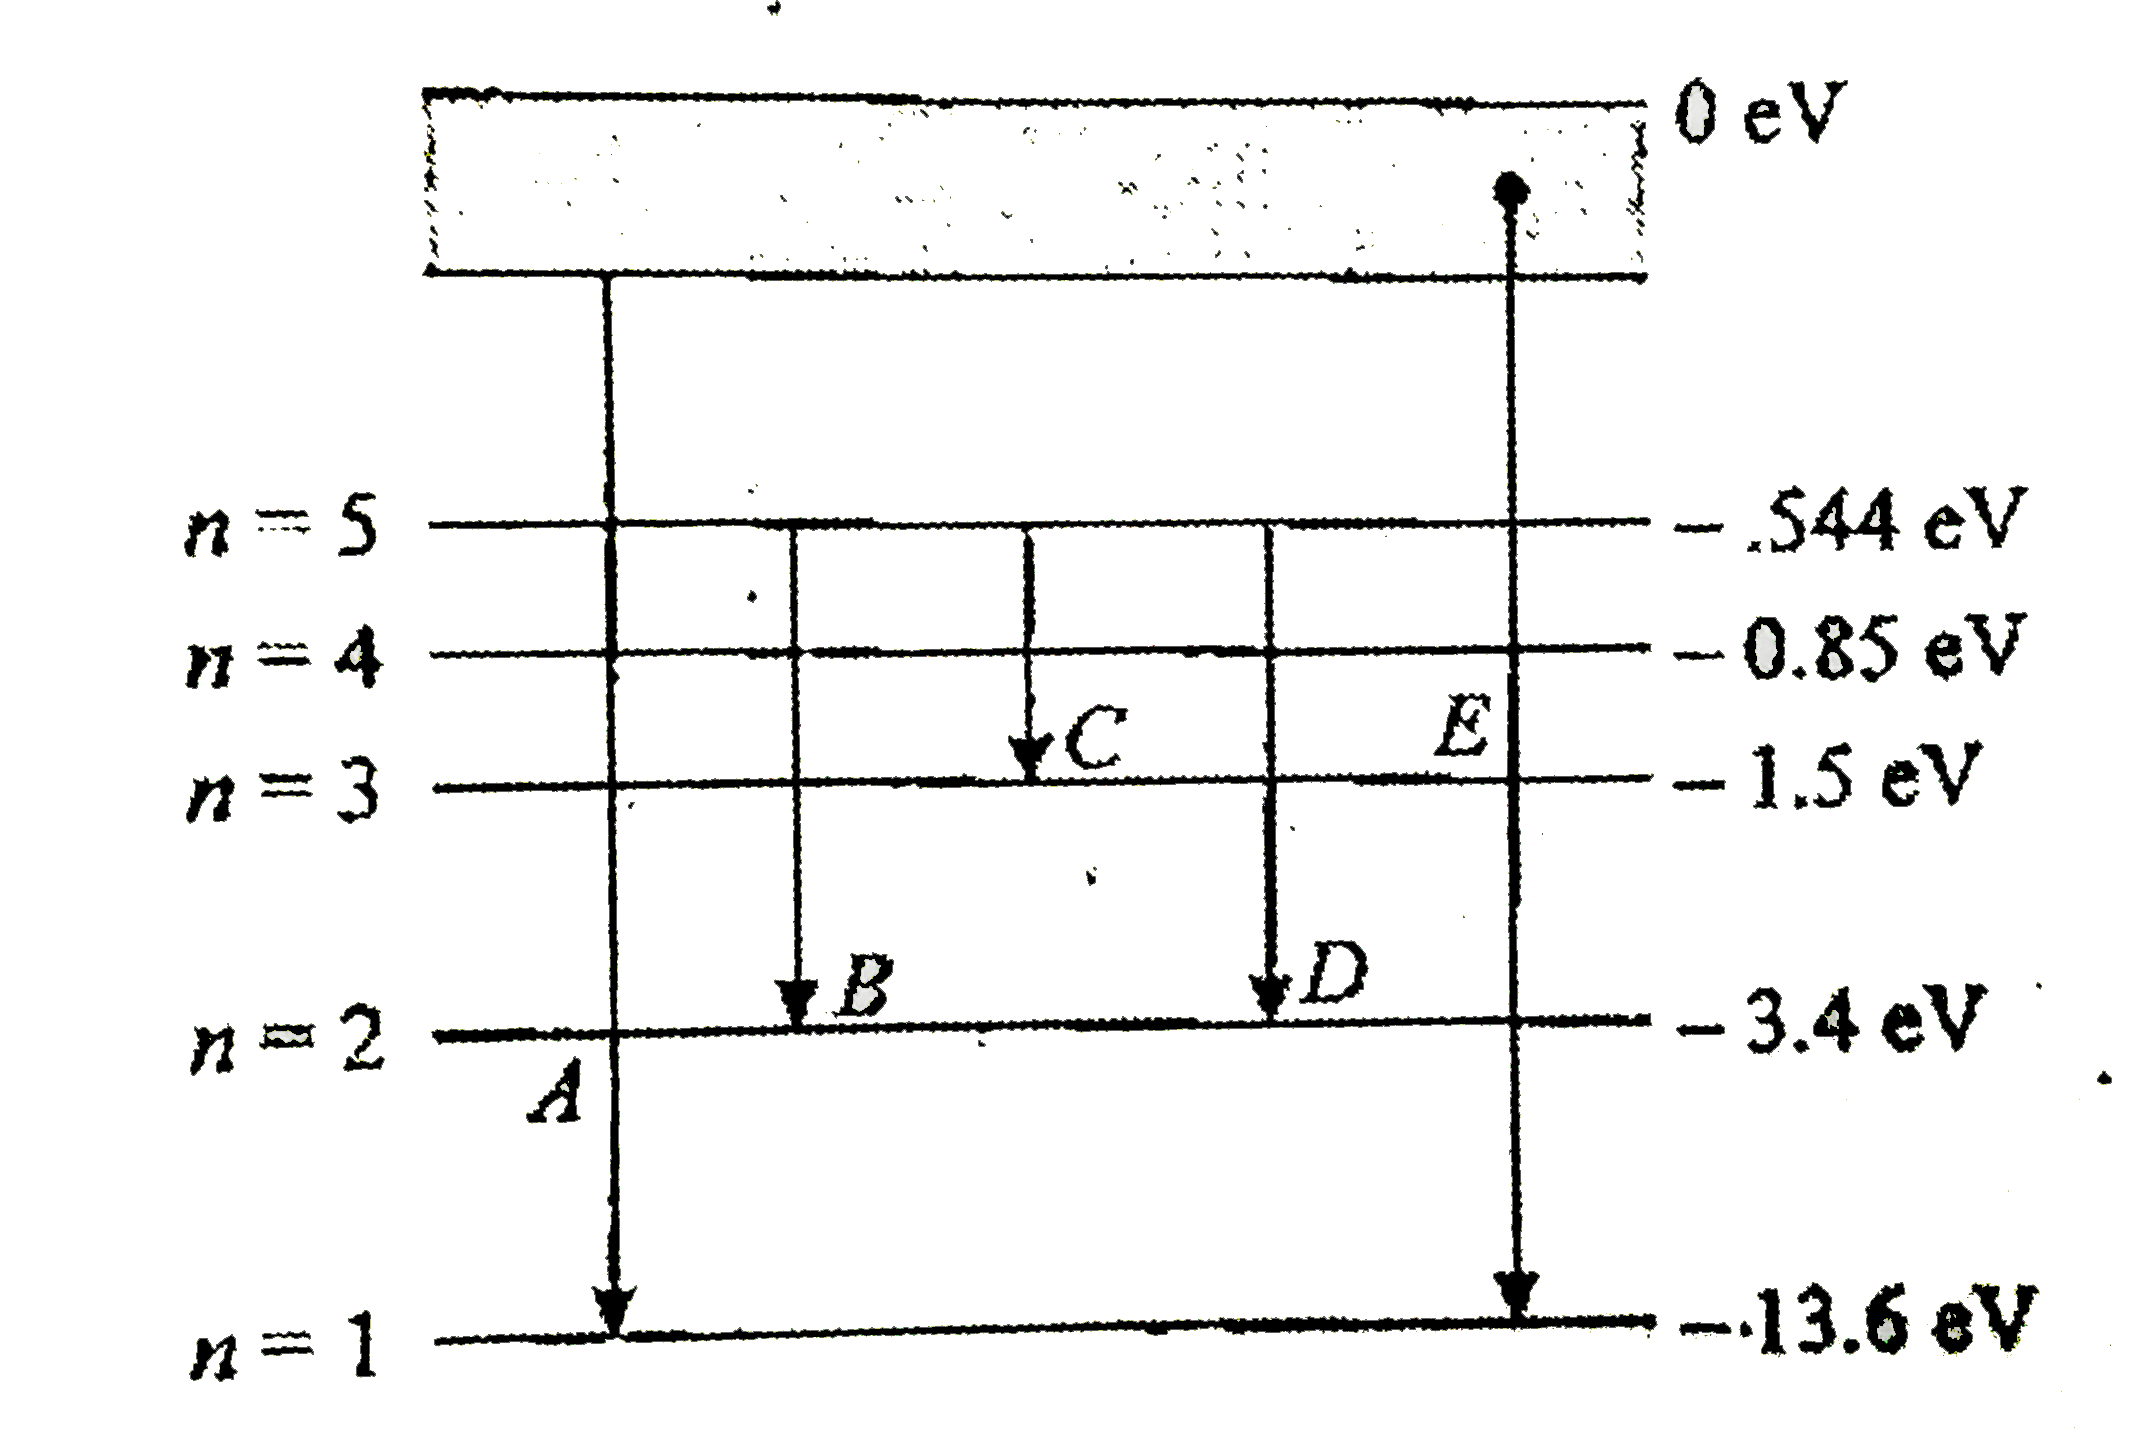 AThe ionization potential of hydrogen, second member of Balmer series and third member of Paschen series.BThe first member of the Lyman series, third member of Balmer series and second member of Paschen series.CThe series limit of Lyman series, third member of Balmer series and second member of Paschen series.DThe series limit of Lyman series, second member of Balmer series and second member of Paschen series.
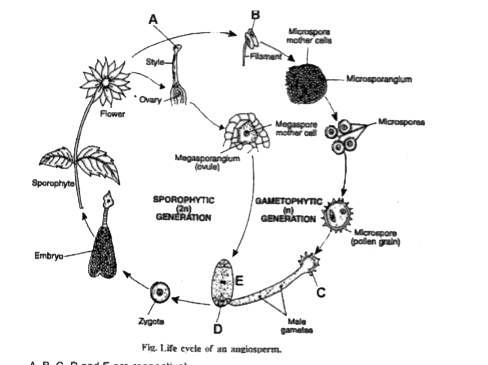
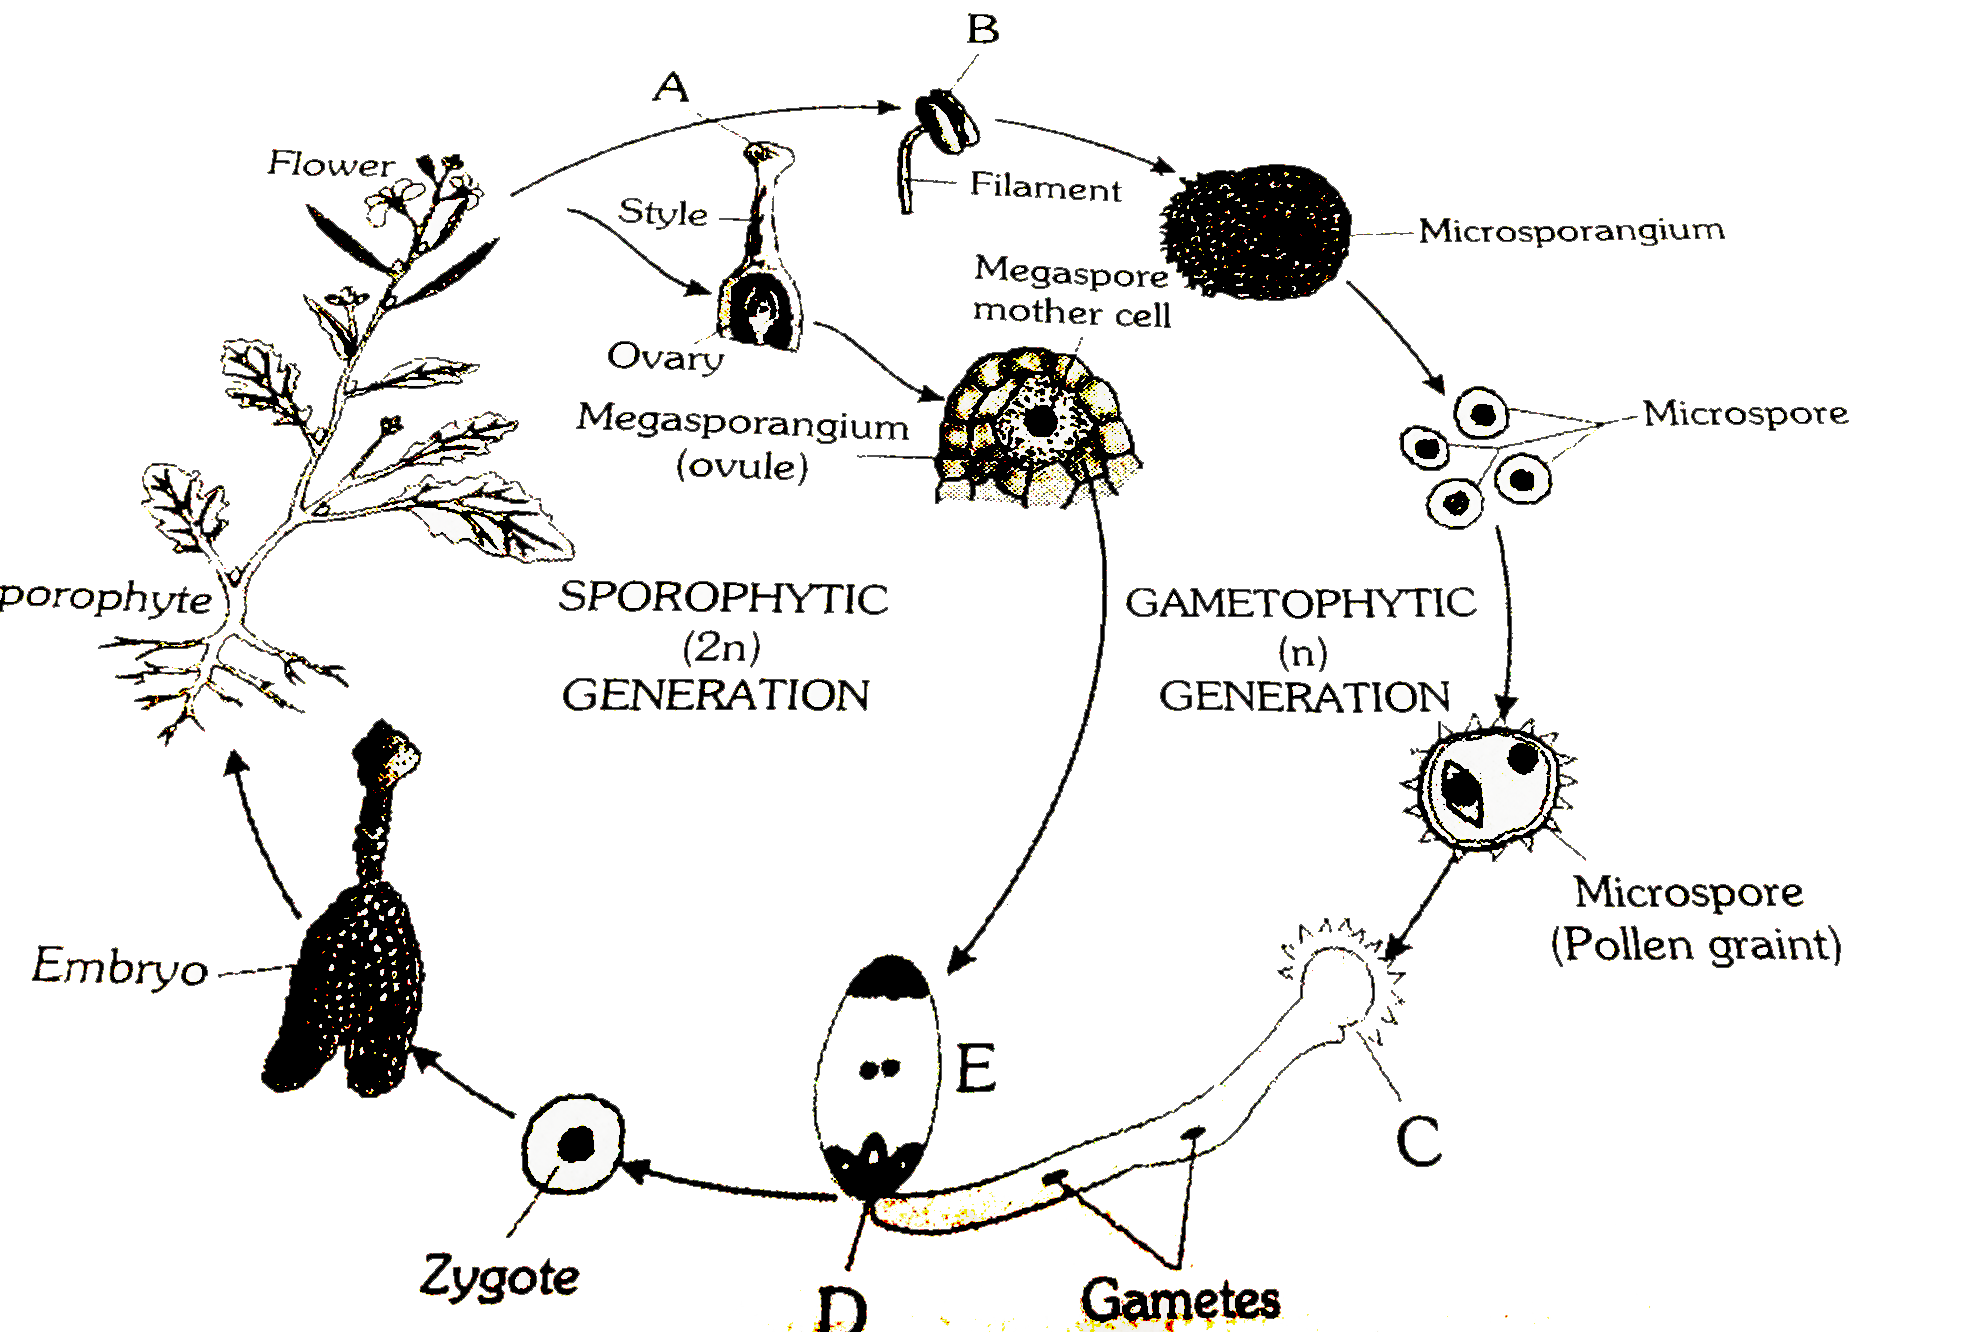
A, B, C, D and E are respectively -AStigma, Anther, Male gametophyte, Egg and Female gametophyteBStigma, Anther, Female gametophyte, Egg and Male gametophyteCStigma, Anther, Male gametophyte, Fertilized egg and Female gametophyteDStigma, Anther, Embryo sac, Egg and Female gametophyteIn the pelvic girdle of man A, B, C, D and E respectively represents
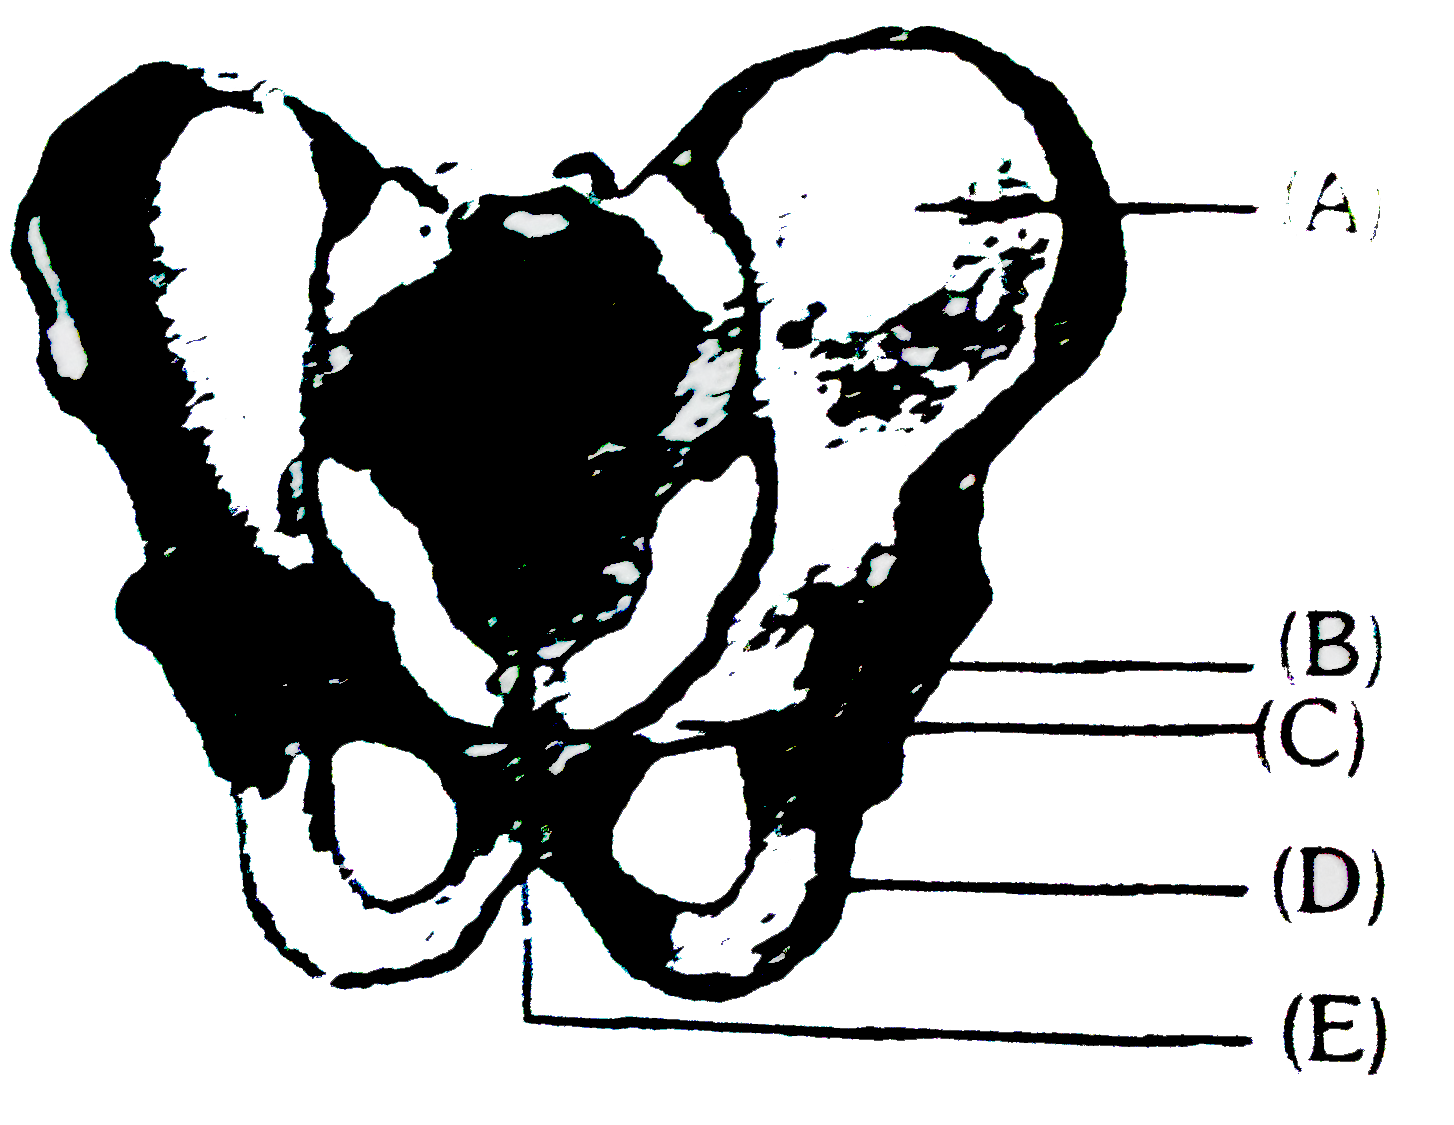 AA-pubis, B-acetabulum, C-ilium, D-ischium, E-pubic symphysisBA-ilium, B-acetabulum, C-pubis, D-ischium, E-pubic symphysisCA-ischium, B-acetabulum, C-pubis, D-ilium, E-pubic symphysisDA-ilium, B-pubis, C- acetabulum, D-pubic symphysis, E-ischium
The energy levels of an atom are as shown in figure . Which one of those transition will result in the emission of a photon of wavelength 275nm?
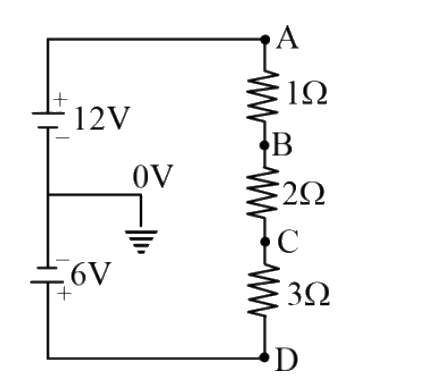
View SolutionIn the circuit diagram shown in Figure , the potentials of the points B, C and D are respectively -
View SolutionThe given figure represents some stages in microgametogenesis identify A, B and C respectively

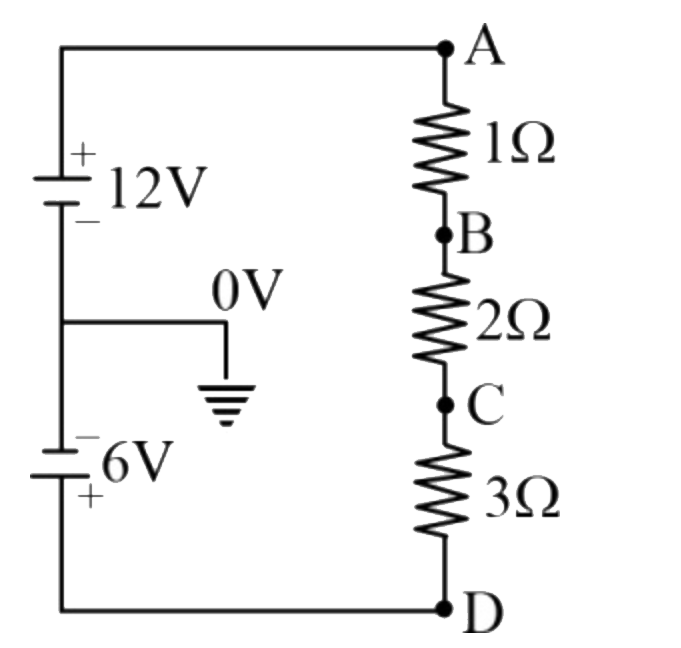
View SolutionIn the circuit diagram shown in figure, the potentials of the points B, C and D are respectively.
View SolutionSee the following figure and identify A, B, C, D and E are respectively
View Solution


