Which of the following is an equation of the graph shown in Figure
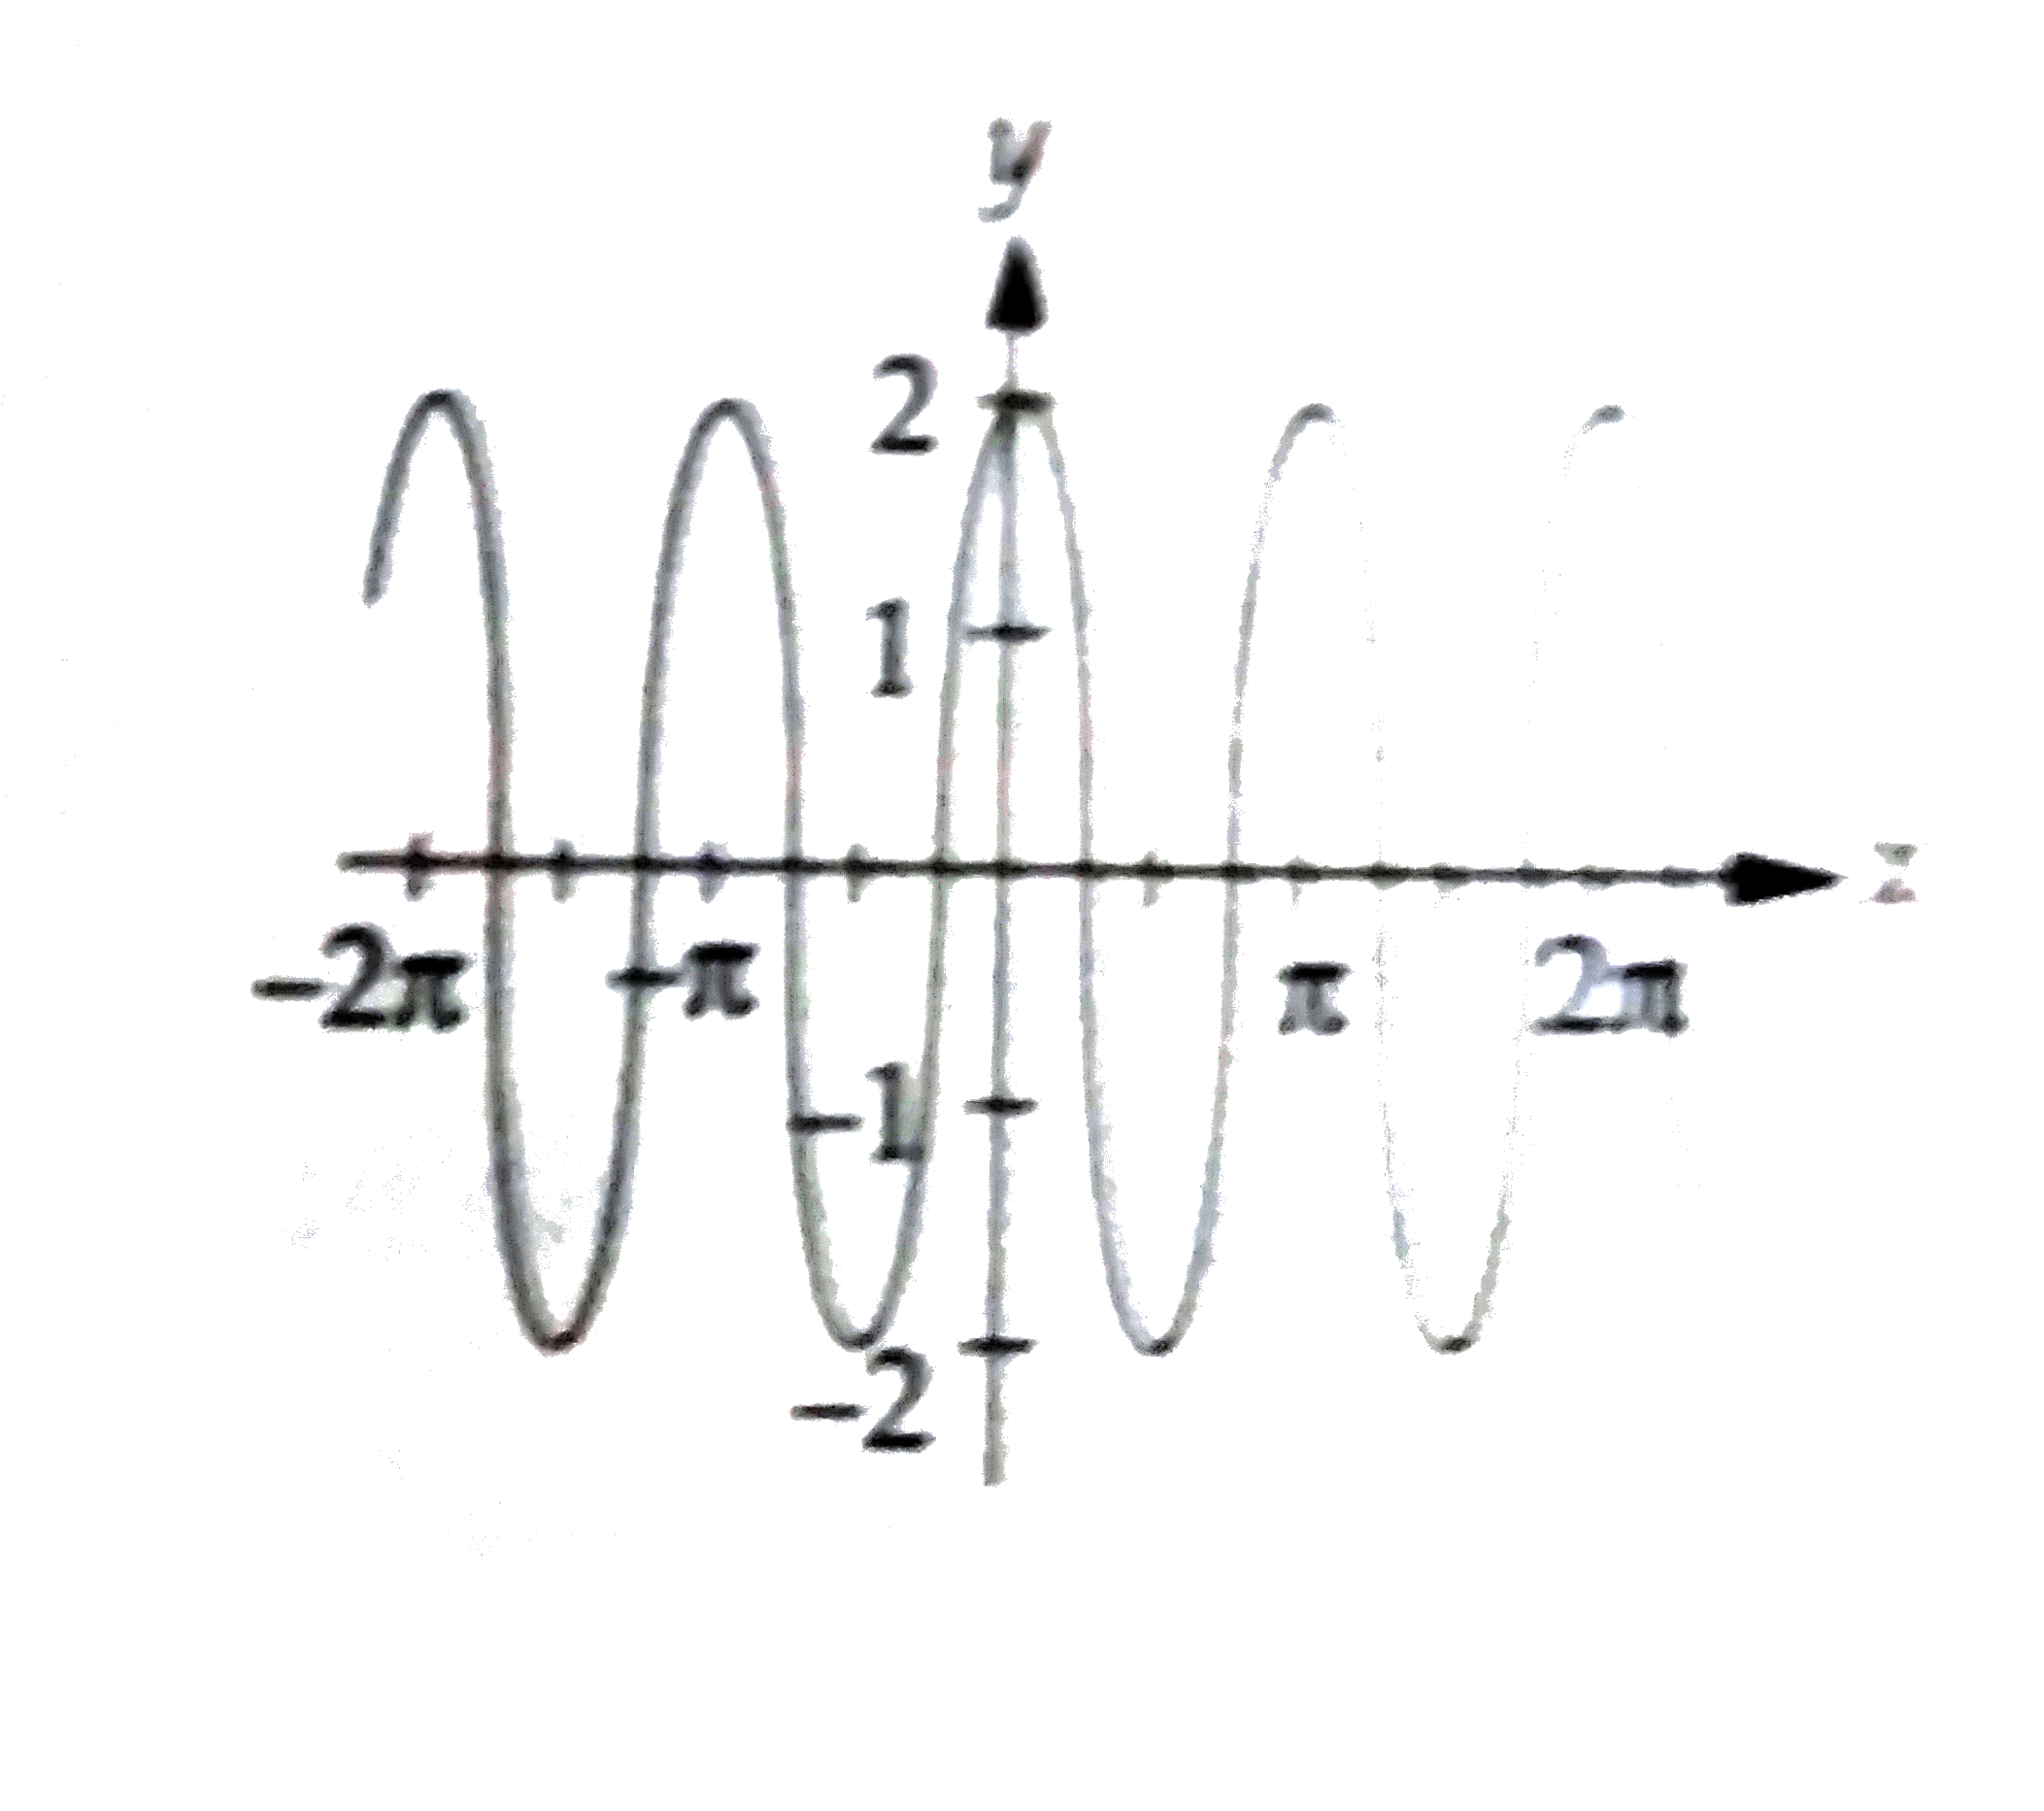
y=12sin2x
y=12cos2x
y=2sin(x2)
y=2cos2x
The correct Answer is:D
The graph a trigonometric function, put the angles (usually in radians) on the x - axis and the results of applying the function on the y - axis. You can always use your graphing calculator (if you have one and know how to use it) to find the graph of a trigonometric function.
But ultimately you're bettery off if you can have a true understanding, a ''feeling,'' for what the graphs of trigonometric functions look like. The way to do that is to start with a picture in your mind of what the graphs of the three basic functions look like.
Similar Questions
Knowledge Check
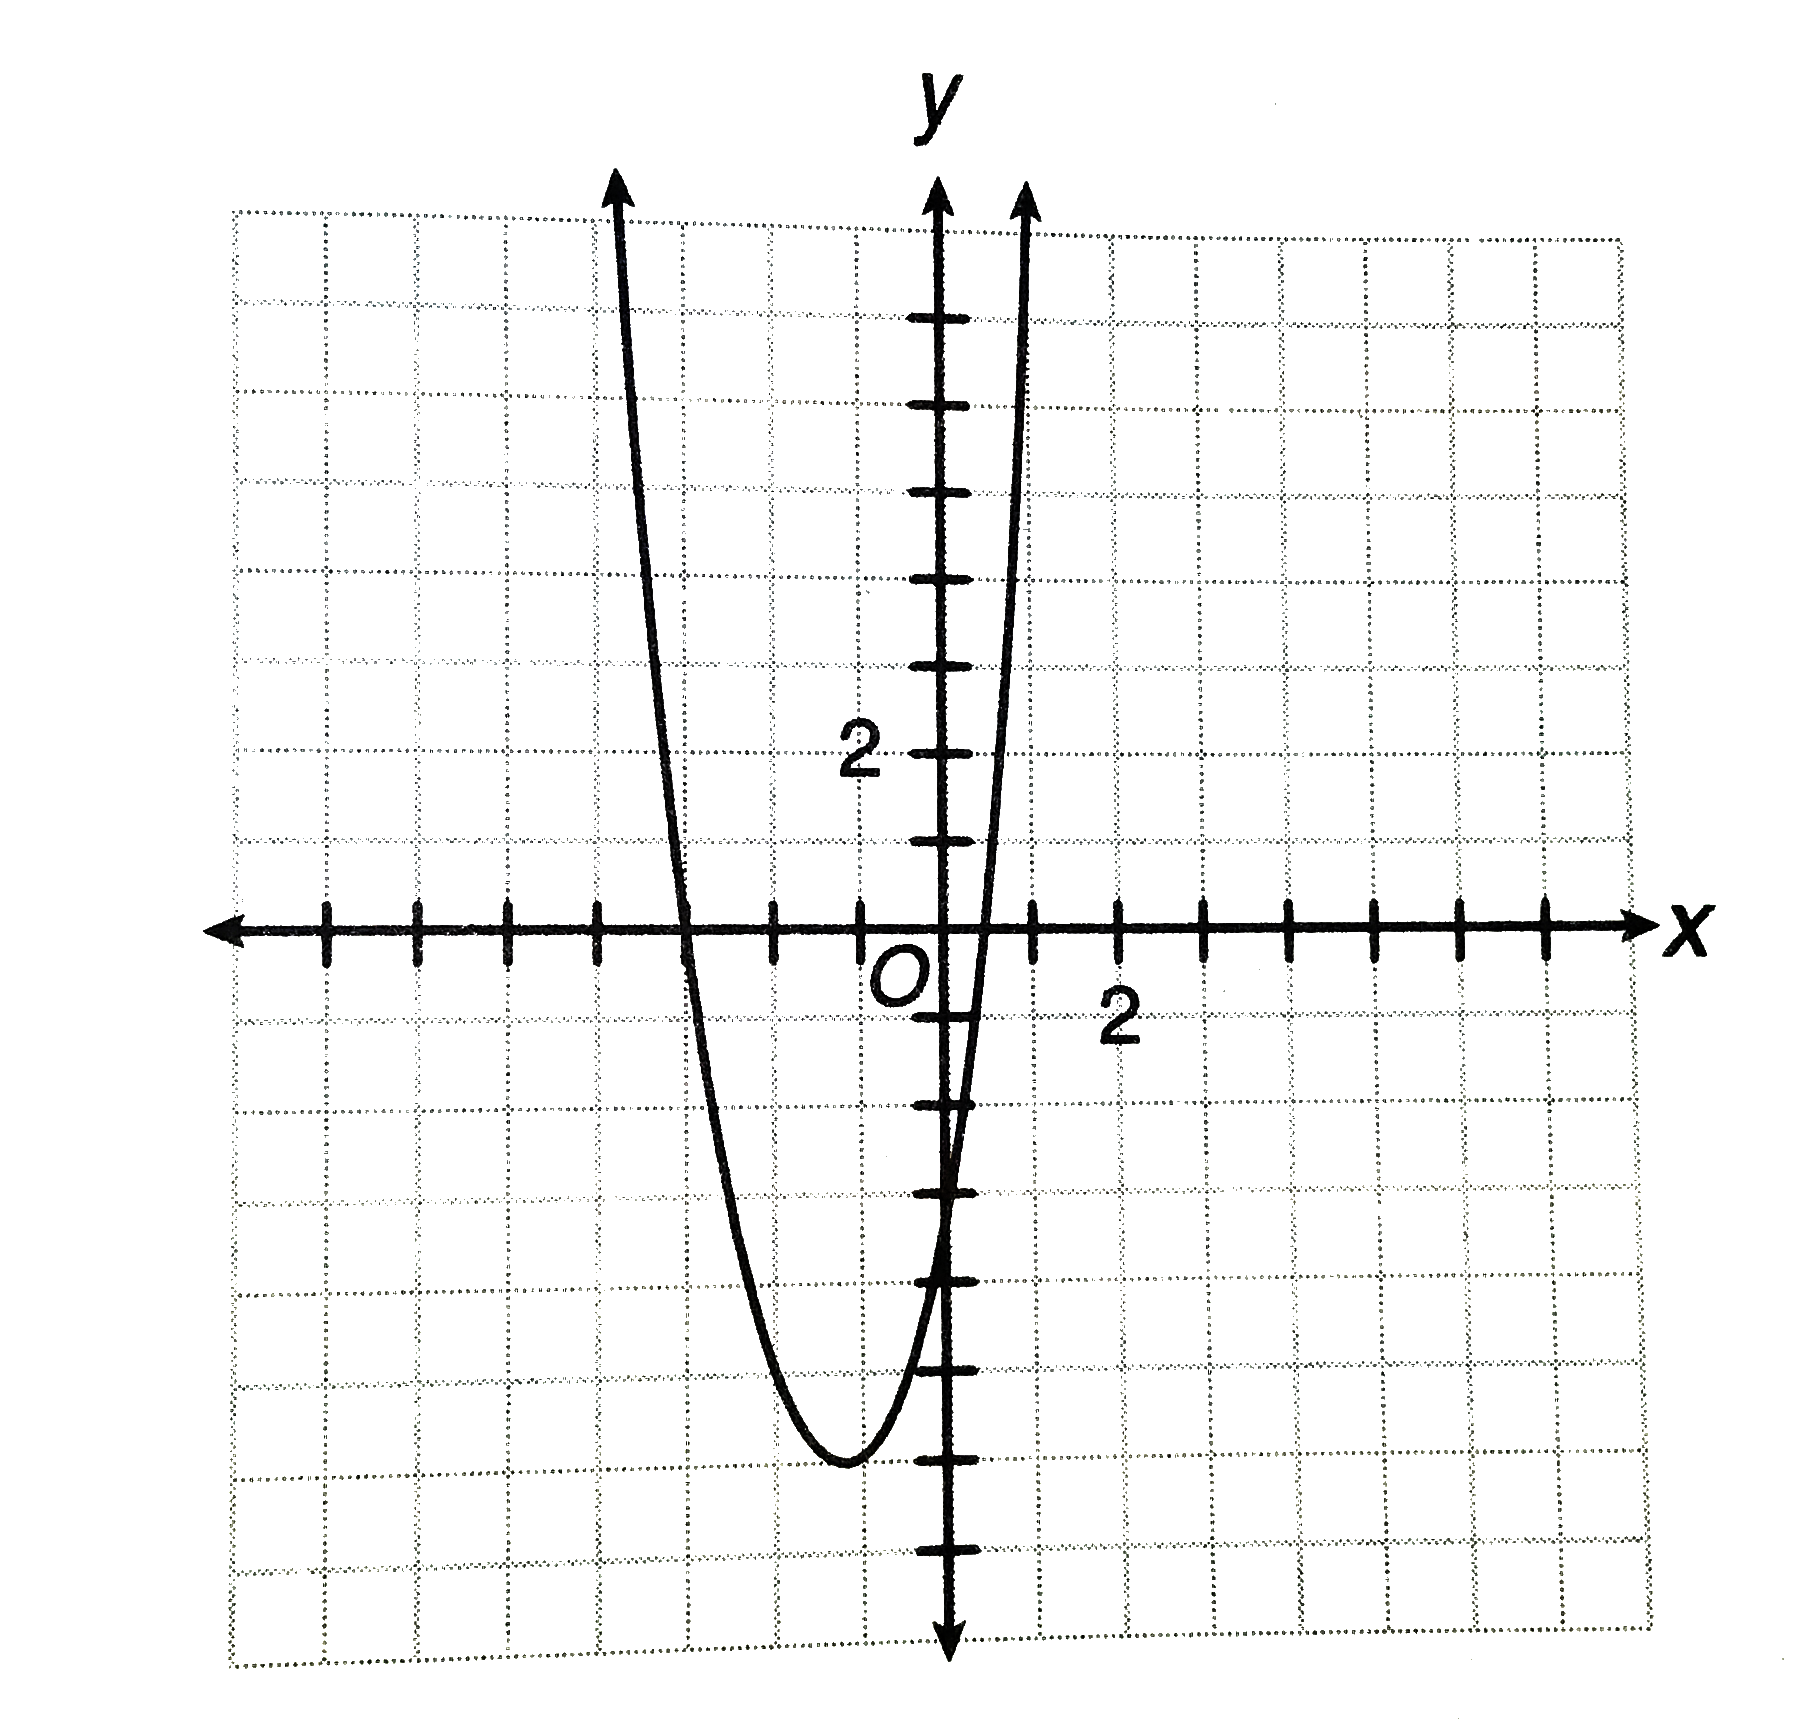
Which of the following could be the equation of the graph above?Ay=(x−3)(2x+1)By=(x+3)(2x−1)Cy=−(x−3)(1+2x)Dy=12(x+3)(x−1)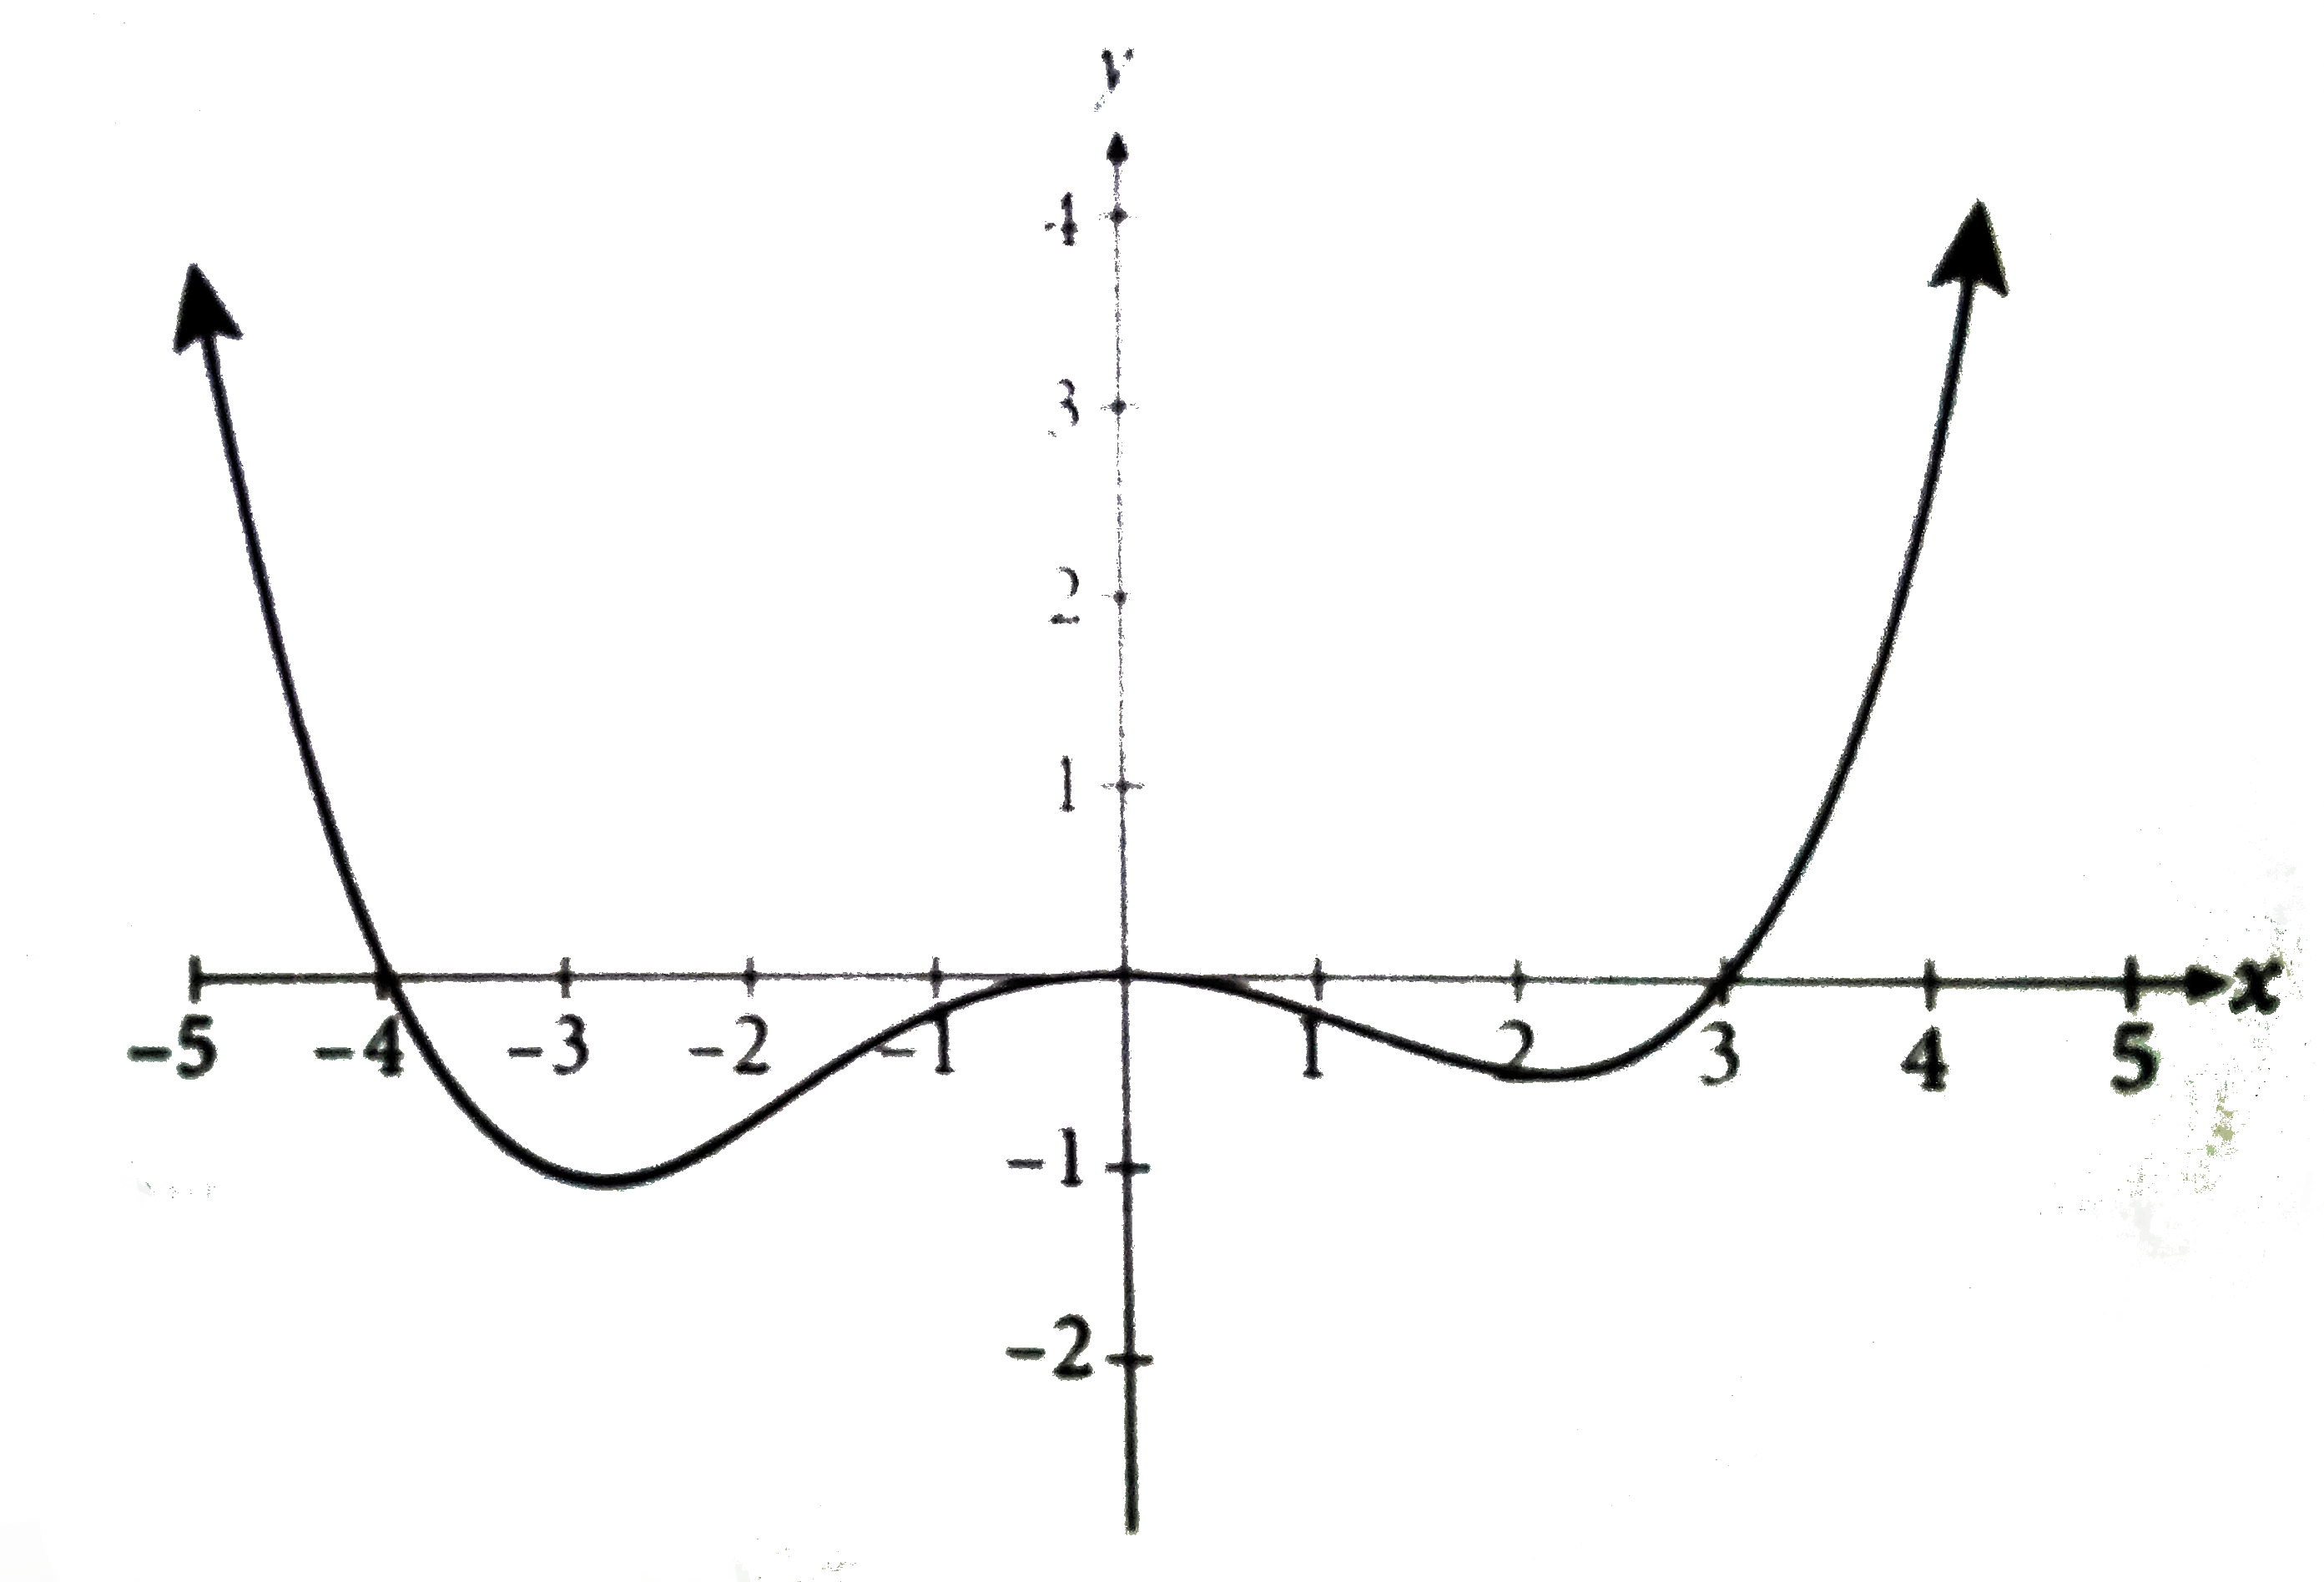
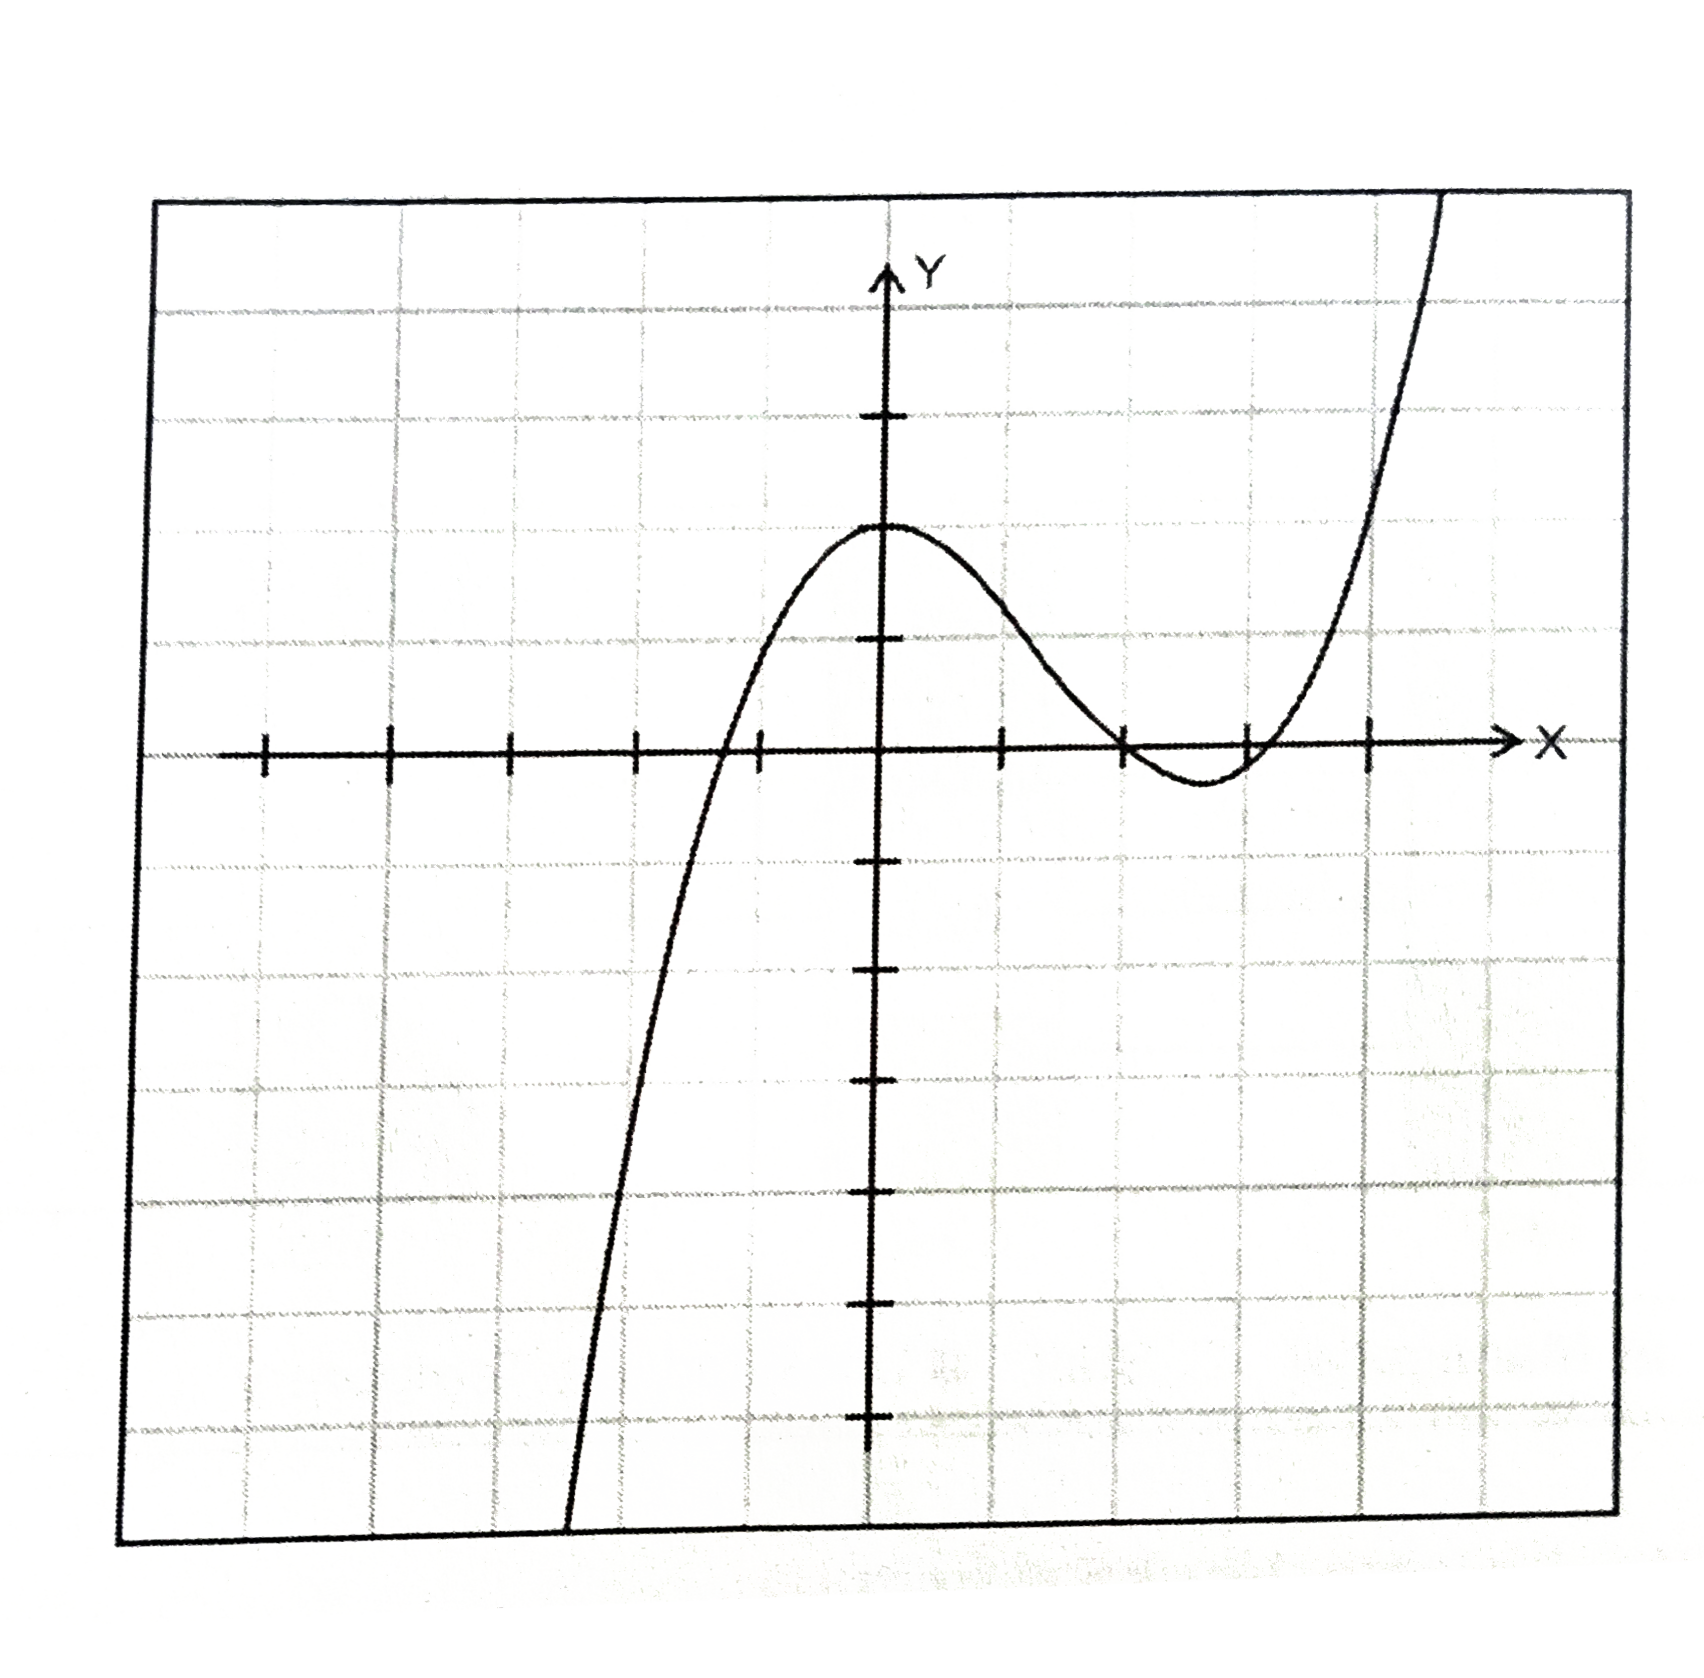
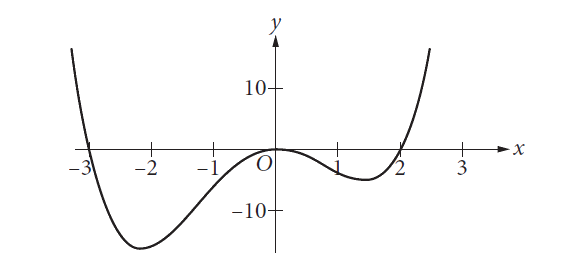
Which of the following could be the equation of the graph in the xy-plane shown above?Af(x)=x(x+3)(x−4)Bf(x)=x(x+4)(x−3)Cf(x)=x2(x+3)(x−4)Df(x)=x2(x+4)(x−3)Which of the following inequalities represents the graph shown below on the real number line ?
 A0<x<5B0<x≤4C−2<x≤4D1≤x≤4
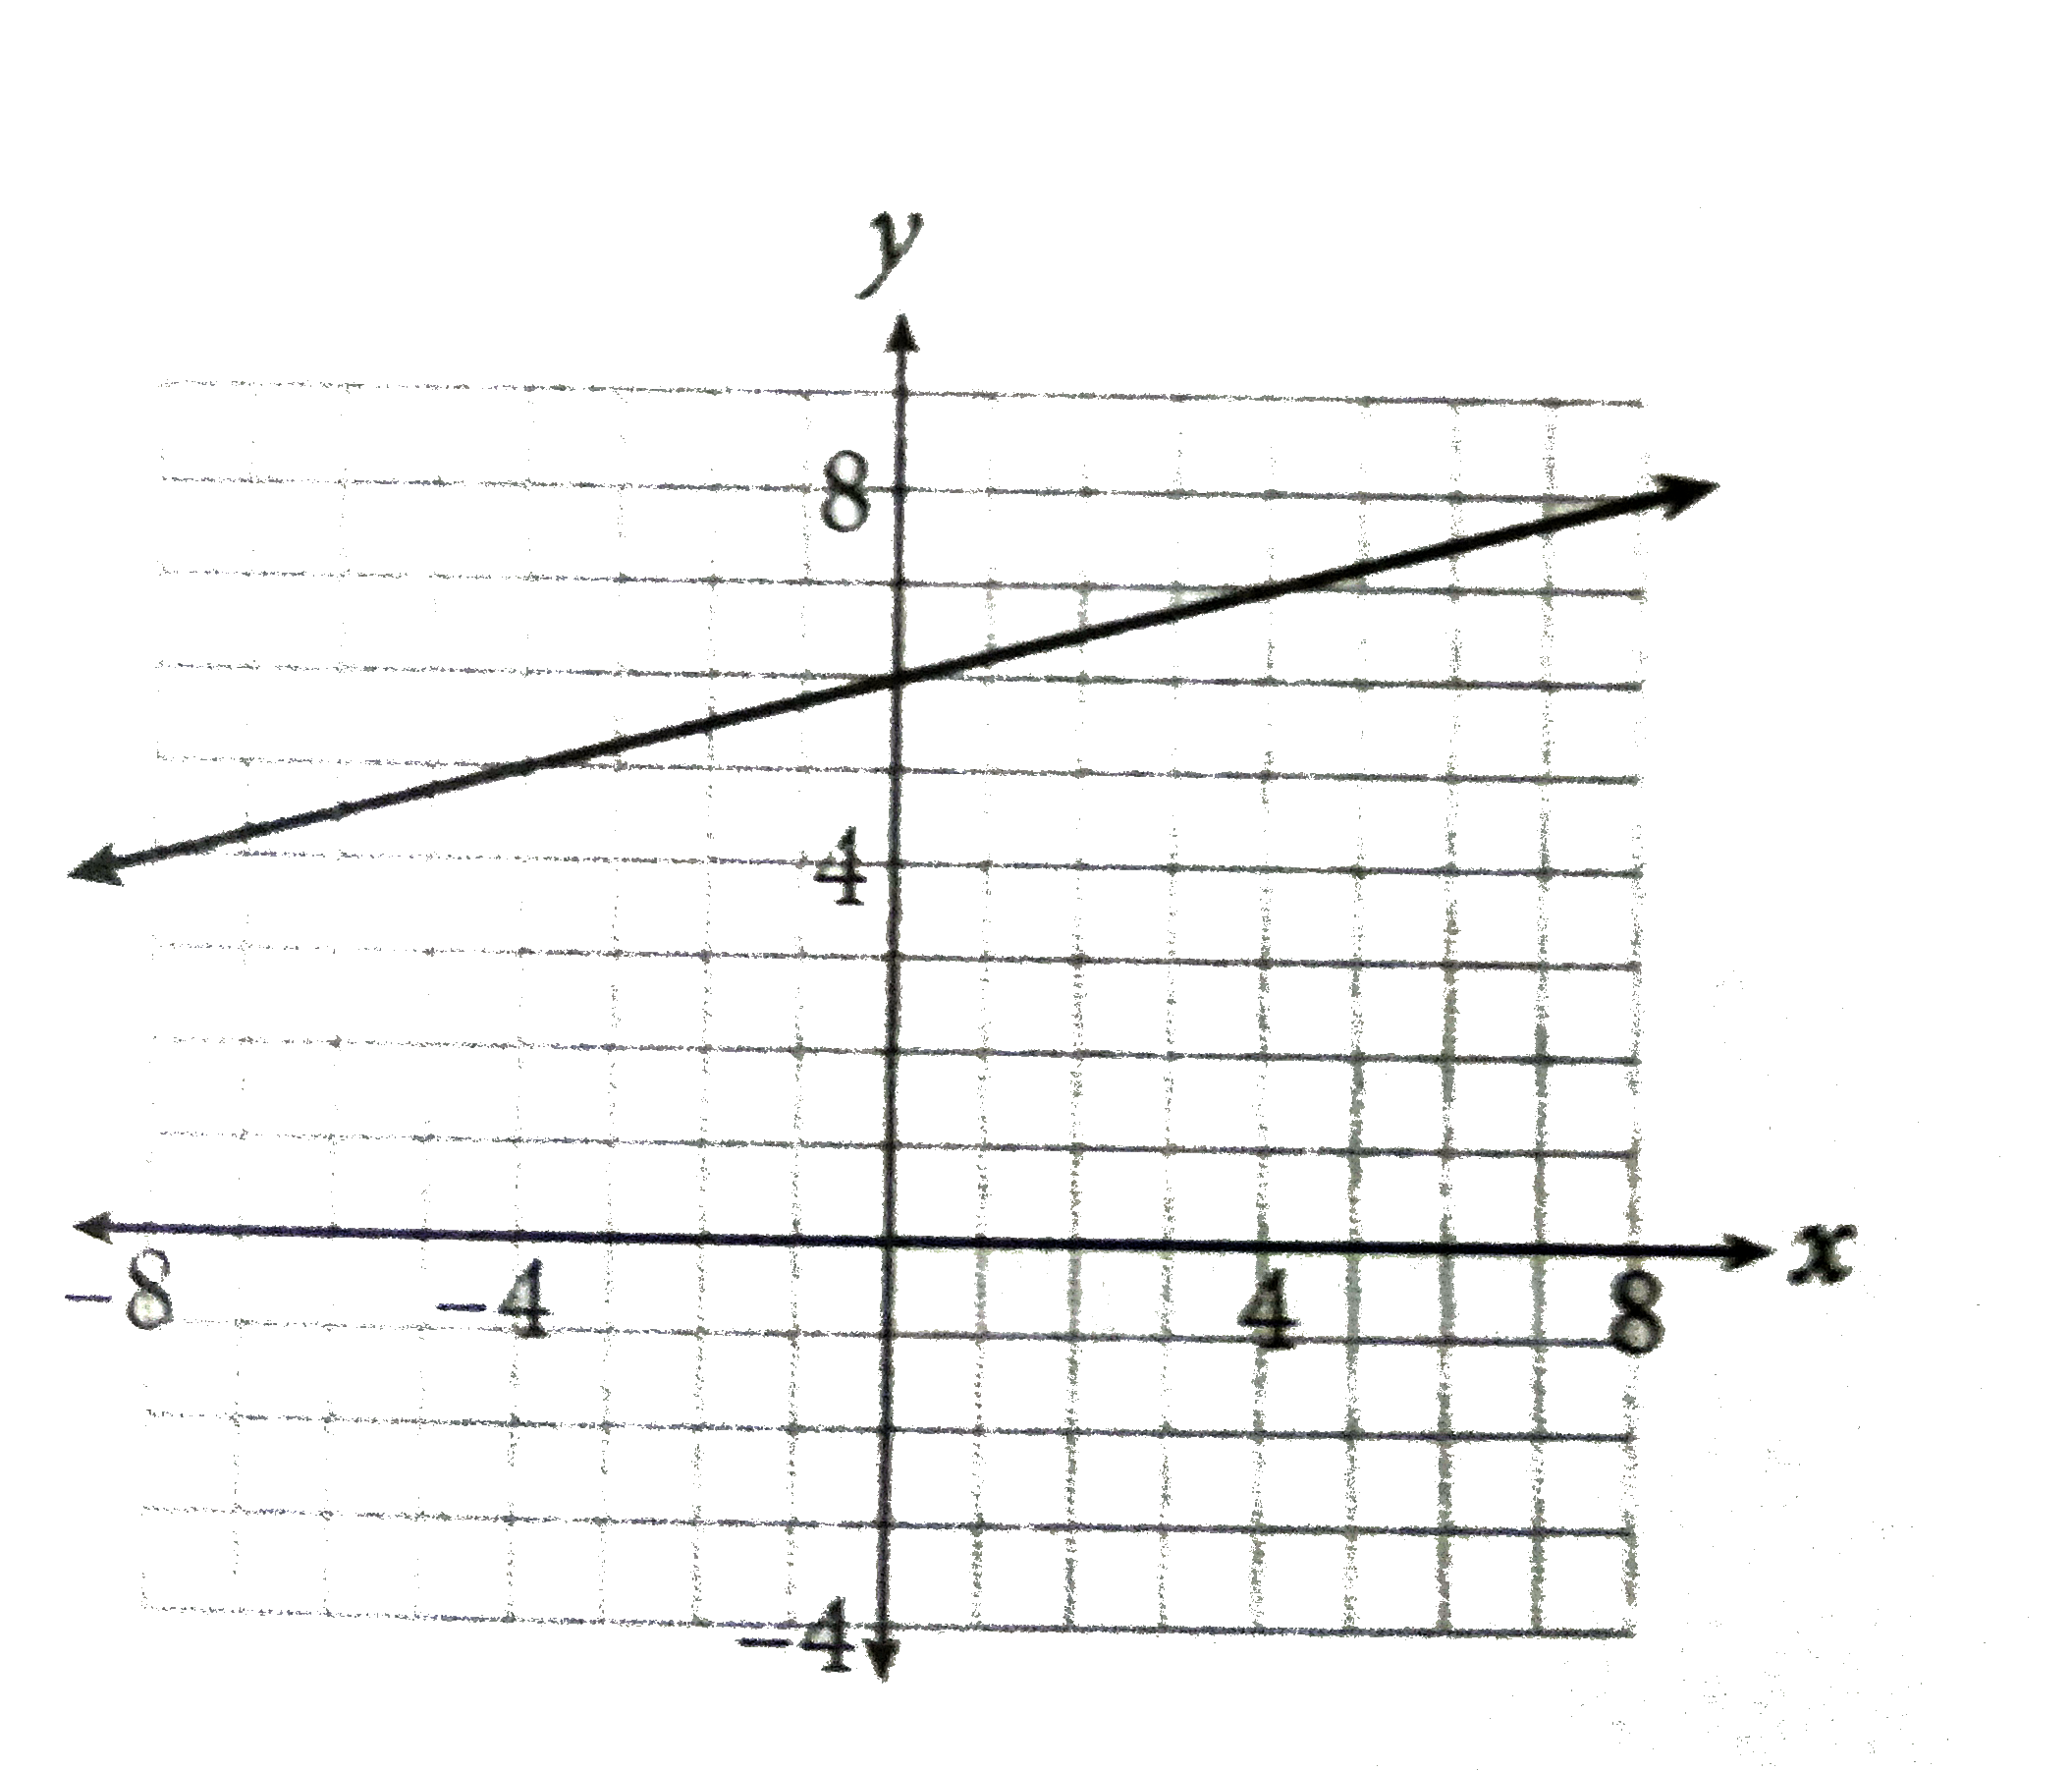
Which of the following equations represents the line shown in the graph?
View Solution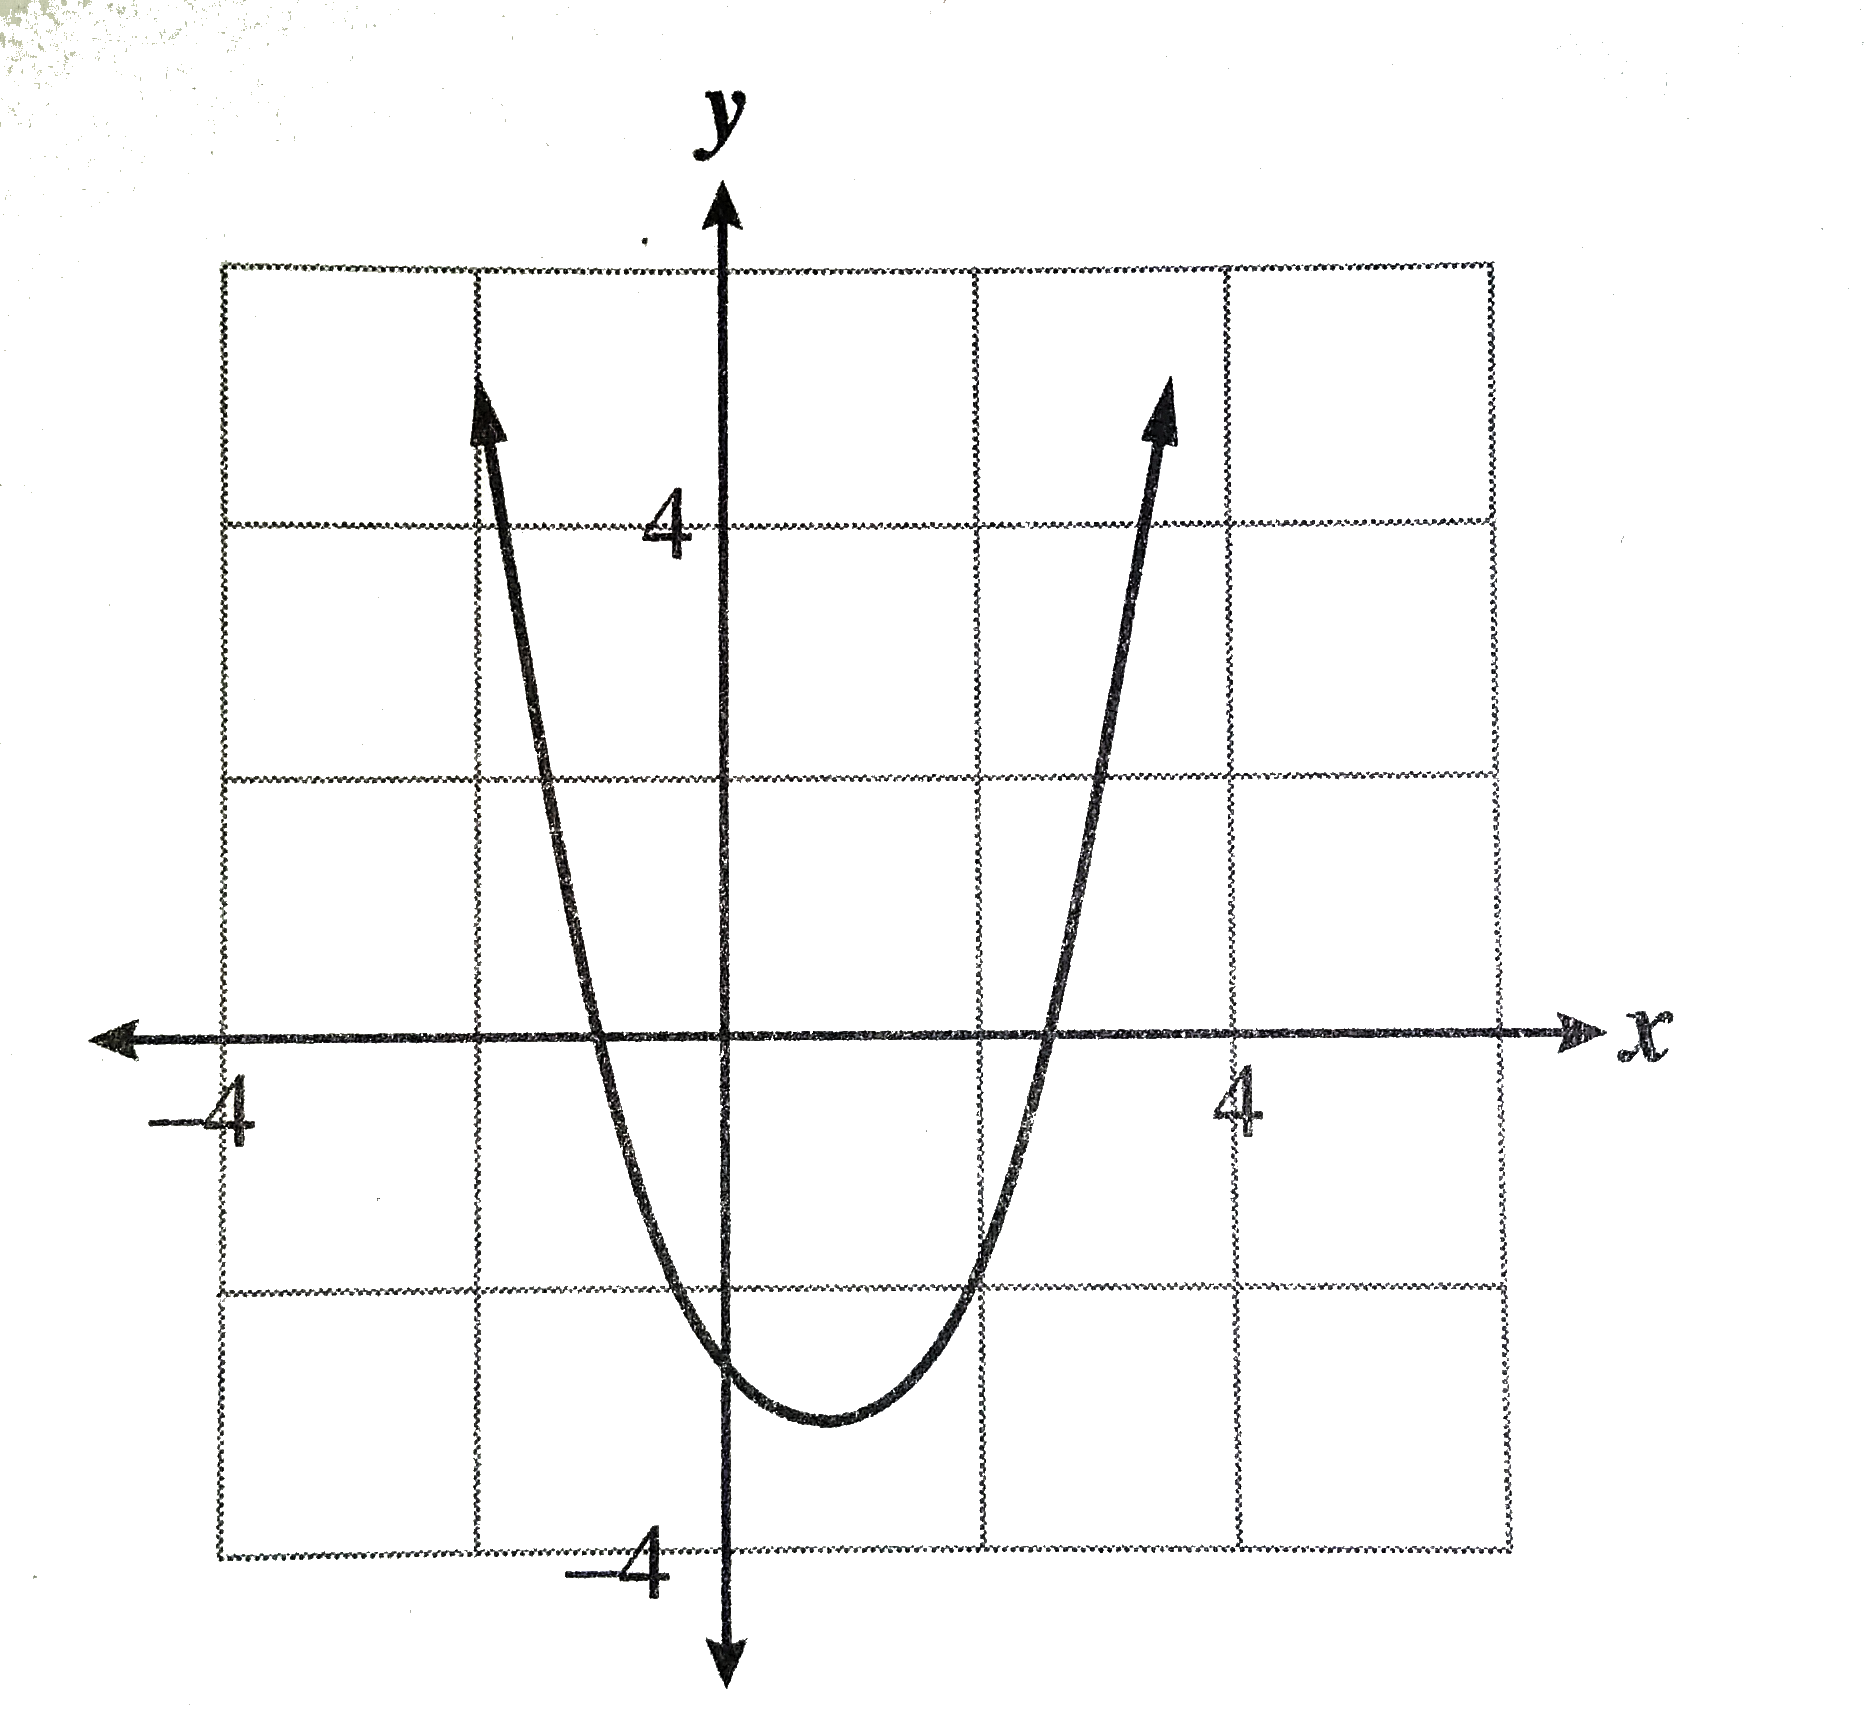
Each of the following quadratic equations represents the graph shown above. Which equation reveals the exact values of the x-intercepts of the graph?
View Solution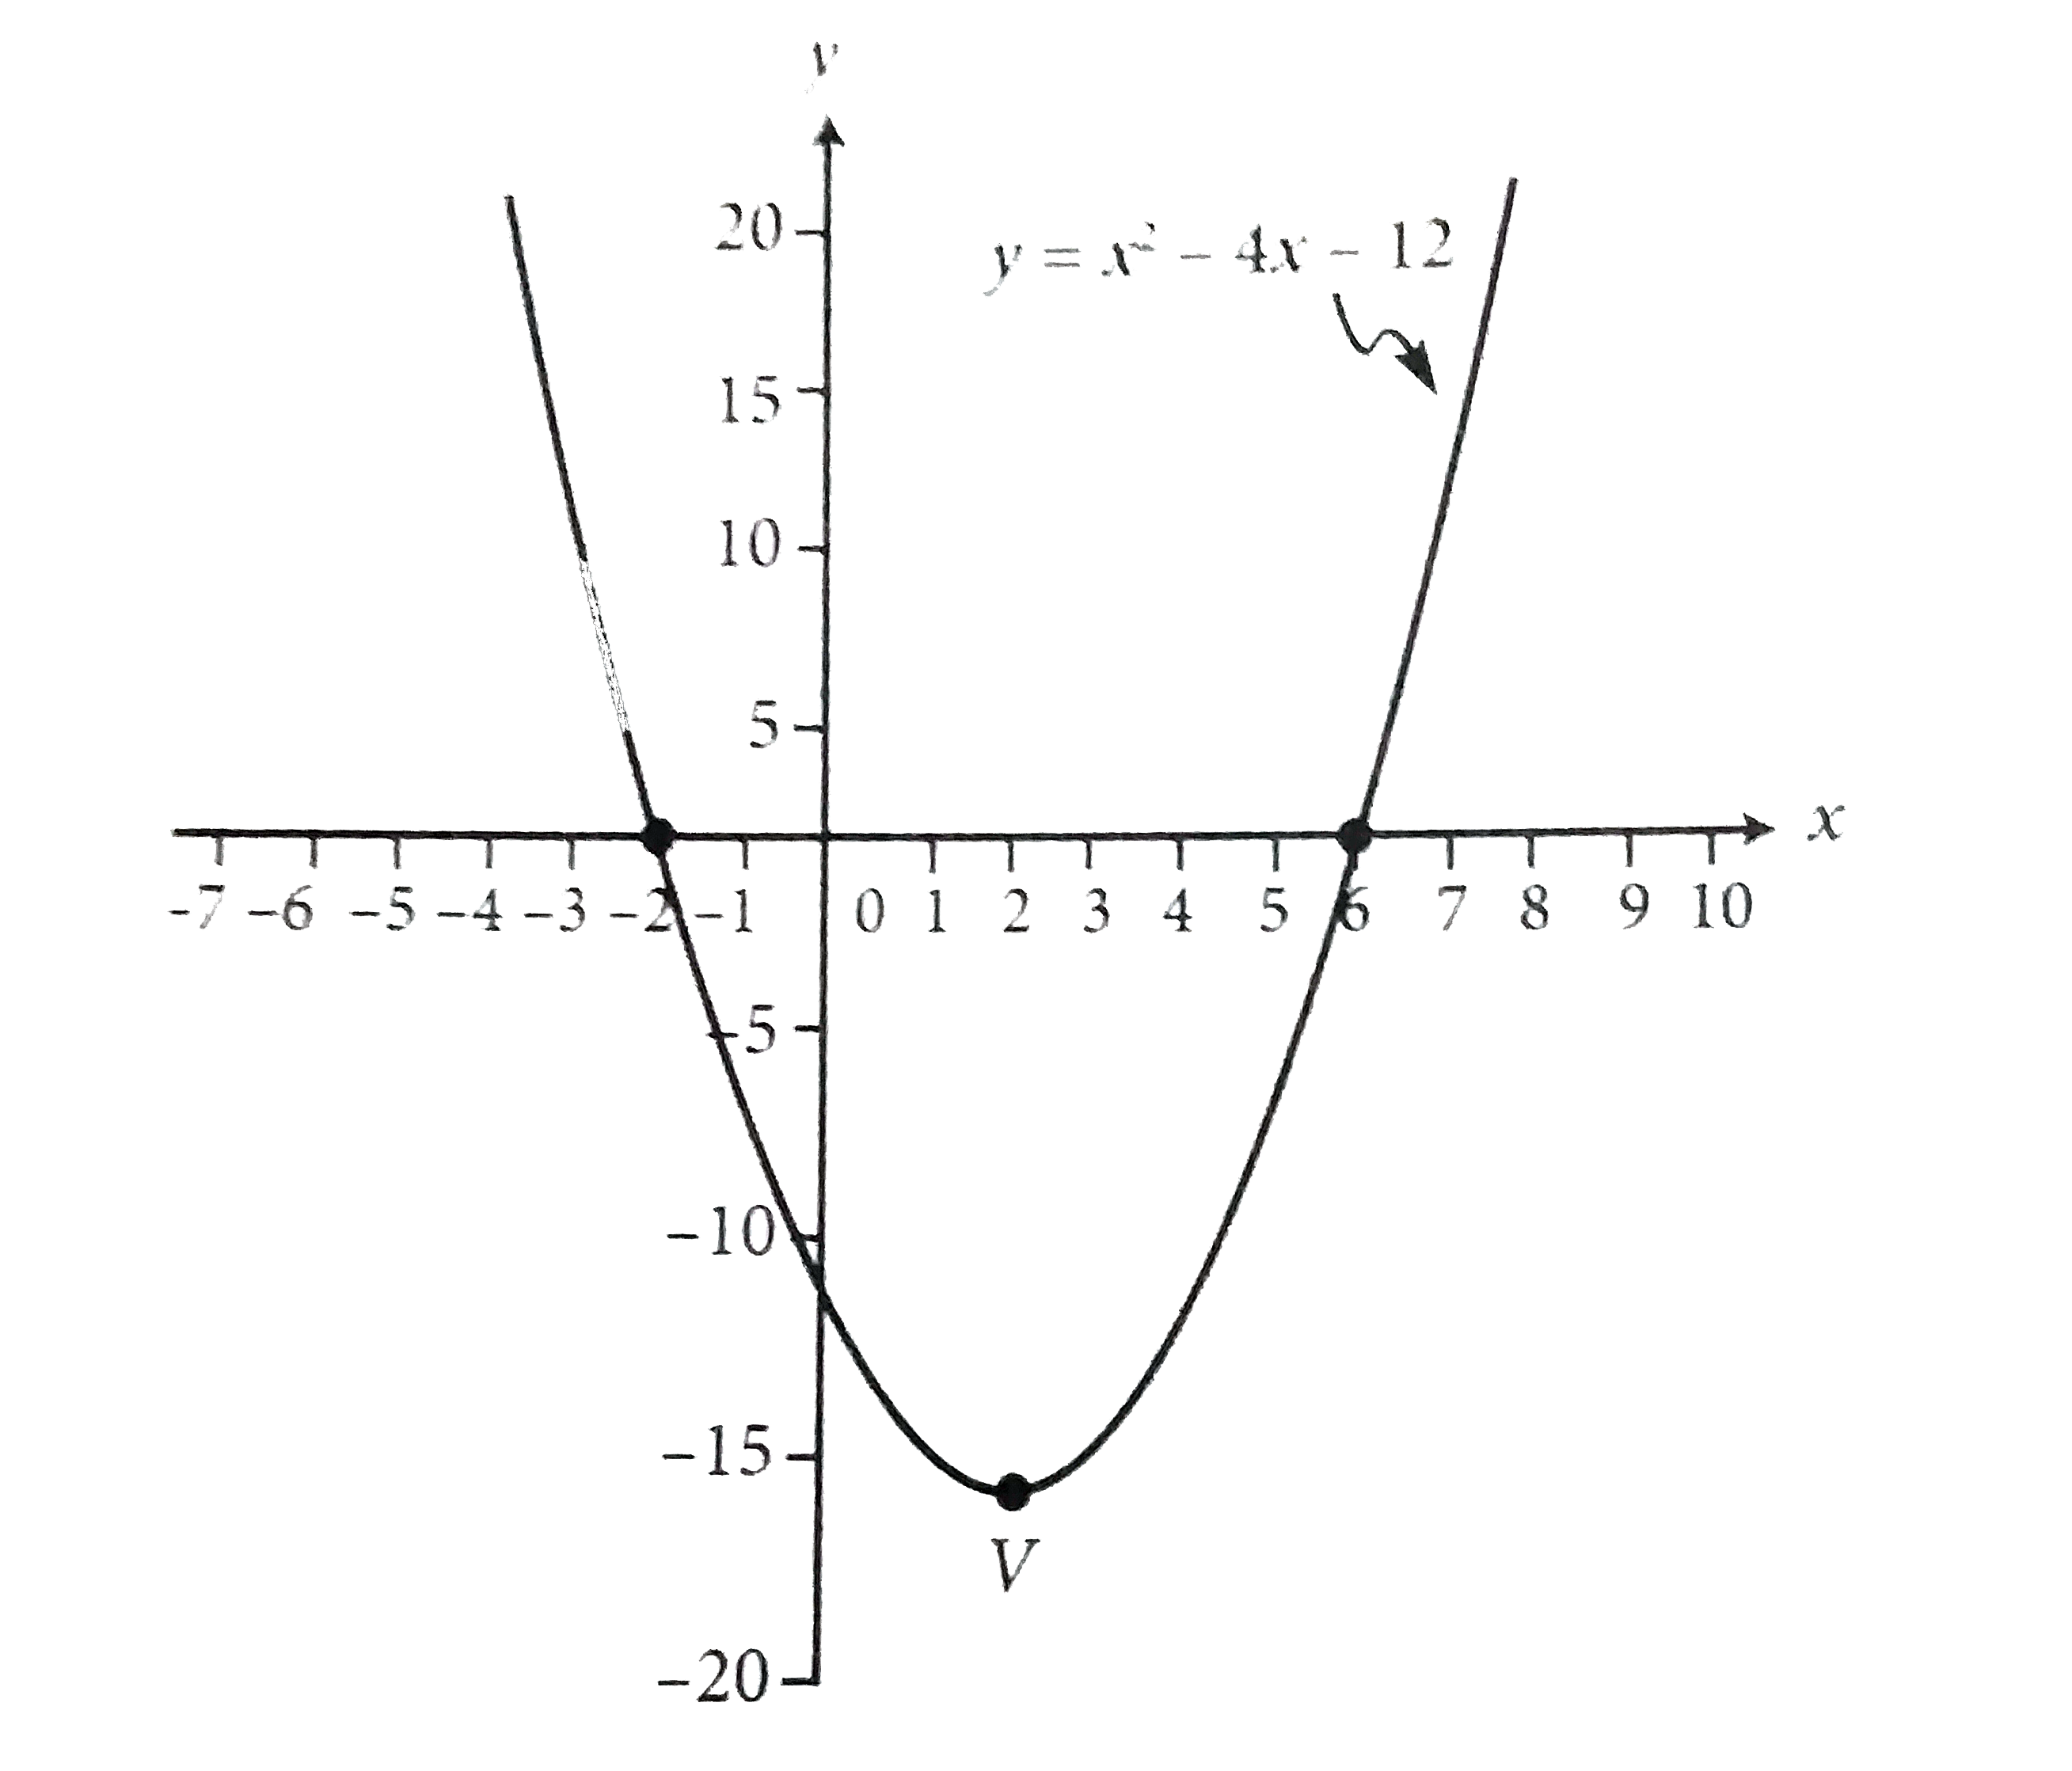
Which of the following is an equivalent form of the equation of the graph shown in the xy-plane above, from which the coordinates of vertex V can be identified from constants in the equation?
View Solution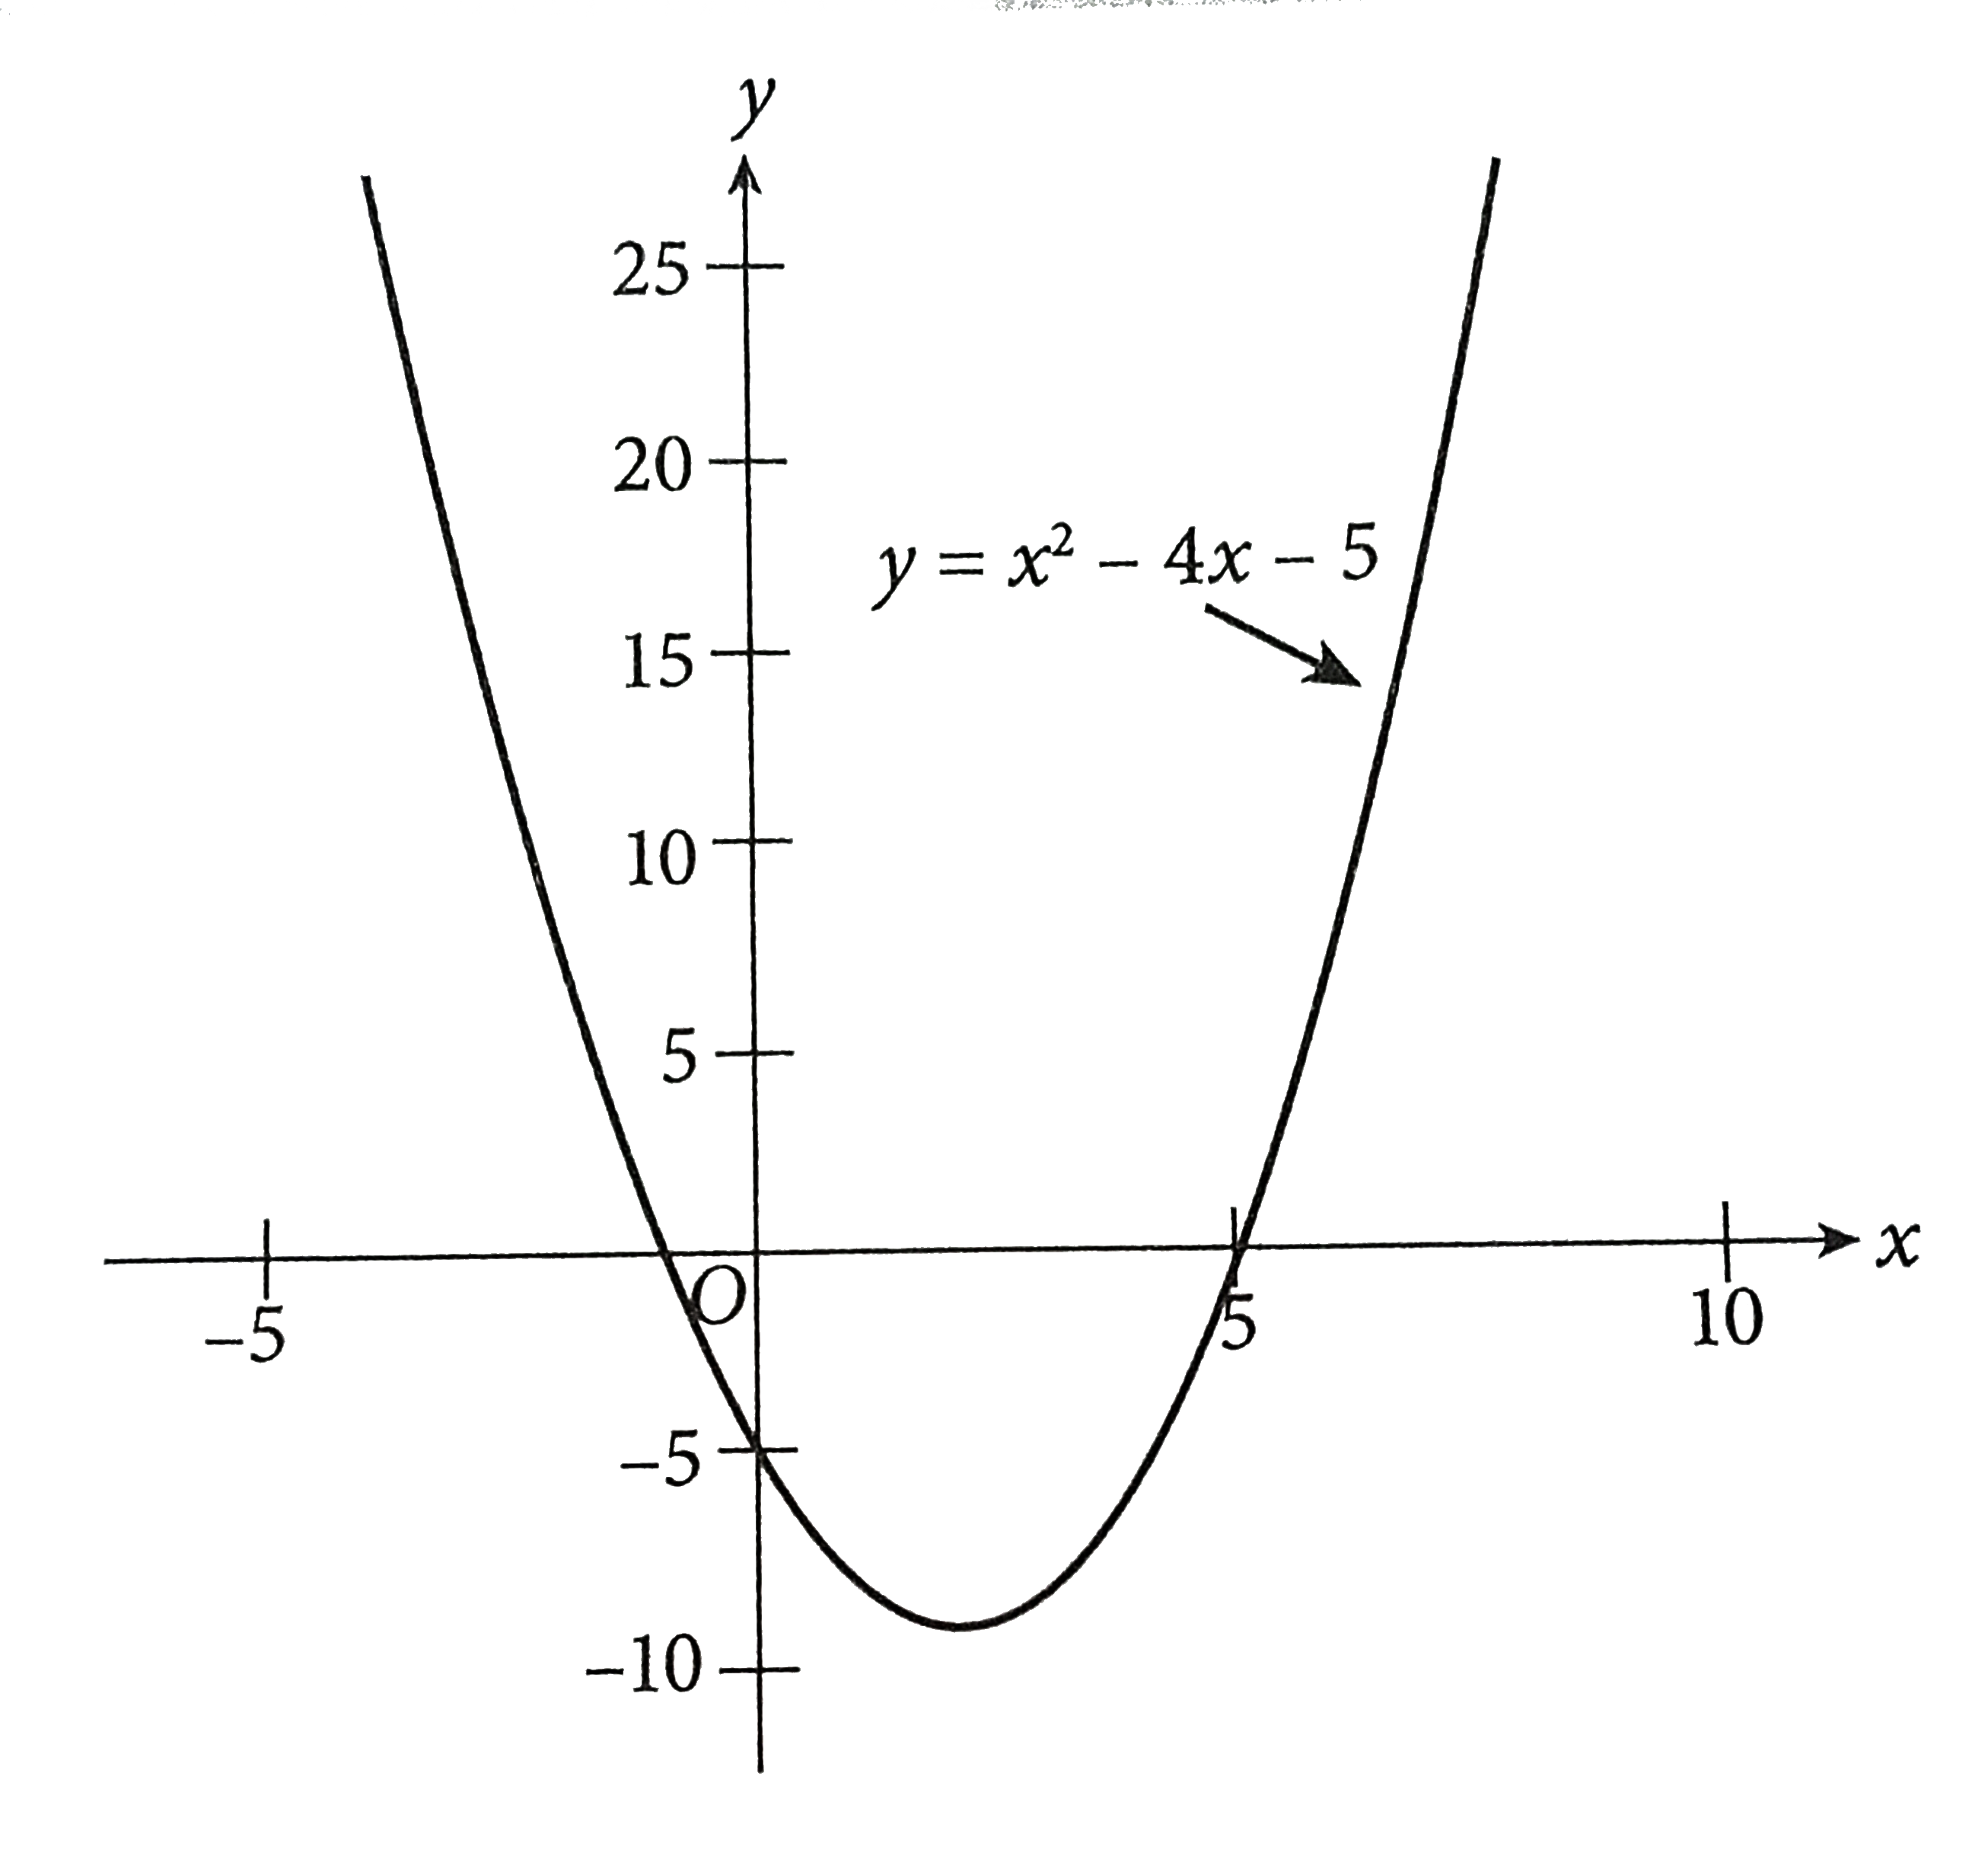
Which of the following is an equivalent form of the equation of the graph shown in the xy plane above, from which the coordinates of vertex Z can be identified as constant in the equation?
View Solution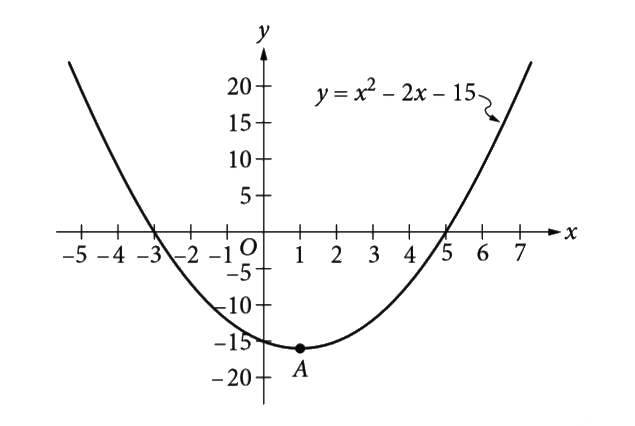
Which of the following is an equivalent form of the equation of the graph shown in the xy-plane above, from which the coordinates of vertex A can be identified as constants in the equation?
View Solution


