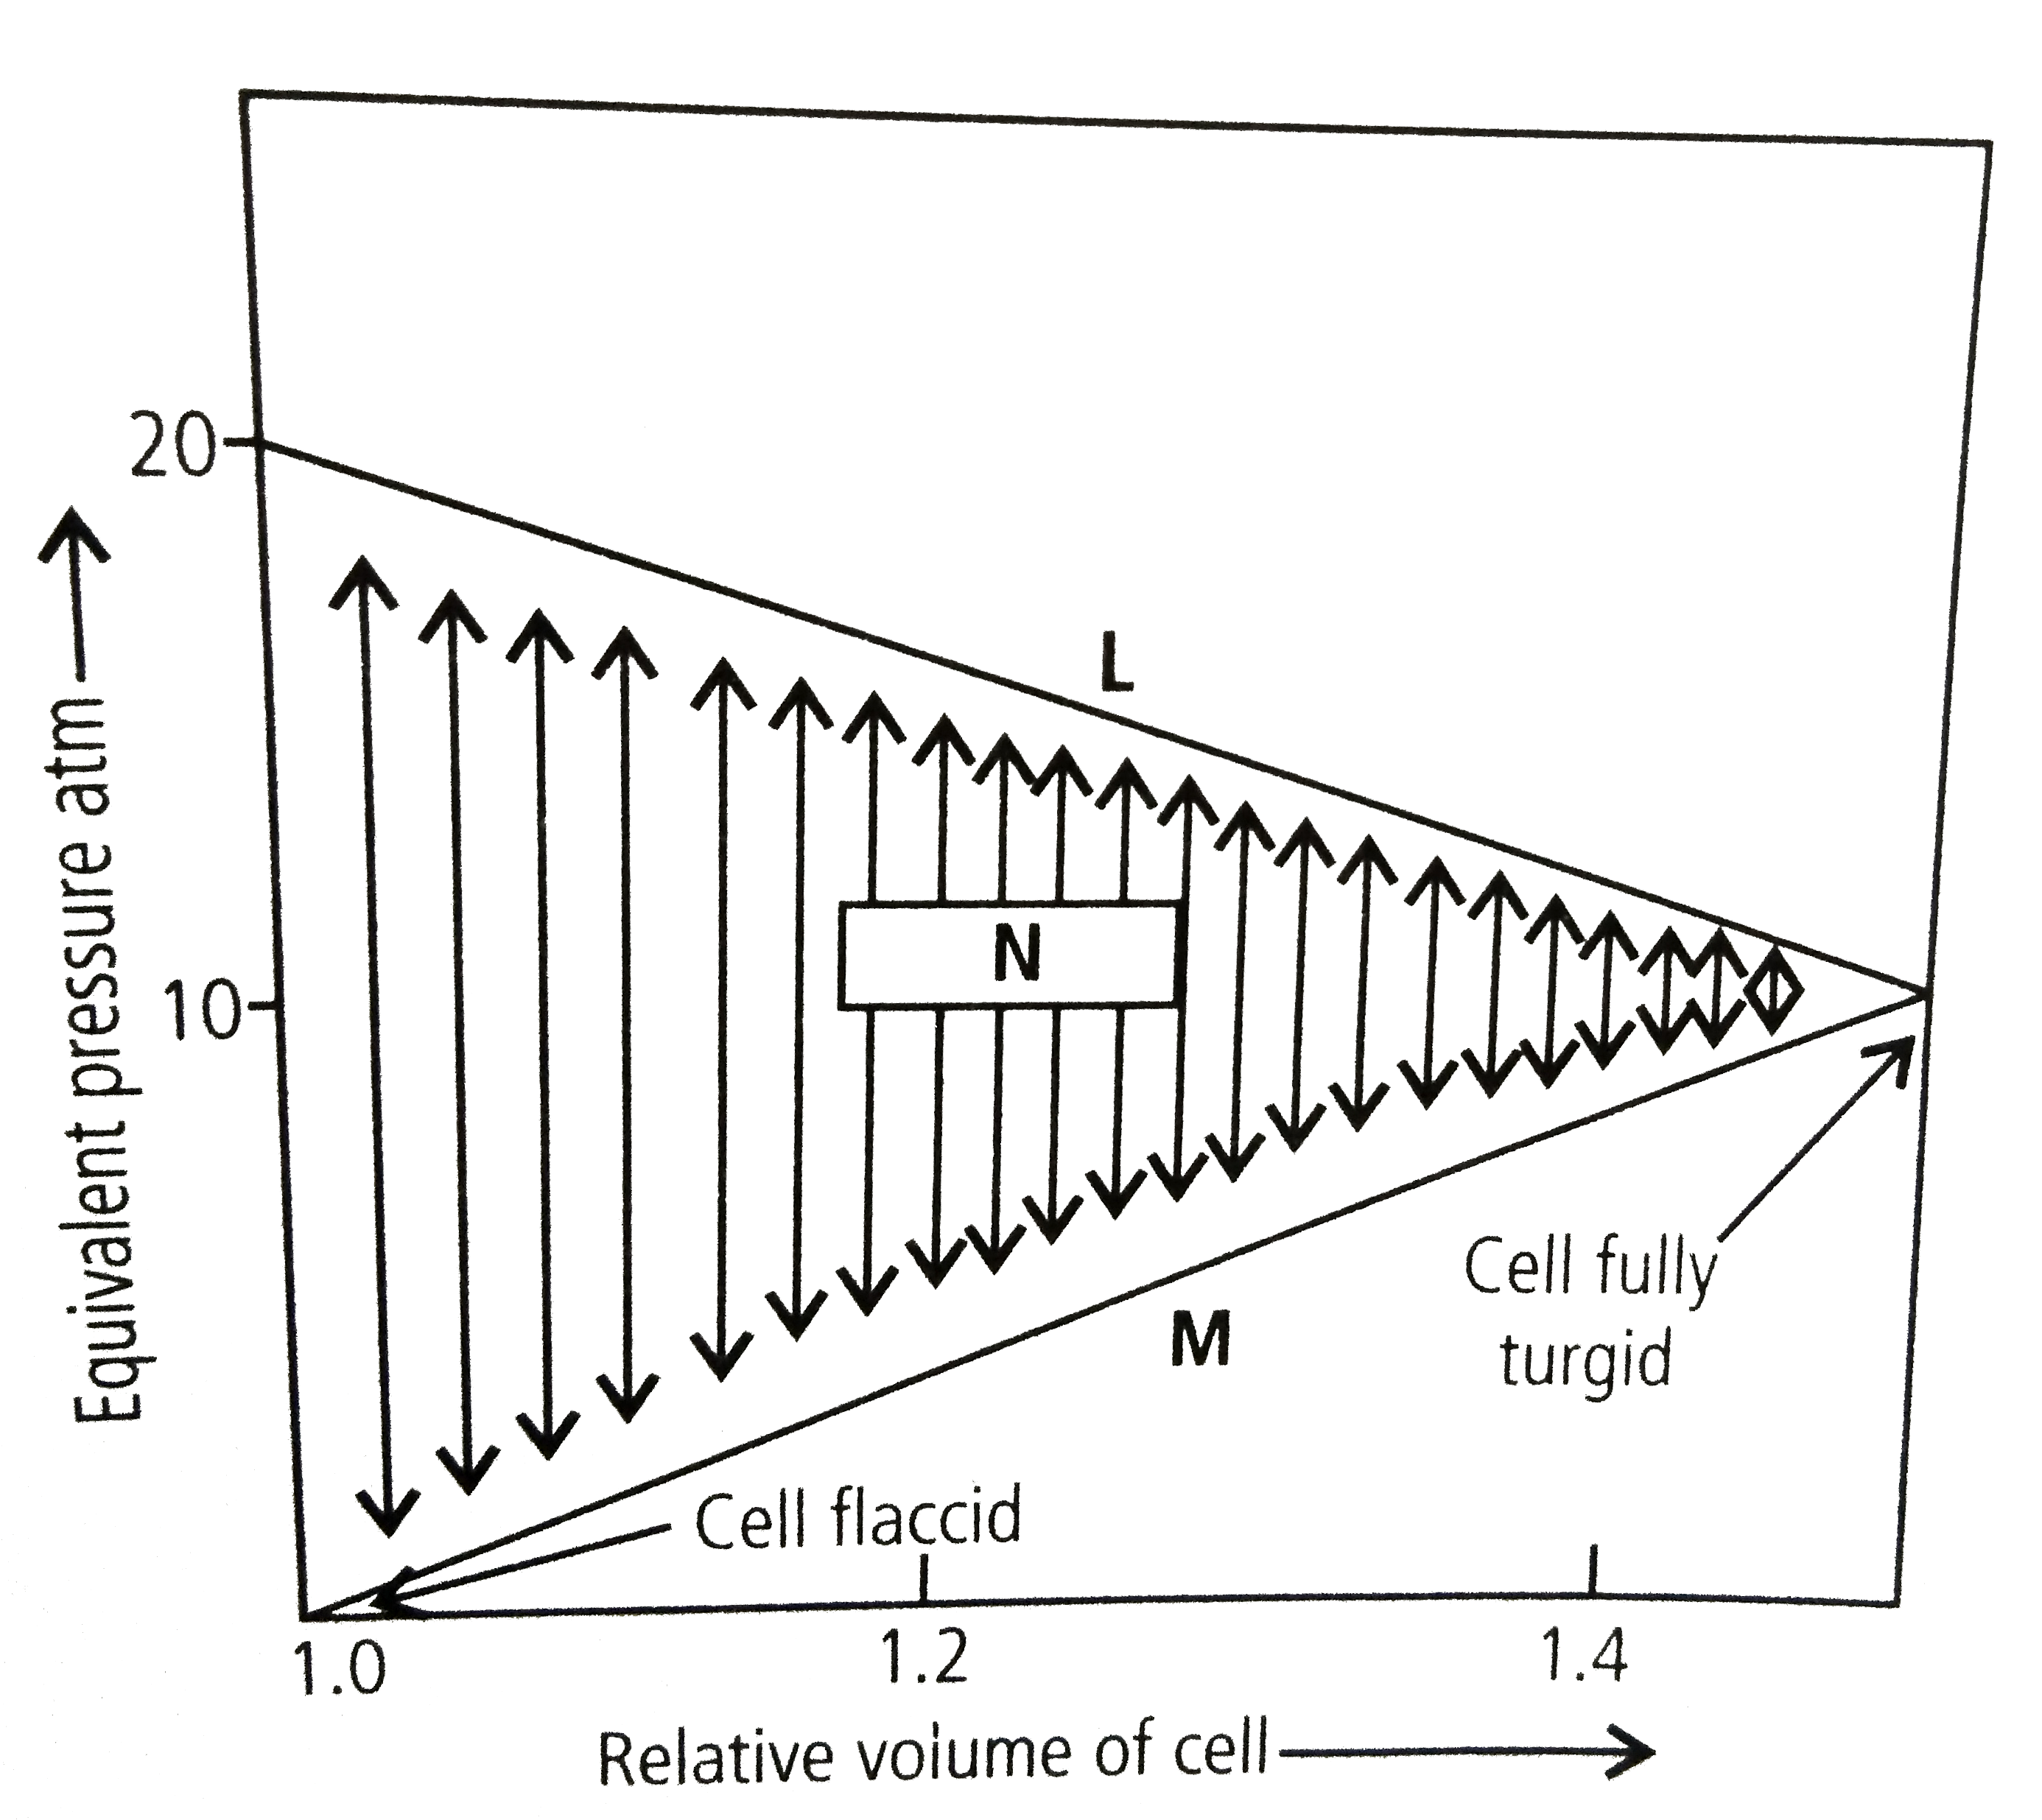
Given diagram illustrates the changes that occur when a plant cell takes up water Identify L,Mand N and select the incorrect statement the given diagram
A
N is the diffusion pressure deficit which becomes zero when LandM re equal in magnitude.
B
In a flaccid cell value of N becomes equal to that of L
C
Mrepresents osmotic pressure which increases when a flaccid cell takes up water.
D
L represents solute potential which decreases with the increase in turgidity of the cell .
Video Solution
Text Solution
The correct Answer is:C
Given diagram illustrates the changes that occur when a flaccid plant cell takes up water. Lrepresnets osmotic pressure (OP) or solute potential (Ψs), M represents turgor pressure (TP) or pressure potential (Ψρ) and N represents diffusion pressure deficit (DPD) or water potential (Ψw).
In a flaccid cell, TP is zero, therefore, DPD=OP−0=OP. When a flaccid cell is placed in water it takes up water due to endosmosis OP of the cell starts decreasing while TP starts increasing. In fully turgid condition OP and TP become equal so that DPD becomes zero.
|
Topper's Solved these Questions
Similar Questions
Knowledge Check
Identify the incorrect statement about the given diagram :−
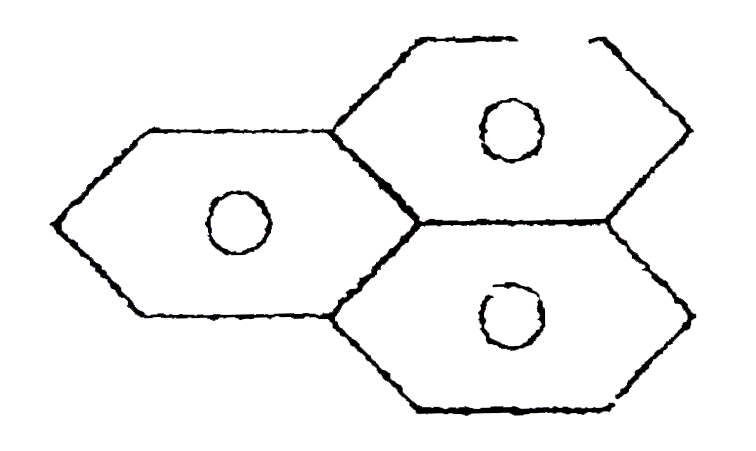 ASingle this layer of flattened cells with irregular boundariesBFound in the walls of blood vesselsCInvolved in functions like forming a diffusion boundaryDSpecialited cell juncitons are absent
Select incorrect option w.r.t. given diagram
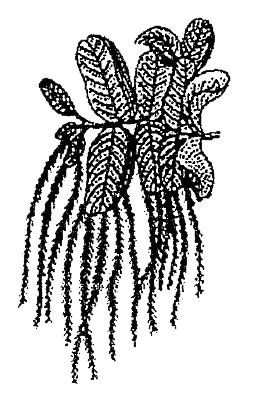 AHeterosporousBAquatic fernCBelongs to class pteropsidaDGametophytic main plant body
Identify the given microorganism and select the incorrect statement regarding it.
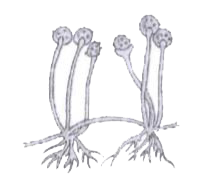 AIt is a saprophyte commonly called as black bread mould.BIt reproduces by means of spores.CIt results in the spoilage of food materials.DIt is a parasitic fungus that causes various diseases in plants, animals and humans.
On the basis of below given diagram select the incorrect statement -

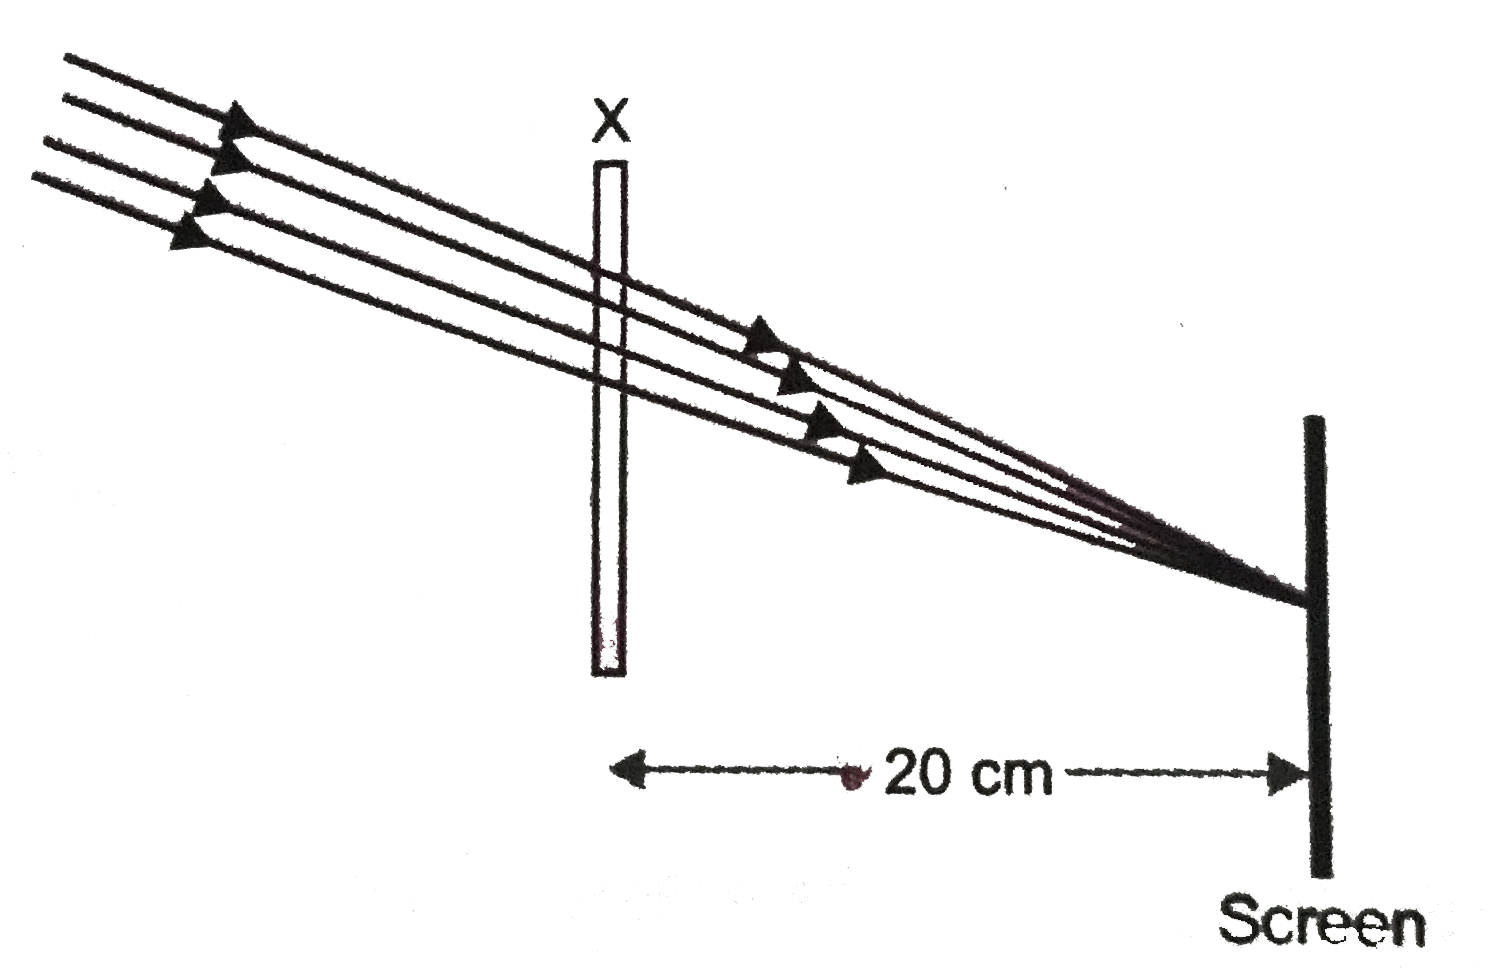
View SolutionStudy the given ray diagrams and select the correct statement from the following :
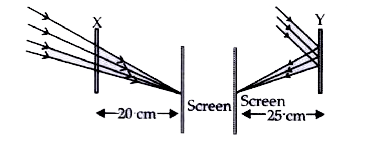
View SolutionStudy the given ray diagrams and select the correct statement from the following:
View SolutionRefer to the given Venn diagram and select the correct statement regarding P, Q and R.
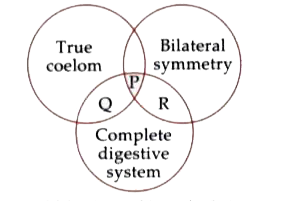
View SolutionRefer to the given Venn diagram and select correct statement regarding P and Q.

View Solution


