Which one of the following graphs in figure shows the variation of photoelectric current (I) with voltage (V) between the electrodes in a photoelectric cell?

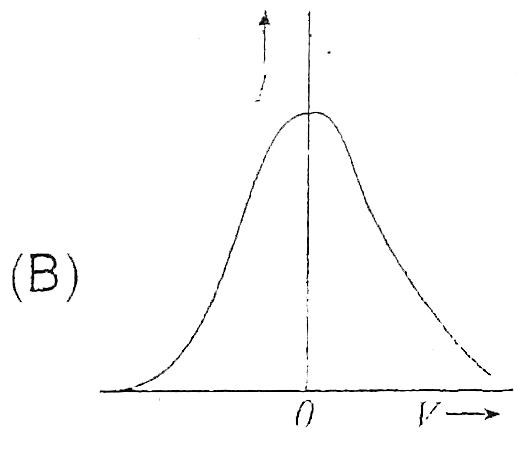
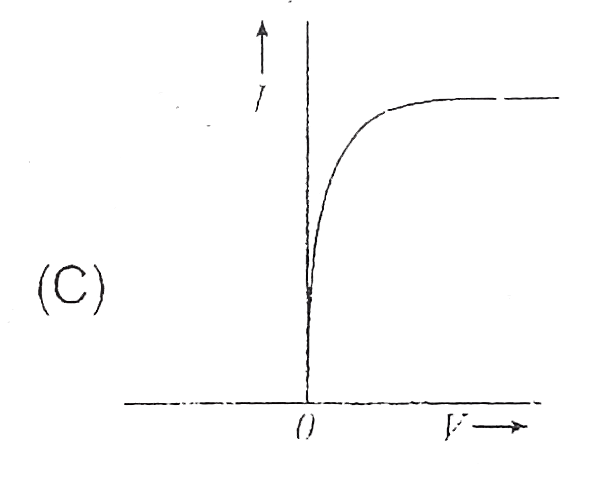
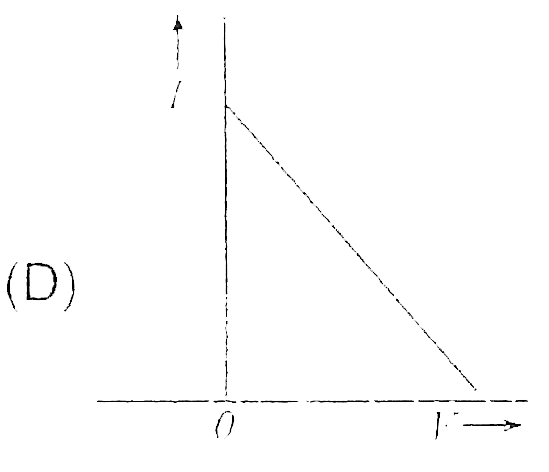
The correct Answer is:A
Experimental observation.
Topper's Solved these Questions
- ATOMIC PHYSICSBook:RESONANCEChapter:ATOMIC PHYSICSExercise:Exercise (2) Only one option correct type
Explore 30 Videos
- ATOMIC PHYSICSBook:RESONANCEChapter:ATOMIC PHYSICSExercise:Exercise-2 part-II Single and double value integer type
Explore 12 Videos
- ATOMIC PHYSICSBook:RESONANCEChapter:ATOMIC PHYSICSExercise:Exercise 1 Part-1 subjective questions
Explore 35 Videos
- ALTERNATING CURRENTBook:RESONANCEChapter:ALTERNATING CURRENTExercise:HIGH LEVEL PROBLEMS
Explore 11 Videos
- CAPACITANCEBook:RESONANCEChapter:CAPACITANCEExercise:High Level Problems
Explore 16 Videos
Similar Questions
Knowledge Check
Which among the following graphs explains the photoelectric effect?
A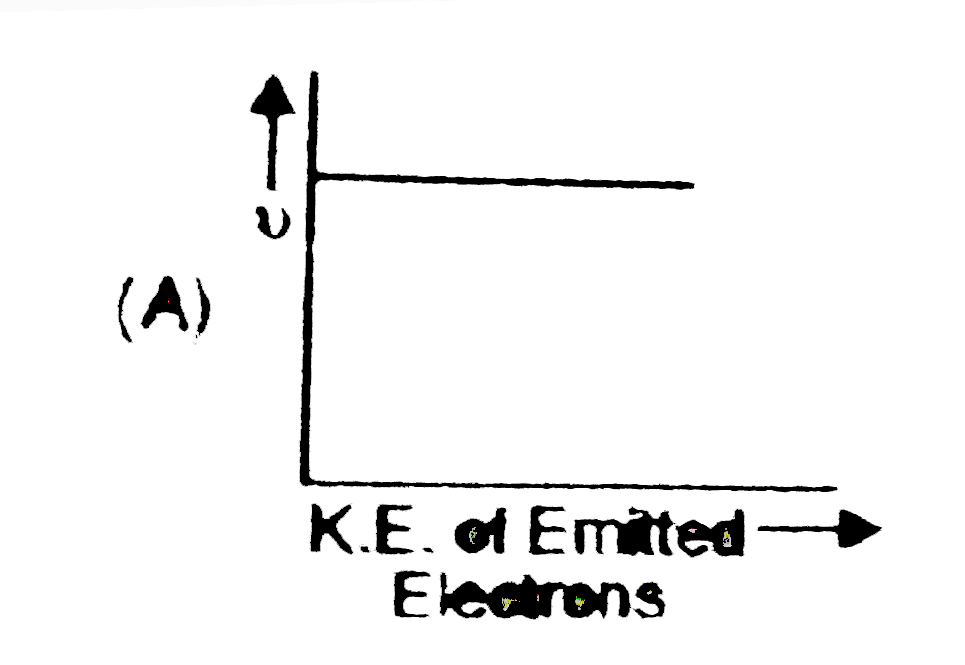 B
B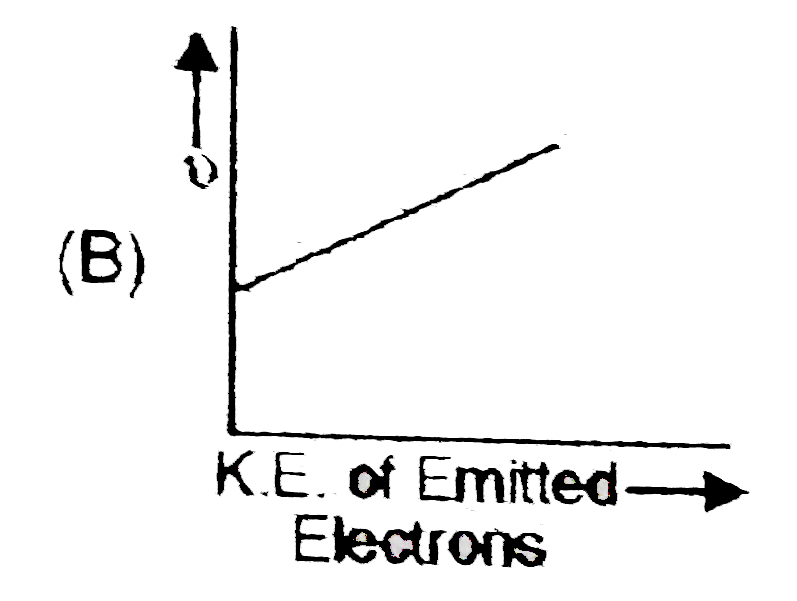 C
C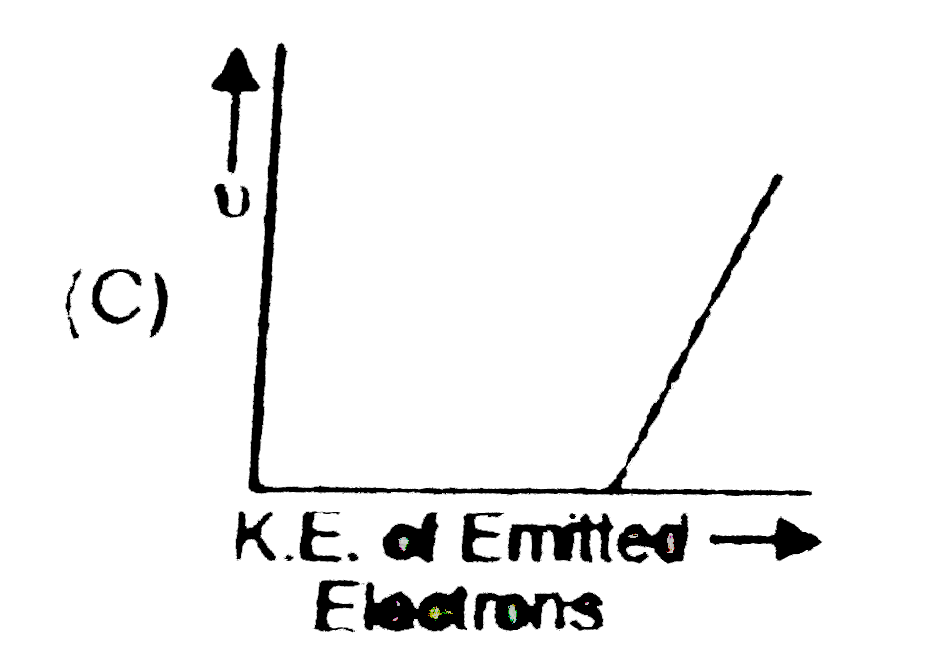 D
D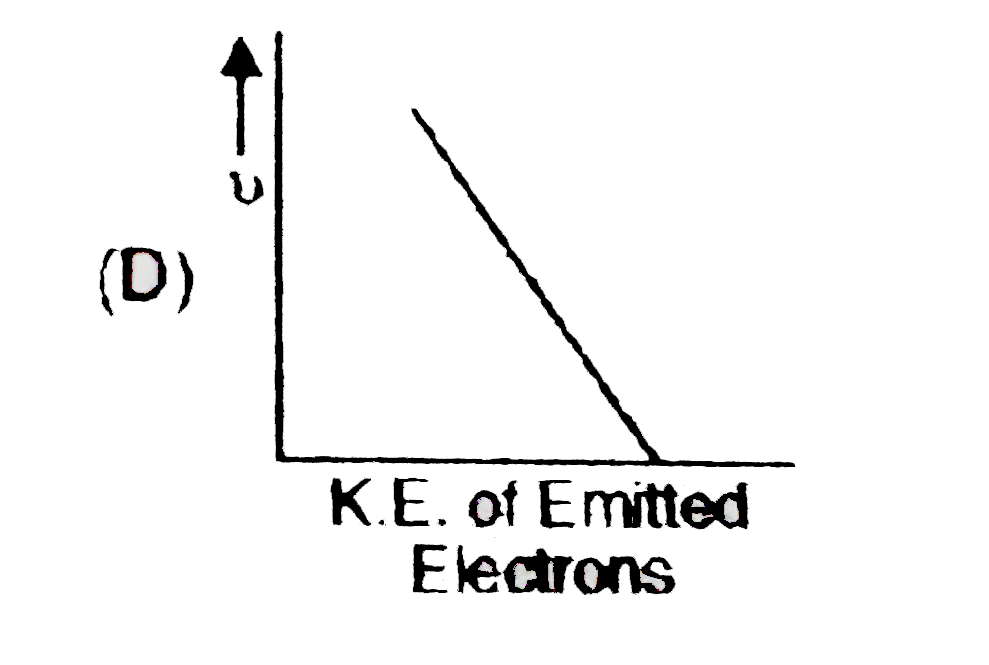
Which of the following graphs shows variation between density of water and temperature?
A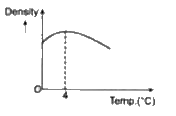 B
B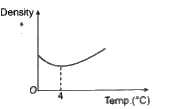 C
C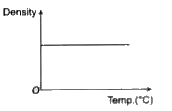 D
D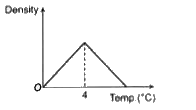
Which one of the following is true in photoelectric emission
Aphotoelectric current is directly proportional to the amplitude of light of given frequencyBphotoelectric current is directly proportional to the intensity of light of given frequency at moderate intensitiesCabove the threshold frequency the maximum kinetic energy of photoelectrons is inversely proportional to incident frequencyDthe threshold frequency depends on the intensity of incident light
The graph of Fig. shows the variation of photoelectric current (I) versus applied voltage (V) for the two different photosensitive materials for two different intensities of the incident radiation. Identify the pairs of curves that correspond to different materials but same intensity of incident radiation.
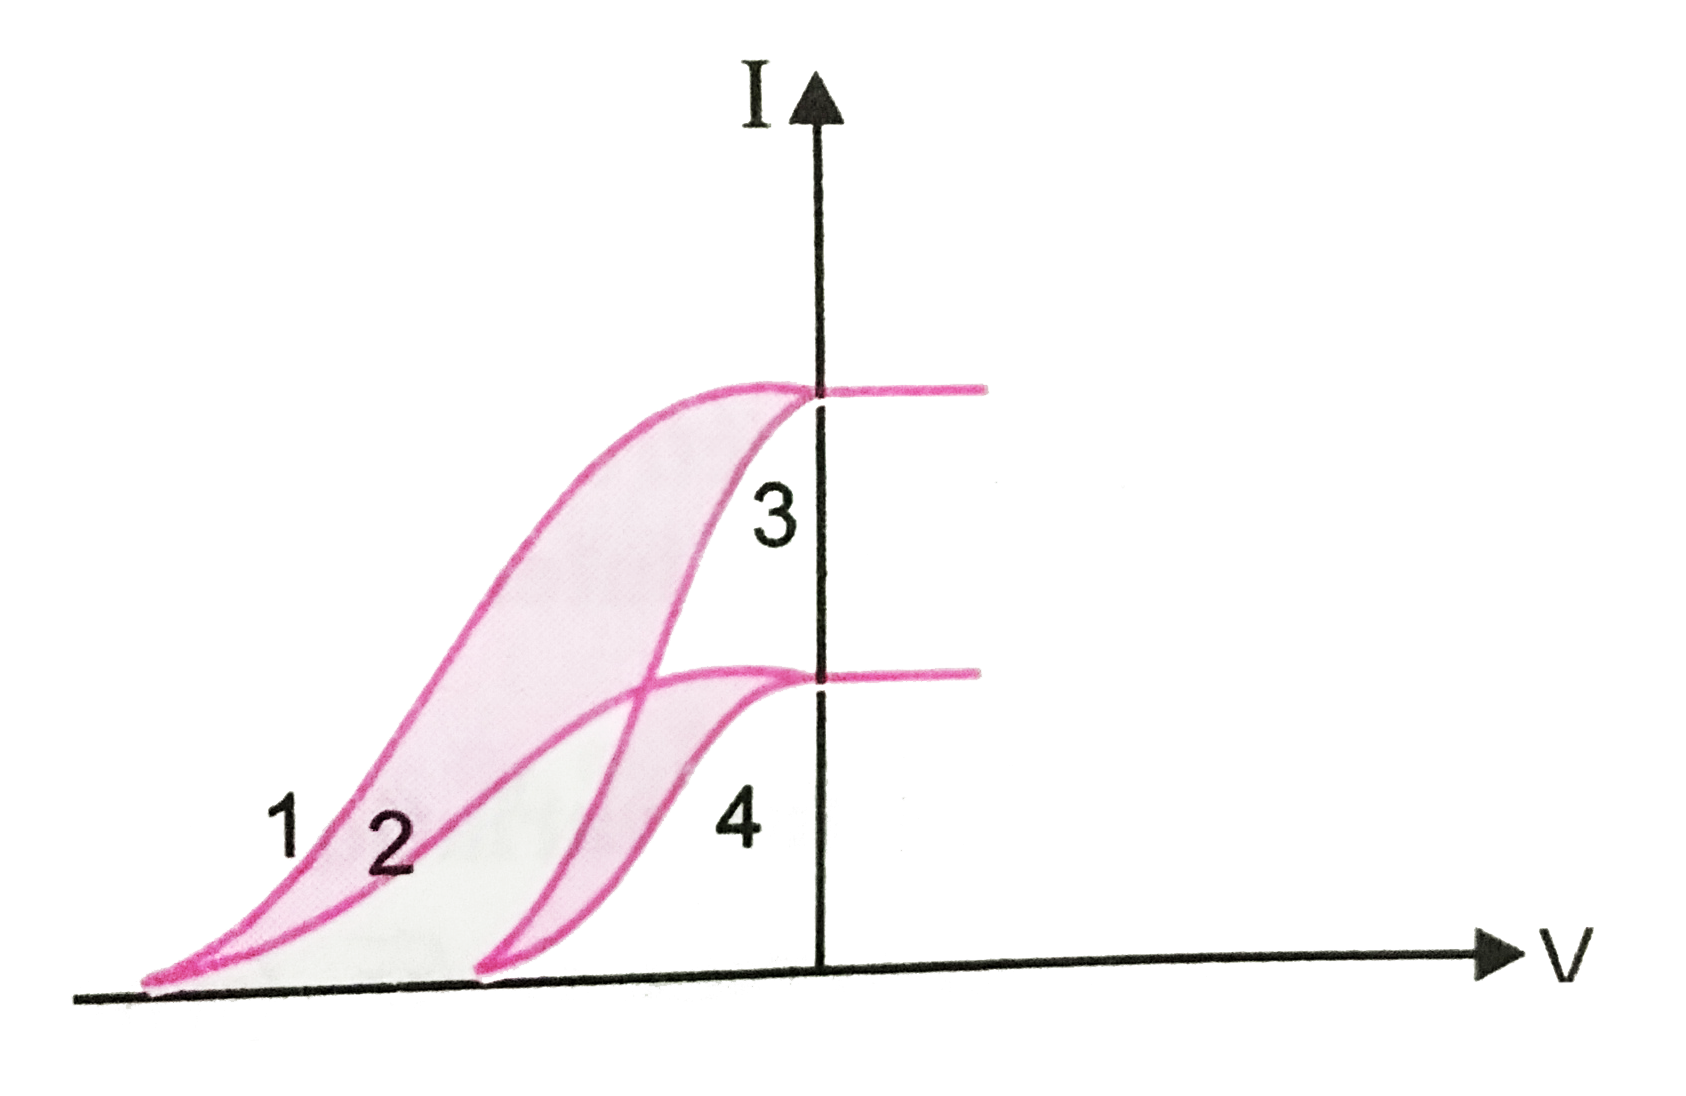
View SolutionDraw a plot showing the variation of photoelectric current versus the intensity of incident radiation on a given photosenstive surface.
View SolutionDraw a plot showing the variation of photoelectric current versus the intensity of incident radiation on a given photosensitive surface.
View SolutionWhich of the following alkali metals is frequently used as a cathode in the photoelectric cells ?
View SolutionWhich of the following statements is NOT correct for saturation current in a photoelectric cell?
View Solution

